. 2023 Sep 13;10(9):230277.
doi: 10.1098/rsos.230277. eCollection 2023 Sep.

Deconstructing the effects of stochasticity on transmission of hospital-acquired infections in ICUs

Affiliations

Deconstructing the effects of stochasticity on transmission of hospital-acquired infections in ICUs

Fardad Haghpanah et al. R Soc Open Sci. .

Abstract

The inherent stochasticity in transmission of hospital-acquired infections (HAIs) has complicated our understanding of transmission pathways. It is particularly difficult to detect the impact of changes in the environment on acquisition rate due to stochasticity. In this study, we investigated the impact of uncertainty (epistemic and aleatory) on nosocomial transmission of HAIs by evaluating the effects of stochasticity on the detectability of seasonality of admission prevalence. For doing so, we developed an agent-based model of an ICU and simulated the acquisition of HAIs considering the uncertainties in the behaviour of the healthcare workers (HCWs) and transmission of pathogens between patients, HCWs, and the environment. Our results show that stochasticity in HAI transmission weakens our ability to detect the effects of a change, such as seasonality patterns, on acquisition rate, particularly when transmission is a low-probability event. In addition, our findings demonstrate that data compilation can address this issue, while the amount of required data depends on the size of the said change and the degree of uncertainty. Our methodology can be used as a framework to assess the impact of interventions and provide decision-makers with insight about the minimum required size and target of interventions in a healthcare facility.

Keywords: agent-based modelling; hospital-acquired infection; intervention; seasonality; simulation.


Conflict of interest statement

We declare we have no competing interests.

Figures
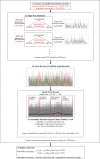
Figure 1.
Figure 1.
Schematic representation of the research methodology: (1) sampling seasonality and transmission parameters to create 1000 scenarios; (2) performing single ICU simulations for 300 times for each seasonality-transmission scenario (with other parameters sampled per each simulation); (3) compiling the results of 300 000 simulations including the values of sampled parameters into a pool of synthetic acquisition data; (4) examining seasonality detection rate using the Mann–Whitney U test for each seasonality-transmission scenario by incrementally increasing the size of samples drawn from our data pool; (5) training a logistic regression to identify the parameter space (seasonality strength, mean probability of transmission, and sample size) for which seasonality is statistically more likely to be detectable.
Figure 2.
Figure 2.
Histogram of acquisition (colonization) and infection rates at baseline (i.e. no seasonality effects) from 300 simulations.
Figure 3.
Figure 3.
Effect of acquisition probability on the detectability of seasonality effects. The left column is a scenario in which admission prevalence and mean probability of transmission are relatively low (0–5% and 1%, respectively), and the right column is an example of a scenario with relatively high admission prevalence and mean probability of transmission (5–10% and 8%, respectively). In both scenarios, seasonality strength is 100%. While adding more data (i.e. running more simulations) helps with identifying the seasonal pattern in the right column where acquisition is more likely, no seasonality effects can be detected in the left column where baseline acquisition rate is low.
Figure 4.
Figure 4.
Detectability of seasonality effects as a function of baseline acquisition rate (cases per 1000 patient-days) and seasonality strength of admission prevalence. Each data point represents a 365-day ICU simulation with the corresponding seasonality strength and resulting baseline quarterly acquisition rate, where the green circles represent those simulations for which the seasonality effect was detectable during the high season using the U-test, and the blue ones are simulations in which seasonality was undetectable. The shaded area shows the results of the logistic regression predictor (the parameter space corresponding to the ‘true’ seasonality detection predictor).
Figure 5.
Figure 5.
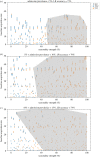
Effect of sample size on seasonality detectability as a function of baseline acquisition rate (cases per 1000 patient-days) and seasonality strength, when admission prevalence is lower than 5%. Green circles represent simulations for which the seasonality effect was detectable during the high season using the U-test, and the blue ones are simulations in which seasonality was undetectable. The shaded area shows the results of the logistic regression predictor (the parameter space corresponding to the ‘true’ seasonality detection predictor).
Figure 6.
Figure 6.
Cumulative probability distribution of the absolute increase in acquisition rate due to a 100% seasonality in admission prevalence (i.e. a 100% increase in admission prevalence during the peak of the high season with respect to the baseline), for different sample sizes (number of ICUs).
Figure 7.
Figure 7.
Effect of sample size on the detectability of the impact of an intervention to reduce probability of transmission as a function of baseline acquisition rate (cases per 1000 patient-days) and intervention size. Green circles represent simulations for which the impact of the intervention was detectable using the U-test, and the blue ones are simulations in which the intervention impact was undetectable. The shaded area shows the results of the logistic regression predictor (the parameter space corresponding to the ‘true’ intervention impact detection predictor).
Figure 8.
Figure 8.
Cumulative probability distribution of the impact of an intervention on acquisition rate for different sample sizes (number of ICUs). The intervention was designed such that it could reduce the probability of transmission during HCW–patient visits by 50% [CI: 5 percent-points].

References

    1. Magill SS, et al. 2018. Changes in prevalence of health care-associated infections in US hospitals. N. Engl. J. Med. 379, 1732-1744. ( 10.1056/NEJMoa1801550) - DOI - PMC - PubMed
    1. Zimlichman E, Henderson D, Tamir O, Franz C, Song P, Yamin CK, Keohane C, Denham CR, Bates DW. 2013. Health care-associated infections: a meta-analysis of costs and financial impact on the US health care system. JAMA Intern. Med. 173, 2039-2046. ( 10.1001/JAMAINTERNMED.2013.9763) - DOI - PubMed
    1. Cosgrove SE, Qi Y, Kaye KS, Harbarth S, Karchmer AW, Carmeli Y. 2005. The impact of methicillin resistance in Staphylococcus aureus bacteremia on patient outcomes: mortality, length of stay, and hospital charges. Infect. Control Hosp. Epidemiol. 26, 166-174. ( 10.1086/502522) - DOI - PubMed
    1. Wu J, Jones KB, Li H, Loucks OL. In press. Scaling and uncertainty analysis in ecology: methods and applications.
    1. Coleman HW, Steele WG. 2018. Experimentation, validation, and uncertainty analysis for engineers. Hoboken, NJ: John Wiley & Sons, Ltd.

LinkOut - more resources