. 2023 Sep 1:21:4354-4360.
doi: 10.1016/j.csbj.2023.08.033. eCollection 2023.

Thresholding Gini variable importance with a single-trained random forest: An empirical Bayes approach

Affiliations

Thresholding Gini variable importance with a single-trained random forest: An empirical Bayes approach

Robert Dunne et al. Comput Struct Biotechnol J. .

Abstract

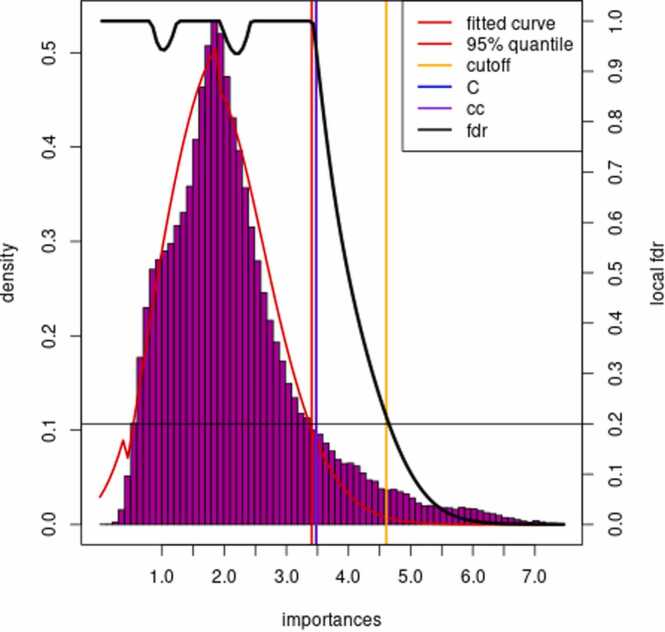
Random forests (RFs) are a widely used modelling tool capable of feature selection via a variable importance measure (VIM), however, a threshold is needed to control for false positives. In the absence of a good understanding of the characteristics of VIMs, many current approaches attempt to select features associated to the response by training multiple RFs to generate statistical power via a permutation null, by employing recursive feature elimination, or through a combination of both. However, for high-dimensional datasets these approaches become computationally infeasible. In this paper, we present RFlocalfdr, a statistical approach, built on the empirical Bayes argument of Efron, for thresholding mean decrease in impurity (MDI) importances. It identifies features significantly associated with the response while controlling the false positive rate. Using synthetic data and real-world data in health, we demonstrate that RFlocalfdr has equivalent accuracy to currently published approaches, while being orders of magnitude faster. We show that RFlocalfdr can successfully threshold a dataset of 106 datapoints, establishing its usability for large-scale datasets, like genomics. Furthermore, RFlocalfdr is compatible with any RF implementation that returns a VIM and counts, making it a versatile feature selection tool that reduces false discoveries.

Keywords: Empirical Bayes; Feature selection; Genetic analysis; Local FDR; Machine learning significance; Random forest.


Conflict of interest statement

The authors declare no conflict of interest.

Figures

Fig. 1
Fig. 1
(A) The two-group model where the data was generated by two processes, one of which produces a set of null statistics (density shown in red) and one which produces non-null statistics (density shown in green). (B) The histogram of z-values for the breast cancer genetic dataset . The red curve shows the N(0,1) distribution and the black curve shows the permutation null distribution, which is similar to the theoretical N(0,1) curve. The blue curve shows the empirical Bayes Gaussian fit to the data.
Fig. 2
Fig. 2
The steps in estimating the local FDR from distributions of log MDI importances. (A) The density of the log MDI importances shows a multi-modal distribution. The density p0f0z+1p0f1z is indicated in red. (B) Histogram of log MDI importances of features that were used greater than 30 times in the RF showing the desired distribution. (C) A spline is fit to the observed bin counts from (B) using standard Poisson generalised linear modelling (f, coloured in red). (D) Identify a value q such that to the left of q, f only depends on f0.
Fig. 3
Fig. 3
An example of the plot produced from the RFlocalfdr approach. The FDR curve is shown in black.
Fig. 4
Fig. 4
(A) The synthetic data is structured into bands and blocks. The colour and the y-axis show which band/block each feature/variable belongs to, not the feature value. Each ‘band’ contains ‘blocks’ of sizes 1, 2, 4, 8, l6, 32, and 64. Each block consists of correlated (identical variables), where each variable is {0,1,2}. The dependent variable y is 1 if any of X[, c(1, 2, 4, 8, 16, 32, 64)] is non-zero, so only band 1 has a relationship to the dependent variable. (B) The log MDI importances from the RF on the synthetic dataset, arranged by feature number and coloured by band. It is impossible to threshold the MDI importances to recover the only non-null features (coloured in red).
Fig. 5
Fig. 5
A Venn diagram of the overlaps in features (i.e., SNPs) classified as significant by AIR, Boruta, RFE, RFlocalfdr, and PIMP. AIR and PIMP are the outliers with more than 104 unique SNPs (i.e., not found by the other approaches) for each approach.

References

    1. Lundberg S.M., Erion G.G., Lee S.-I. Consistent Individualized Feature Attribution for Tree Ensembles. ArXiv180203888 Cs Stat 2019.
    1. Bayat A., Szul P., O’Brien A.R., Dunne R., Hosking B., Jain Y., et al. VariantSpark: cloud-based machine learning for association study of complex phenotype and large-scale genomic data. GigaScience. 2020:9. doi: 10.1093/gigascience/giaa077. - DOI - PMC - PubMed
    1. Janitza S., Hornung R. On the overestimation of random forest’s out-of-bag error. PLOS ONE. 2018;13 doi: 10.1371/journal.pone.0201904. - DOI - PMC - PubMed
    1. Grömping U. Variable importance assessment in regression: linear regression versus random forest. Am Stat. 2009;63:308–319. doi: 10.1198/tast.2009.08199. - DOI
    1. Lundberg S.M., Lee S.-I. A unified approach to interpreting model predictions. Adv Neural Inf Process Syst. 2017;30:4765–4774.

LinkOut - more resources