

Assessment of seasonality and normalization techniques for wastewater-based surveillance in Ontario, Canada
- PMID: 37711234
- PMCID: PMC10499178
- DOI: 10.3389/fpubh.2023.1186525
Assessment of seasonality and normalization techniques for wastewater-based surveillance in Ontario, Canada
Abstract
Introduction: Wastewater-based surveillance is at the forefront of monitoring for community prevalence of COVID-19, however, continued uncertainty exists regarding the use of fecal indicators for normalization of the SARS-CoV-2 virus in wastewater. Using three communities in Ontario, sampled from 2021-2023, the seasonality of a viral fecal indicator (pepper mild mottle virus, PMMoV) and the utility of normalization of data to improve correlations with clinical cases was examined.
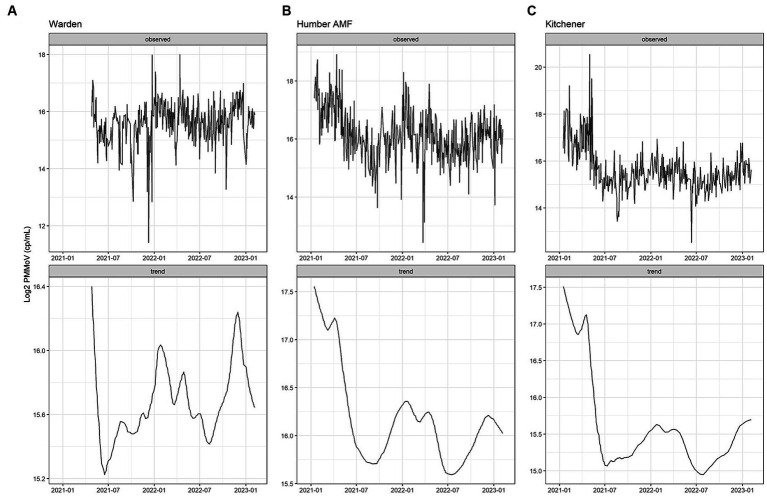
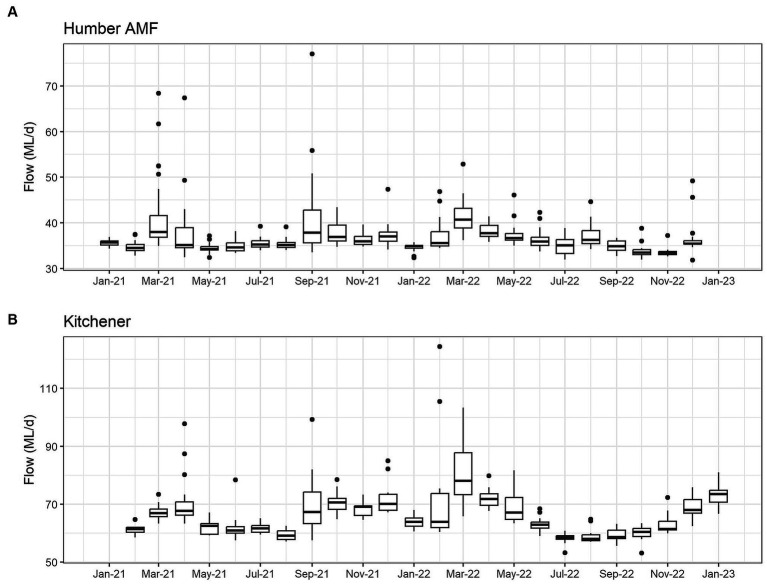
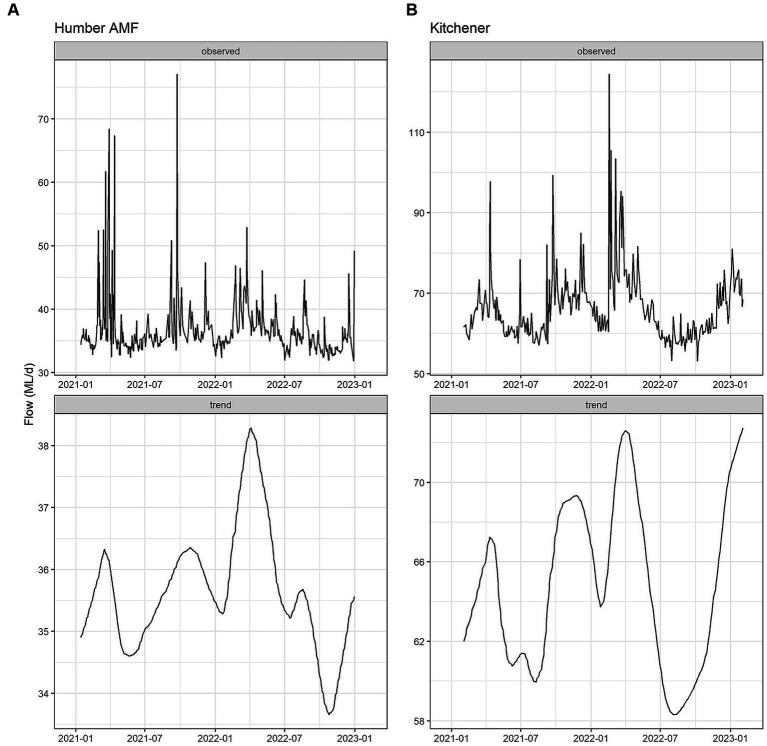
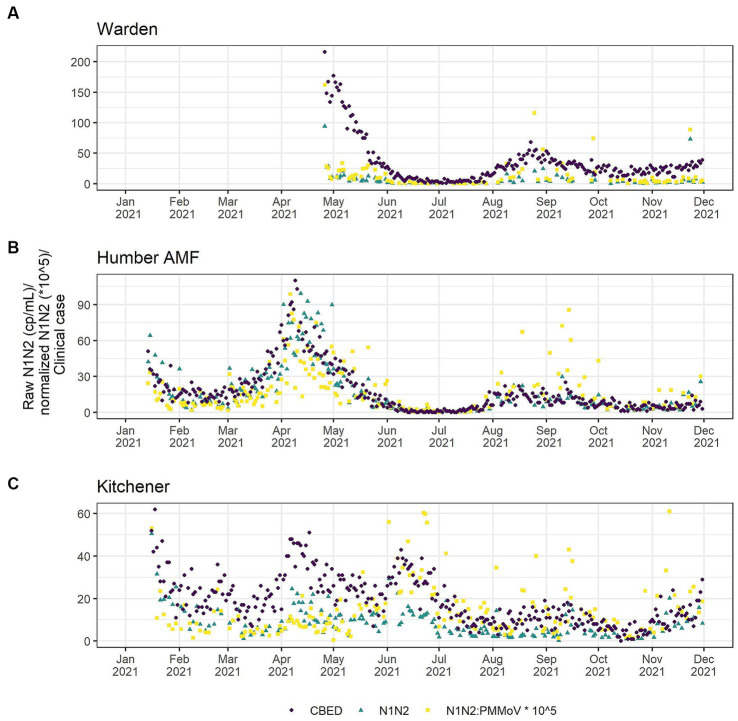
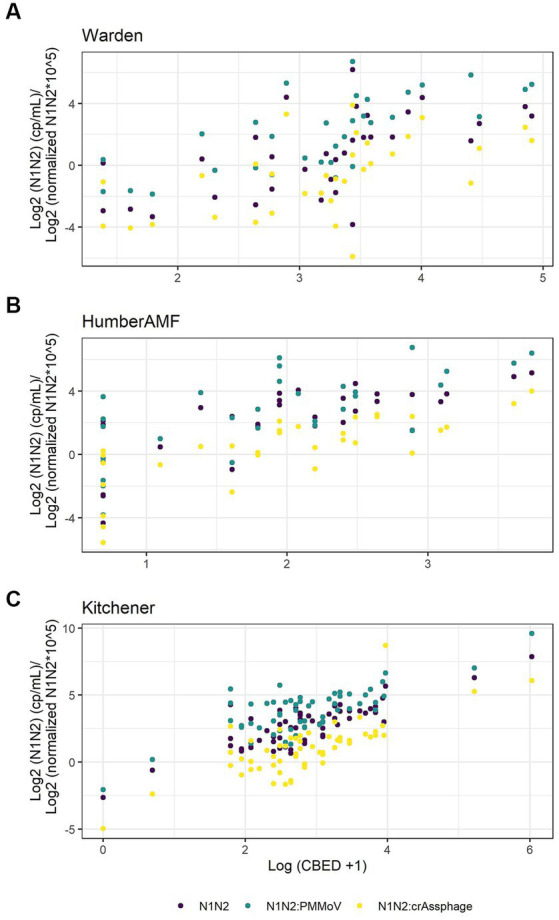
Methods: Wastewater samples from Warden, the Humber Air Management Facility (AMF), and Kitchener were analyzed for SARS-CoV-2, PMMoV, and crAssphage. The seasonality of PMMoV and flow rates were examined and compared by Season-Trend-Loess decomposition analysis. The effects of normalization using PMMoV, crAssphage, and flow rates were analyzed by comparing the correlations to clinical cases by episode date (CBED) during 2021.
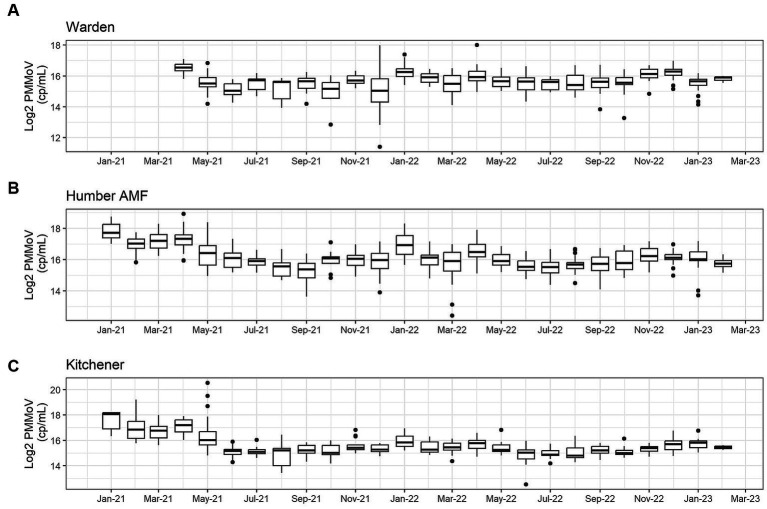
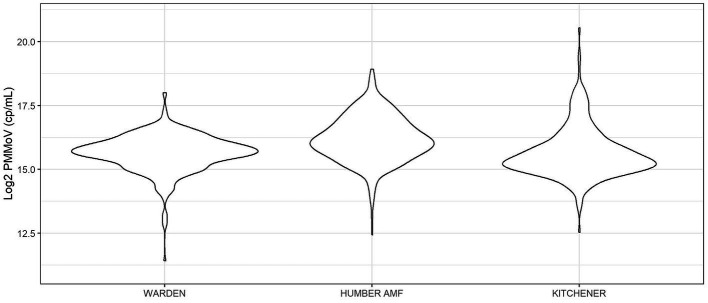
Results: Seasonal analysis demonstrated that PMMoV had similar trends at Humber AMF and Kitchener with peaks in January and April 2022 and low concentrations (troughs) in the summer months. Warden had similar trends but was more sporadic between the peaks and troughs for PMMoV concentrations. Flow demonstrated similar trends but was not correlated to PMMoV concentrations at Humber AMF and was very weak at Kitchener (r = 0.12). Despite the differences among the sewersheds, unnormalized SARS-CoV-2 (raw N1-N2) concentration in wastewater (n = 99-191) was strongly correlated to the CBED in the communities (r = 0.620-0.854) during 2021. Additionally, normalization with PMMoV did not improve the correlations at Warden and significantly reduced the correlations at Humber AMF and Kitchener. Flow normalization (n = 99-191) at Humber AMF and Kitchener and crAssphage normalization (n = 29-57) correlations at all three sites were not significantly different from raw N1-N2 correlations with CBED.
Discussion: Differences in seasonal trends in viral biomarkers caused by differences in sewershed characteristics (flow, input, etc.) may play a role in determining how effective normalization may be for improving correlations (or not). This study highlights the importance of assessing the influence of viral fecal indicators on normalized SARS-CoV-2 or other viruses of concern. Fecal indicators used to normalize the target of interest may help or hinder establishing trends with clinical outcomes of interest in wastewater-based surveillance and needs to be considered carefully across seasons and sites.
Keywords: PMMoV; SARS-CoV-2; crAssphage; fecal indicators; normalization; seasonality.
Copyright © 2023 Dhiyebi, Abu Farah, Ikert, Srikanthan, Hayat, Bragg, Qasim, Payne, Kaleis, Paget, Celmer-Repin, Folkema, Drew, Delatolla, Giesy and Servos.
Conflict of interest statement
The authors declare that the research was conducted in the absence of any commercial or financial relationships that could be construed as a potential conflict of interest.
Figures
References
-
- Li X, Zhang S, Sherchan S, Orive G, Lertxundi U, Haramoto E, et al. Correlation between SARS-CoV-2 RNA concentration in wastewater and COVID-19 cases in community: a systematic review and meta-analysis. J Hazard Mater. (2023) 441:129848. doi: 10.1016/j.jhazmat.2022.129848, PMID: - DOI - PMC - PubMed
-
- von Sperling M. Wastewater characteristics, treatment and disposal (2015). 9781780402086 p Available at: http://iwaponline.com/ebooks/book-pdf/1075/wio9781780402086.pdf.
-
- Bertels X, Demeyer P, van den Bogaert S, Boogaerts T, van Nuijs ALN, Delputte P, et al. Factors influencing SARS-CoV-2 RNA concentrations in wastewater up to the sampling stage: a systematic review. Sci Total Environ. (2022) 820:153290. doi: 10.1016/j.scitotenv.2022.153290, PMID: - DOI - PMC - PubMed
Publication types
MeSH terms
Substances
LinkOut - more resources
Full Text Sources
Medical
Miscellaneous