

Data-Driven Placement of PM2.5 Air Quality Sensors in the United States: An Approach to Target Urban Environmental Injustice
- PMID: 37711364
- PMCID: PMC10499371
- DOI: 10.1029/2023GH000834
Data-Driven Placement of PM2.5 Air Quality Sensors in the United States: An Approach to Target Urban Environmental Injustice
Abstract
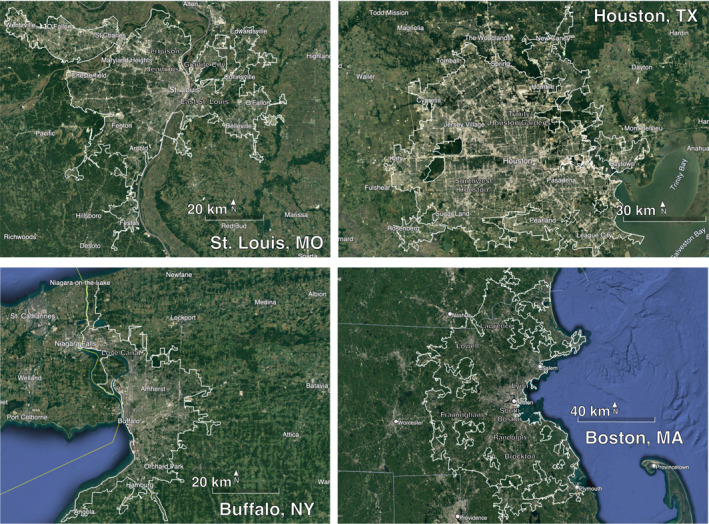
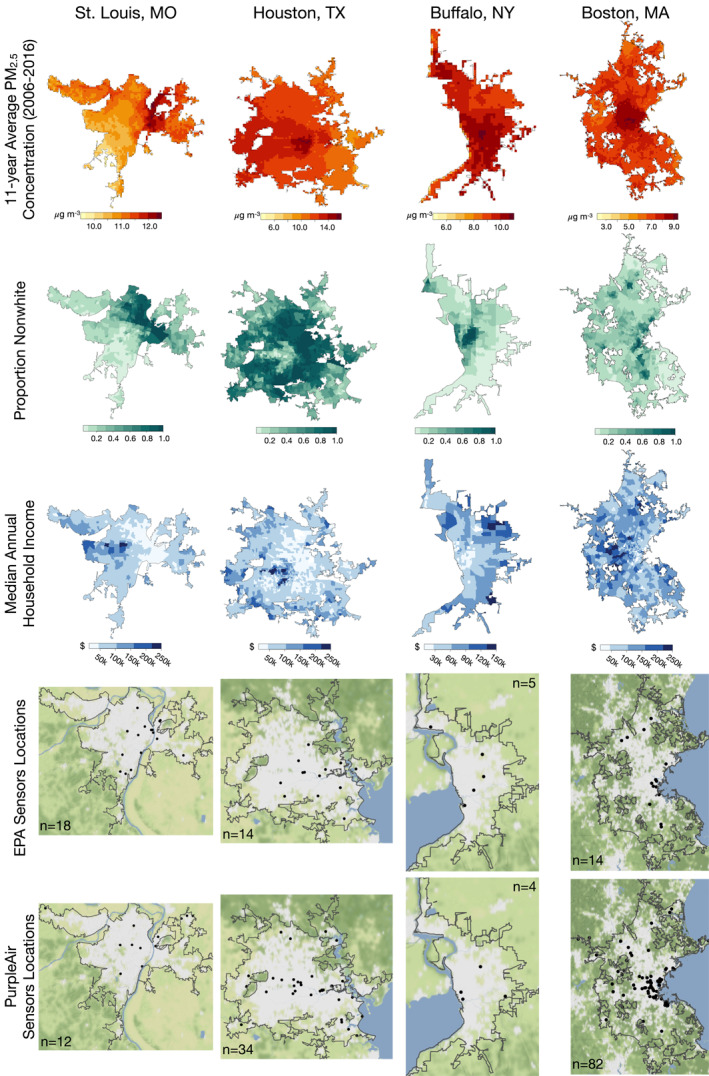
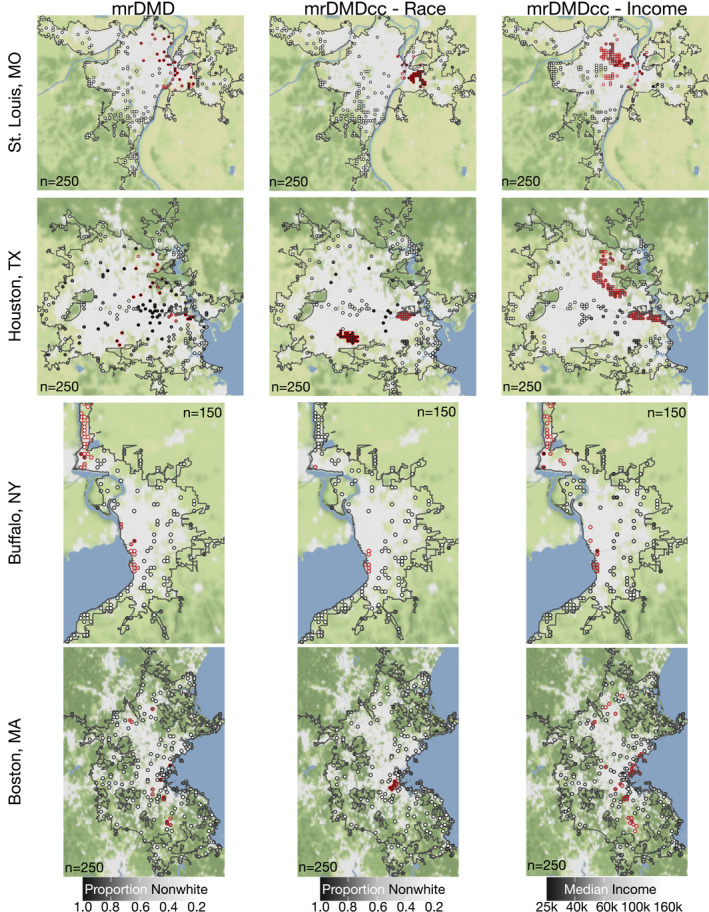
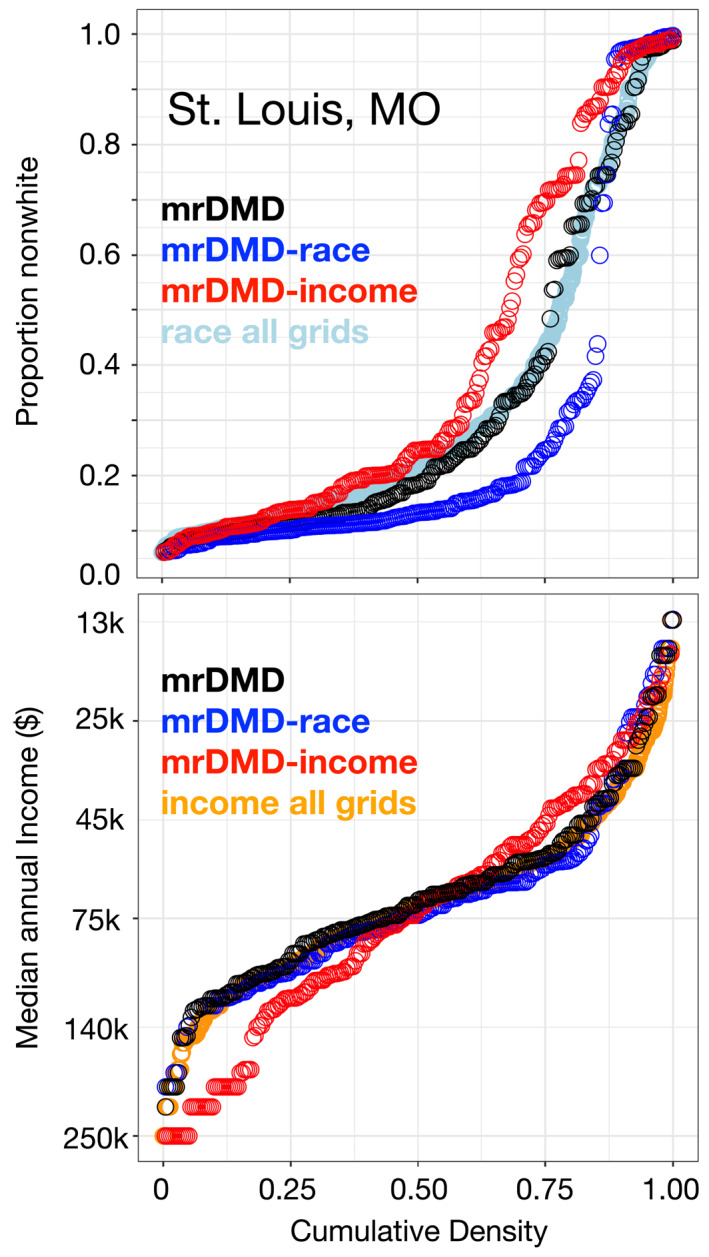
In the United States, citizens and policymakers heavily rely upon Environmental Protection Agency mandated regulatory networks to monitor air pollution; increasingly they also depend on low-cost sensor networks to supplement spatial gaps in regulatory monitor networks coverage. Although these regulatory and low-cost networks in tandem provide enhanced spatiotemporal coverage in urban areas, low-cost sensors are located often in higher income, predominantly White areas. Such disparity in coverage may exacerbate existing inequalities and impact the ability of different communities to respond to the threat of air pollution. Here we present a study using cost-constrained multiresolution dynamic mode decomposition (mrDMDcc) to identify the optimal and equitable placement of fine particulate matter (PM2.5) sensors in four U.S. cities with histories of racial or income segregation: St. Louis, Houston, Boston, and Buffalo. This novel approach incorporates the variation of PM2.5 on timescales ranging from 1 day to over a decade to capture air pollution variability. We also introduce a cost function into the sensor placement optimization that represents the balance between our objectives of capturing PM2.5 extremes and increasing pollution monitoring in low-income and nonwhite areas. We find that the mrDMDcc algorithm places a greater number of sensors in historically low-income and nonwhite neighborhoods with known environmental pollution problems compared to networks using PM2.5 information alone. Our work provides a roadmap for the creation of equitable sensor networks in U.S. cities and offers a guide for democratizing air pollution data through increasing spatial coverage of low-cost sensors in less privileged communities.
Keywords: citizen science; environmental justice; fine particulate matter (PM2.5); sensor networks; sensor placement.
© 2023 The Authors. GeoHealth published by Wiley Periodicals LLC on behalf of American Geophysical Union.
Conflict of interest statement
The authors declare no conflicts of interest relevant to this study.
Figures
Similar articles
-
On the distribution of low-cost PM2.5 sensors in the US: demographic and air quality associations.J Expo Sci Environ Epidemiol. 2021 May;31(3):514-524. doi: 10.1038/s41370-021-00328-2. Epub 2021 May 6. J Expo Sci Environ Epidemiol. 2021. PMID: 33958706
-
A land use regression model using machine learning and locally developed low cost particulate matter sensors in Uganda.Environ Res. 2021 Aug;199:111352. doi: 10.1016/j.envres.2021.111352. Epub 2021 May 24. Environ Res. 2021. PMID: 34043968
-
Social Susceptibility to Multiple Air Pollutants in Cardiovascular Disease.Res Rep Health Eff Inst. 2021 Jul;2021(206):1-71. Res Rep Health Eff Inst. 2021. PMID: 36004603 Free PMC article.
-
Improving accuracy of air pollution exposure measurements: Statistical correction of a municipal low-cost airborne particulate matter sensor network.Environ Pollut. 2021 Jan 1;268(Pt B):115833. doi: 10.1016/j.envpol.2020.115833. Epub 2020 Oct 15. Environ Pollut. 2021. PMID: 33120139
-
Trends in Excess Morbidity and Mortality Associated with Air Pollution above American Thoracic Society-Recommended Standards, 2008-2017.Ann Am Thorac Soc. 2019 Jul;16(7):836-845. doi: 10.1513/AnnalsATS.201812-914OC. Ann Am Thorac Soc. 2019. PMID: 31112414 Review.
Cited by
-
Outdoor air pollution exposure and uterine cancer incidence in the Sister Study.J Natl Cancer Inst. 2024 Jun 7;116(6):948-956. doi: 10.1093/jnci/djae031. J Natl Cancer Inst. 2024. PMID: 38346713 Free PMC article.
-
Effects of extreme air pollution and El Niño Southern Oscillation on insufficient sleep: a cross-sectional study.BMC Public Health. 2025 Jun 4;25(1):2074. doi: 10.1186/s12889-025-23316-9. BMC Public Health. 2025. PMID: 40468248 Free PMC article.
-
Physics-Based Spatial Oversampling of TROPOMI NO2 Observations to US Neighborhoods Reveals the Disparities of Air Pollution.Geohealth. 2025 Aug 16;9(8):e2025GH001423. doi: 10.1029/2025GH001423. eCollection 2025 Aug. Geohealth. 2025. PMID: 40822114 Free PMC article.
-
Improved daily PM2.5 estimates in India reveal inequalities in recent enhancement of air quality.Sci Adv. 2025 Jan 24;11(4):eadq1071. doi: 10.1126/sciadv.adq1071. Epub 2025 Jan 24. Sci Adv. 2025. PMID: 39854471 Free PMC article.
References
-
- Bhutta, N. , Chang, A. C. , Dettling, L. J. , & Hsu, J. W. (2020). Disparities in wealth by race and ethnicity in the 2019 survey of consumer finances. FEDS Notes. Board of Govenors of the Federal Reserve System.
-
- Bond, T. C. , Bhardwaj, E. , Dong, R. , Jogani, R. , Jung, S. , Roden, C. , et al. (2007). Historical emissions of black and organic carbon aerosol from energy‐related combustion. Global Biogeochemical Cycles, 21(2), 1850–2000. 10.1029/2006GB002840 - DOI
-
- Brunton, S. L. , & Kutz, J. N. (2019). Data‐driven science and engineering: Machine learning, dynamical systems, and control. Cambridge University Press. 10.1017/9781108380690 - DOI