. 2023 Aug 30:17:1211486.
doi: 10.3389/fncel.2023.1211486. eCollection 2023.

Neuroprotection by upregulation of the major histocompatibility complex class I (MHC I) in SOD1G93A mice

Affiliations

Neuroprotection by upregulation of the major histocompatibility complex class I (MHC I) in SOD1G93A mice

Ana Laura M R Tomiyama et al. Front Cell Neurosci. .

Erratum in

Abstract

Amyotrophic lateral sclerosis (ALS) is a neurodegenerative disease that progressively affects motoneurons, causing muscle atrophy and evolving to death. Astrocytes inhibit the expression of MHC-I by neurons, contributing to a degenerative outcome. The present study verified the influence of interferon β (IFN β) treatment, a proinflammatory cytokine that upregulates MHC-I expression, in SOD1G93A transgenic mice. For that, 17 days old presymptomatic female mice were subjected to subcutaneous application of IFN β (250, 1,000, and 10,000 IU) every other day for 20 days. Rotarod motor test, clinical score, and body weight assessment were conducted every third day throughout the treatment period. No significant intergroup variations were observed in such parameters during the pre-symptomatic phase. All mice were then euthanized, and the spinal cords collected for comparative analysis of motoneuron survival, reactive gliosis, synapse coverage, microglia morphology classification, cytokine analysis by flow cytometry, and RT-qPCR quantification of gene transcripts. Additionally, mice underwent Rotarod motor assessment, weight monitoring, and neurological scoring. The results show that IFN β treatment led to an increase in the expression of MHC-I, which, even at the lowest dose (250 IU), resulted in a significant increase in neuronal survival in the ALS presymptomatic period which lasted until the onset of the disease. The treatment also influenced synaptic preservation by decreasing excitatory inputs and upregulating the expression of AMPA receptors by astrocytes. Microglial reactivity quantified by the integrated density of pixels did not decrease with treatment but showed a less activated morphology, coupled with polarization to an M1 profile. Disease progression upregulated gene transcripts for pro- and anti-inflammatory cytokines, and IFN β treatment significantly decreased mRNA expression for IL4. Overall, the present results demonstrate that a low dosage of IFN β shows therapeutic potential by increasing MHC-I expression, resulting in neuroprotection and immunomodulation.

Keywords: ALS therapy; IFN β; MHC-I; amyotrophic lateral sclerosis; gliosis; neuroprotection.


Conflict of interest statement

The authors declare that the research was conducted in the absence of any commercial or financial relationships that could be construed as a potential conflict of interest.

Figures

FIGURE 1
FIGURE 1
Panoramic view of transverse sections of the spinal cord correlating toluidine blue staining with anti-CGRP-positive motoneurons. The inset shows the motoneuron pool, the region where neuronal survival and immunofluorescence analyzes were performed. Scale bar = 150 μm.
FIGURE 2
FIGURE 2
Anti-MHC-I immunostaining in the ventral horn of the spinal cord, in (A), view of a spinal cord hemisection showing the pattern of anti-MHC-I immunostaining. The red circle indicates the Rexed lamina IX, where MHC-I expression was analyzed. Scale bar = 150 μm. Representative images of (B) NTG, (C) vehicle, (D) 250 IU, (E) 1,000 IU, and (F) 10,000 IU. (G) Quantification of the integrated density of pixels for MHC-I labeling. Figures illustrating double labeling of Dapi (blue) and MHC-I (green) along with (H) NeuN, (I) GFAP, and (J) Iba-1 (shown in red). Note that IFN β treatment is related to an increased MHC-I expression at all doses compared to the NTG and vehicle groups, mainly in motoneurons and astrocytes (One-Way ANOVA followed by Bonferroni’s post-test; *p < 0.05, **p < 0.01, and ***p < 0.001). Scale bar = 50 μm.
FIGURE 3
FIGURE 3
Cross-sections of the ventral horn of the lumbar spinal cord at the pre-symptomatic period. Representative images of the (A) NTG, (B) vehicle, (C) IFN β 250 IU, (D) IFN β 1,000 IU, (E) IFN β 10,000 IU, (F) graph showing the mean neuronal survival in the different experimental groups in the pre-symptomatic period (90 days of life). Representative images of the spinal motoneurons in the initial symptomatic period (100 days of life) in (G) NTG, (H) vehicle, (I) IFN β 250 IU experimental groups. (J) Graph showing the mean neuronal survival at 100 days. Even in the presymptomatic period, the animals with ALS showed a reduction in neuronal survival compared to the control group (****p < 0.0001). Importantly, IFN β treatment led to 31% up to 34% more preservation of motoneurons in 250 and 1,000 IU, respectively as compared to the vehicle group (*p < 0.05). In the initial symptomatic period, the vehicle group showed an even greater loss of motor neurons compared to the control group (****p < 0.0001), while the treatment with IFN β 250 IU was able to preserve about 40% more when compared to the vehicle (***p < 0.0005). Scale bar = 50 μm.
FIGURE 4
FIGURE 4
Anti-synaptophysin immunostaining in the ventral horn of the spinal cord. Double labeling counterstained with [(A), blue] DAPI, showing [(B), red] Synaptophysin, and [(C), green] NeuN and (D) the merge, to evidence the immunostaining around the motoneurons located at the lamina IX of Rexed. Representative images of the (E) NTG, (F) vehicle, (G) 250 IU, (H) 1,000 IU, and (I) 10,000 IU. (J) Quantification of synaptophysin immunostaining in which the vehicle group showed a reduction of more than 50% of synaptophysin immunostaining when compared to the control group (NTG—non-transgenic counterpart) (****p < 0.0001). However, IFN β treatment at doses of 250, 1,000, and 10,000 IU preserved immunostaining by 31, 21, and 18%, respectively (250 IU: **p < 0.01; 1,000 IU: **p < 0.01 and 10,000 IU: **p < 0.01). Scale bar = 50 μm.
FIGURE 5
FIGURE 5
GAD65 immunostaining in the ventral horn of the spinal cord. Double labeling counterstained with [(A), blue] DAPI, showing [(B), green] GAD65, and [(C), red] NeuN and (D) the merge, to evidence the immunostaining around the motoneurons located at the lamina IX of Rexed. Representative images of the (E) NTG, (F) vehicle, (G) 250 IU, (H) 1,000 IU, and (I) 10,000 IU. (J) Quantification of the integrated density of pixels for anti-GAD65 labeling, a marker of inhibitory inputs. The transgenic animals showed an increase in immunostaining as compared to the non-transgenic counterpart (NTG group; ****p < 0.0001). IFN β treatment in all studied doses did not show significant differences as compared to the vehicle. Scale bar = 50 μm.
FIGURE 6
FIGURE 6
V-GLUT-1 immunostaining in the ventral horn of the spinal cord. Double labeling counterstained with [(A), blue] DAPI, showing [(B), green] V-GLUT-1, and [(C), red] NeuN and (D) the merge, to evidence the immunostaining around the motoneurons located at the lamina IX of Rexed. Representative images of the (E) NTG, (F) vehicle, (G) 250 IU, (H) 1,000 IU, and (I) 10,000 IU. (J) Quantification of the integrated density of pixels for the V-GLUT-1 antibody, labeling excitatory inputs. The transgenic group showed a decrease in immunostaining as compared to the non-transgenic counterpart. The treatments further decreased immunostaining in a dose-dependent manner. (IFN β 250 UI: **p < 0.01; IFN β 1,000 UI: **p < 0.01, and IFN β 10,000 UI: ****p < 0.0001). Scale bar = 50 μm.
FIGURE 7
FIGURE 7
Anti-GFAP immunostaining in the ventral horn of the spinal cord. Double labeling counterstained with DAPI [(A), blue], GFAP [(B), green], and NeuN [(C), red], and the merge (D) to evidence the immunostaining around the motoneurons located at the lamina IX of Rexed. Representative images of the (E) NTG, (F) vehicle, (G) 250 IU, (H) 1,000 IU, and (I) 10,000 IU. (J) Quantification of the integrated density of pixels for GFAP labeling, a marker for astroglial reactivity. Observe the disease-related GFAP upregulation in the Vehicle group, and its downregulation following the 250, 1,000 IU (**p < 0.01), and 10,000 IU IFN β treatment (***p < 0.001), compared to the vehicle group. The reactivity of the group treated with IFN β 1,000 IU nearly reached the level of the NTG (*p < 0.05), whereas the group treated with IFN β 10,000 IU practically equaled it. Scale bar = 50 μm.
FIGURE 8
FIGURE 8
AMPAr immunostaining in the ventral horn of the spinal cord in (A) NTG, (B) vehicle, (C) IFN β–250 IU, (D) 1,000 IU, and (E) 10,000 IU. In (F), Quantification of the integrated density of pixels for AMPAr labeling, depicting AMPA receptor presence in the gray matter. (G) Staining for cell nuclei (DAPI, blue), (H) immunolabeling for reactive astrocytes (GFAP, red), and (I) AMPAr (green), respectively. (J) Merge image evidencing that most expression of the AMPAr is present in astrocytes (NTG vs. IFN β 250 IU: *p < 0.05; NTG vs. IFN β 1,000 IU: ***p < 0.001; Vehicle vs. IFN β 10,000 IU: *p < 0.05). Scale bar = 50 μm.
FIGURE 9
FIGURE 9
Morphological analysis of microglia. (A) Iba-1 integrated density of pixels analysis showing double labeling counterstained with (a1) DAPI, showing (a2) Iba-1, (a3) NeuN, and (a4) the merge to evidence the immunostaining around the motoneurons located at the lamina IX of Rexed. Representative photomicrographs of (a5) NTG, (a6) Vehicle, (a7) 250 IU, (a8) 1,000 IU, and (a9) 10,000 I. In (a10), Quantification of the integrated density of pixels for Iba-1 labeling. Increased microglial reactivity is observed in all TG when compared with NTG (****p < 0.0001). IFN β–1,000 IU group displayed the most intense Iba-1 upregulation (***p < 0.001, compared to the vehicle; **p < 0.01 compared to 250 IU, and *p < 0.05 compared to 10,000 IU). Scale bar = 50 μm. (B) Iba-1 positive microglia classified according to morphological aspects into surveillant (Types I and II) and activated (Types III, IV, and V). Scale bar = 50 μm. (C) Quantification of microglial cells into surveillant, and (D) activated. Note that IFN β treatment decreased the number of activated microglia when compared to the Vehicle group (**p < 0.001). (E) Detailed quantification of microglial types for each experimental group (NTG vs. vehicle: ***p < 0.001, ****p < 0.0001; NTG vs. IFN β 250 IU: ###p < 0.001, ####p < 0.0001; Vehicle vs. IFN β 250 IU: $p < 0.05; $$$$p < 0.0001). Two-way ANOVA, followed by Tukey’s post-test (*NTG vs. Vehicle; #NTG vs. IFN β 250 IU; $Vehicle vs. IFN β 250 IU).
FIGURE 10
FIGURE 10
Effects of ALS and a low dose of IFN β administration on microglial phenotyping. (A) Scatter plot depicting size (X-axis, forward scatter, FSC-A) vs. cell granularity (Y-axis, side scatter, SSC-A) that allows the delimitation of the live microglial cells gate (herein corresponding to 84.29% of the total events acquired by the cytometer). (B) Representative flow cytometry dot plots showing TNFα and CD68 levels on pro-inflammatory microglia, and IL10 and CD206 on anti-inflammatory microglia from all experimental groups. Graphs with the percentages of (C) pro-, and (D) anti-inflammatory microglia. Note the increase in pro-inflammatory polarized microglia after IFN β administration (*p < 0.05, compared to NTG, and **p < 0.01 compared to vehicle). (E) Stacked bar graph summing up the percentages of polarized (anti- or pro-inflammatory microglia) and cells grouped in between these two polar phenotypes.
FIGURE 11
FIGURE 11
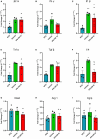
Relative quantification of gene expression of the β2 m (A), Ifn γ (B), Il1 β (C), Tnf α (D), Tgf β (E), Il4 (F), Nos2 (G), Arg 1 (H), and Cgrp (I) in the lumbar spinal cord of non-transgenic (NTG) and transgenic animals in the presymptomatic stage of ALS (*p < 0.05 and **p < 0.01 as compared to NTG; $p < 0.05 compared to the vehicle).

Similar articles

Cited by

References

    1. Abercrombie M., Johnson M. (1946). Quantitative histology of Wallerian degeneration; nuclear population in rabbit sciatic nerve. J. Anat. 80 37–50. - PubMed
    1. Andersson M., Khademi M., Wallström E., Olsson T. (2011). Cytokine profile in interferon-ß treated multiple sclerosis patients: Reduction of interleukin-10 mRNA expressing cells in peripheral blood. Eur. J. Neurol. 4 567–571.
    1. Antonella Gasbarri A. (2014). “Involvement of glutamate in learning and memory,” in Identification of neural markers accompanying memory, ed. Meneses A. (Amsterdam: Elsevier; ).
    1. Appel S., Beers D., Zhao W. (2021). Amyotrophic lateral sclerosis is a systemic disease: Peripheral contributions to inflammation-mediated neurodegeneration. Curr. Opin. Neurol. 34 765–772. 10.1097/WCO.0000000000000983 - DOI - PubMed
    1. Beers D., Henkel J., Xiao Q., Zhao W., Wang J., Yen A., et al. (2006). Wild-type microglia extend survival in PU.1 knockout mice with familial amyotrophic lateral sclerosis. Proc. Natl. Acad. Sci. U. S. A. 103 16021–16026. 10.1073/pnas.0607423103 - DOI - PMC - PubMed