. 2023 Aug 30:14:1152003.
doi: 10.3389/fimmu.2023.1152003. eCollection 2023.

Changes in subcutaneous white adipose tissue cellular composition and molecular programs underlie glucose intolerance in persons with HIV

Affiliations

Changes in subcutaneous white adipose tissue cellular composition and molecular programs underlie glucose intolerance in persons with HIV

Samuel S Bailin et al. Front Immunol. .

Abstract

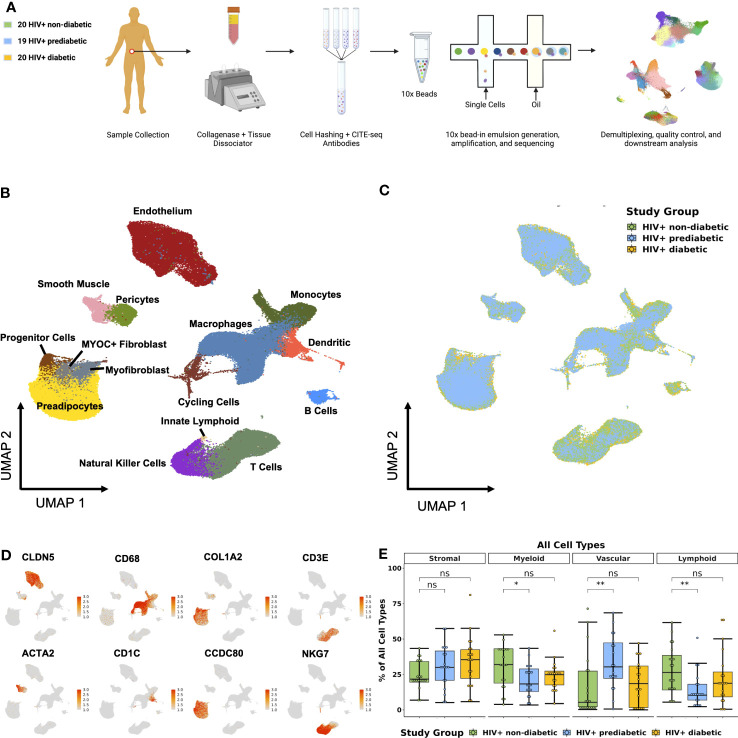
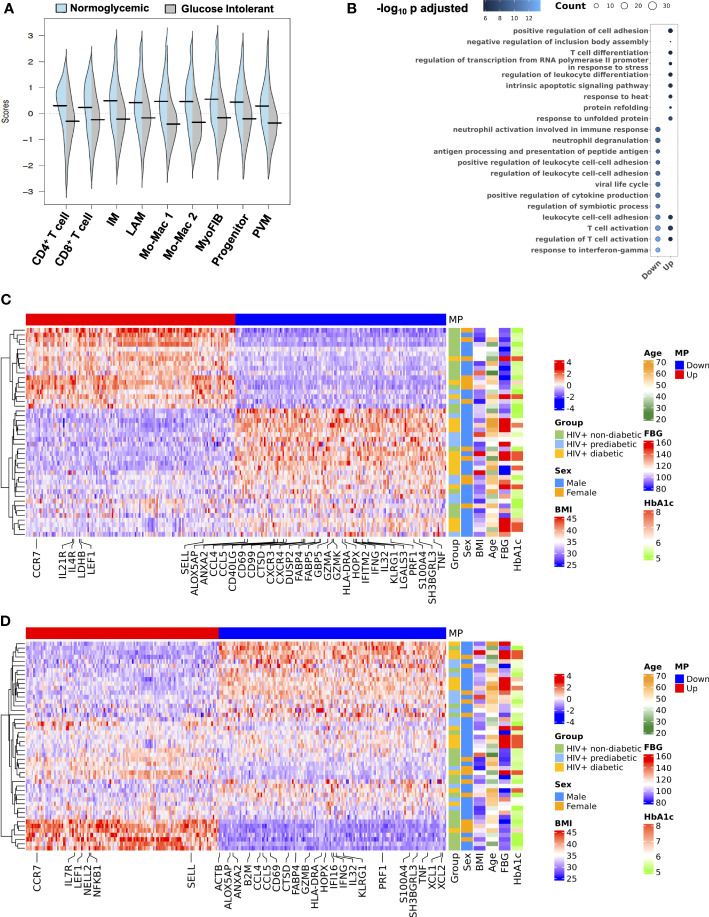
Introduction: Subcutaneous adipose tissue (SAT) is a critical regulator of systemic metabolic homeostasis. Persons with HIV (PWH) have an increased risk of metabolic diseases and significant alterations in the SAT immune environment compared with the general population.

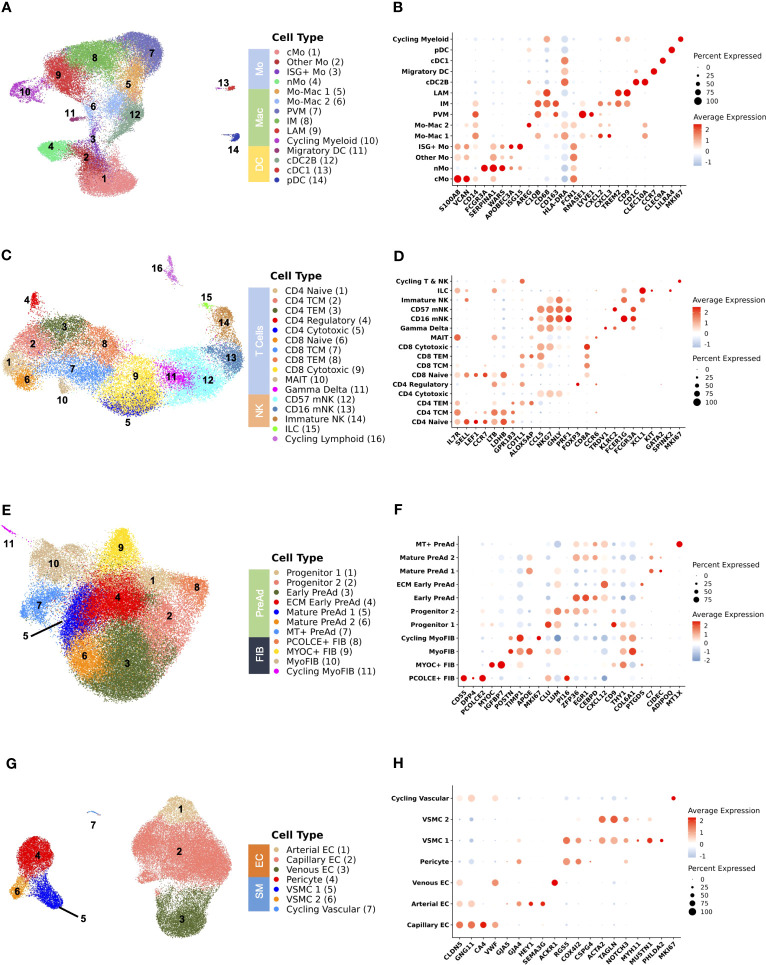
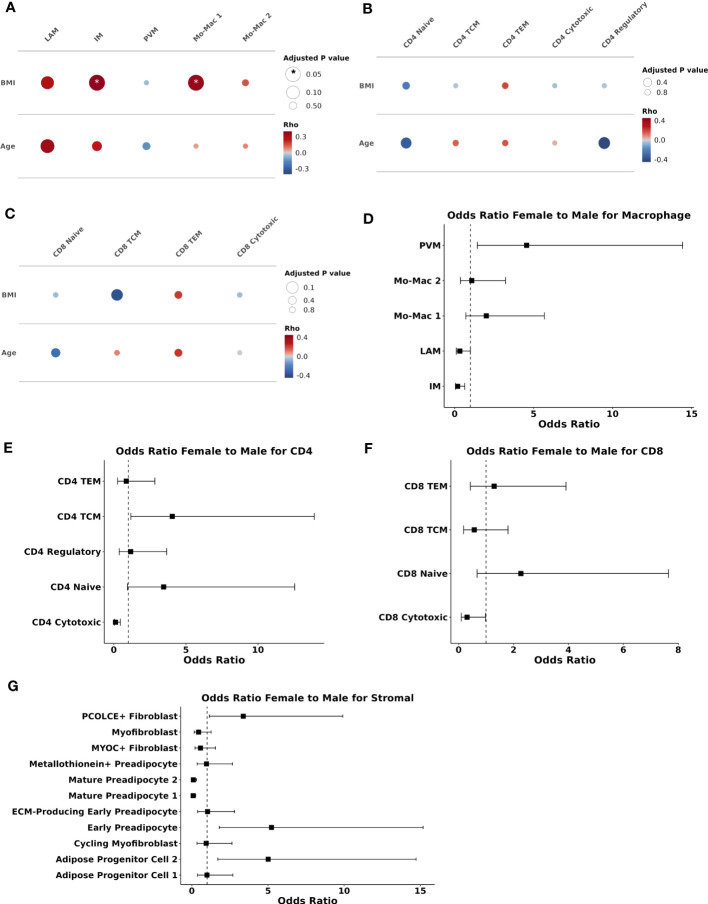
Methods: We generated a comprehensive single-cell multi-omic SAT atlas to characterize cellular compositional and transcriptional changes in 59 PWH across a spectrum of metabolic health.

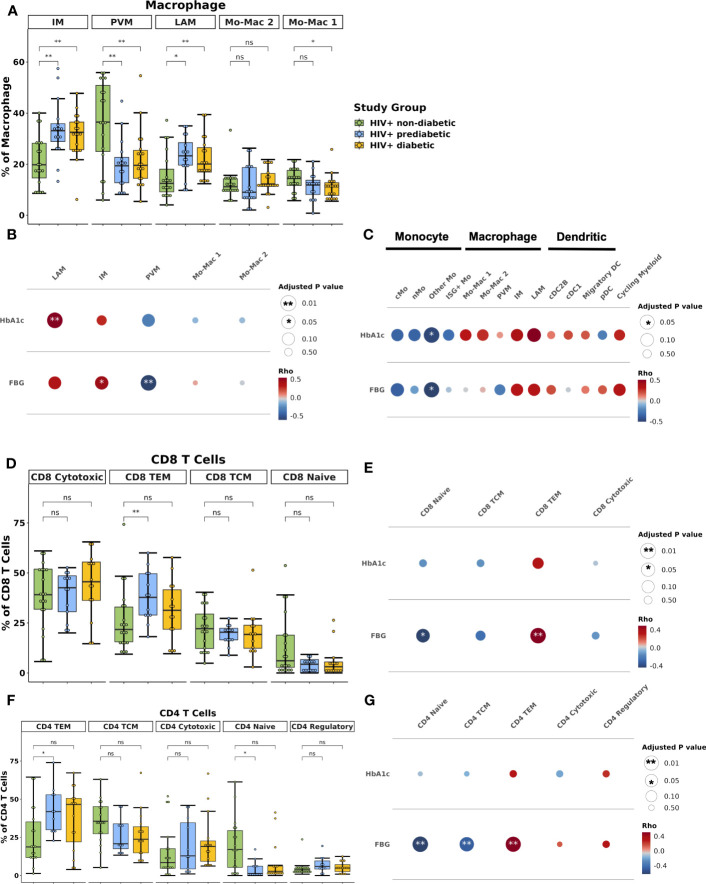
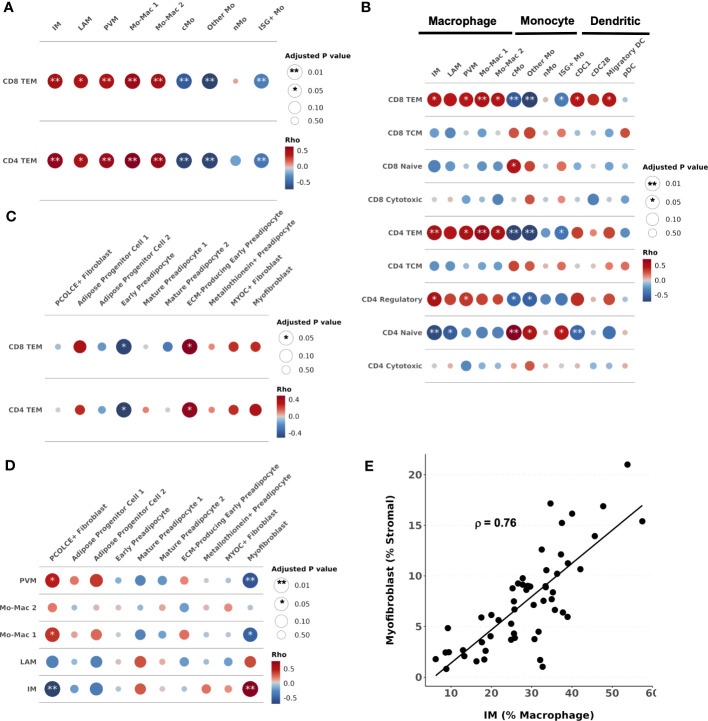
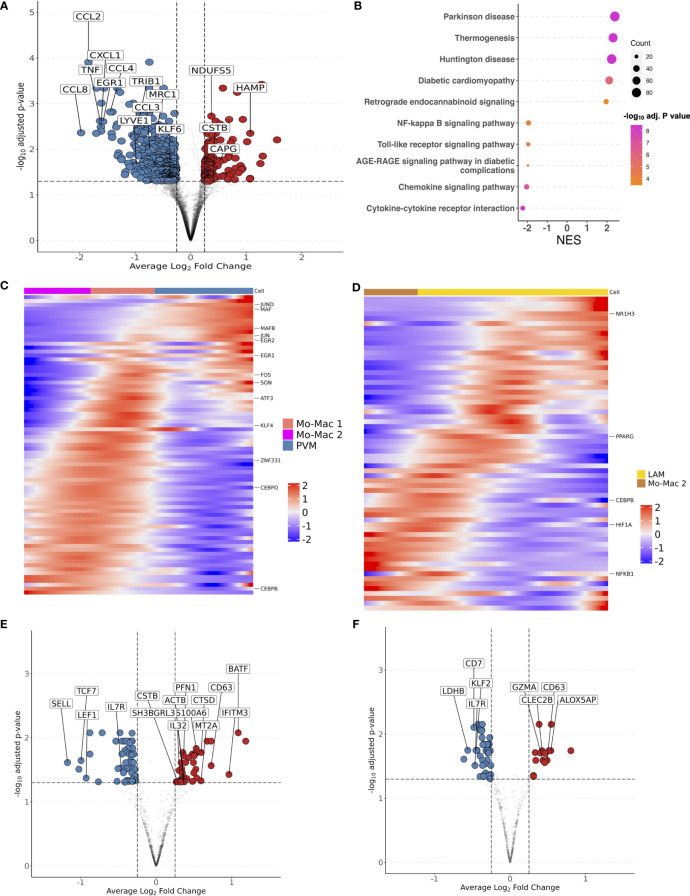
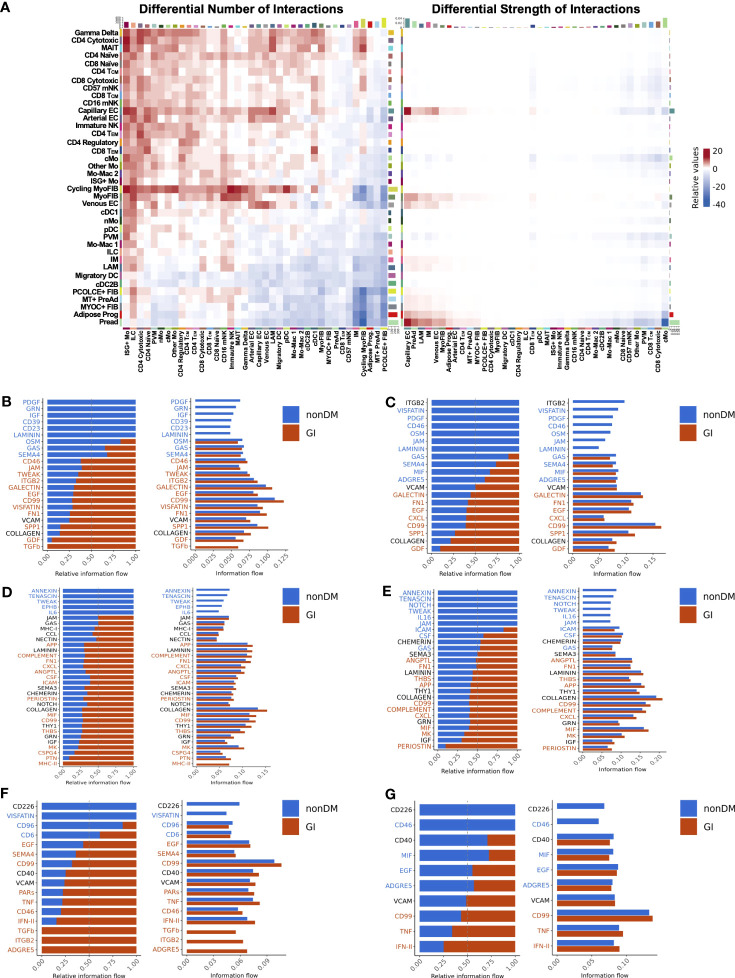
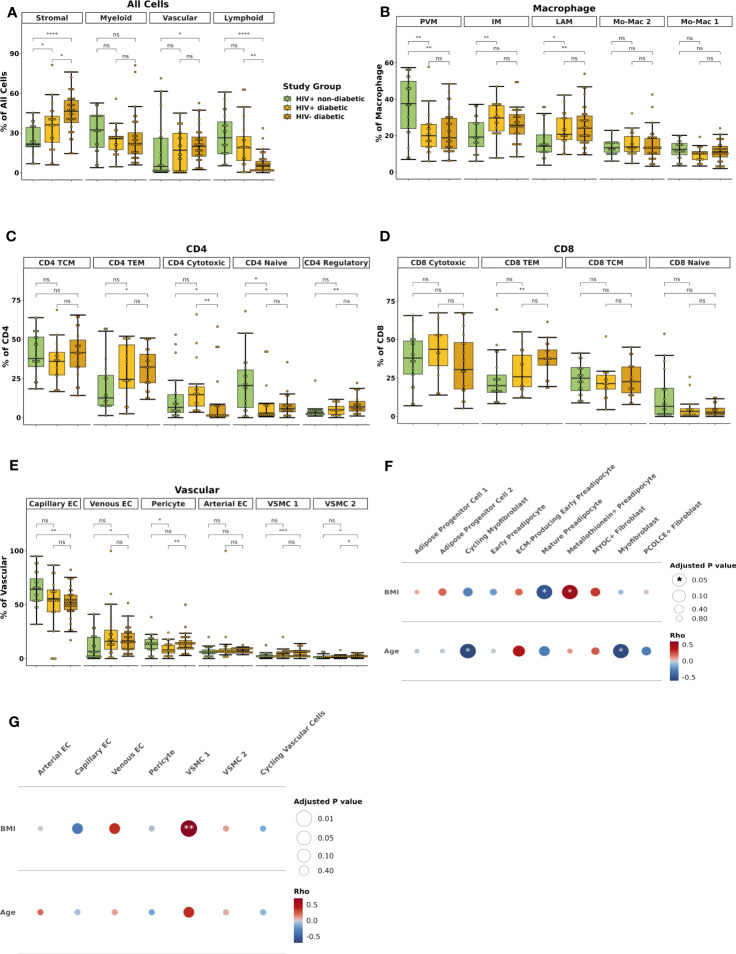
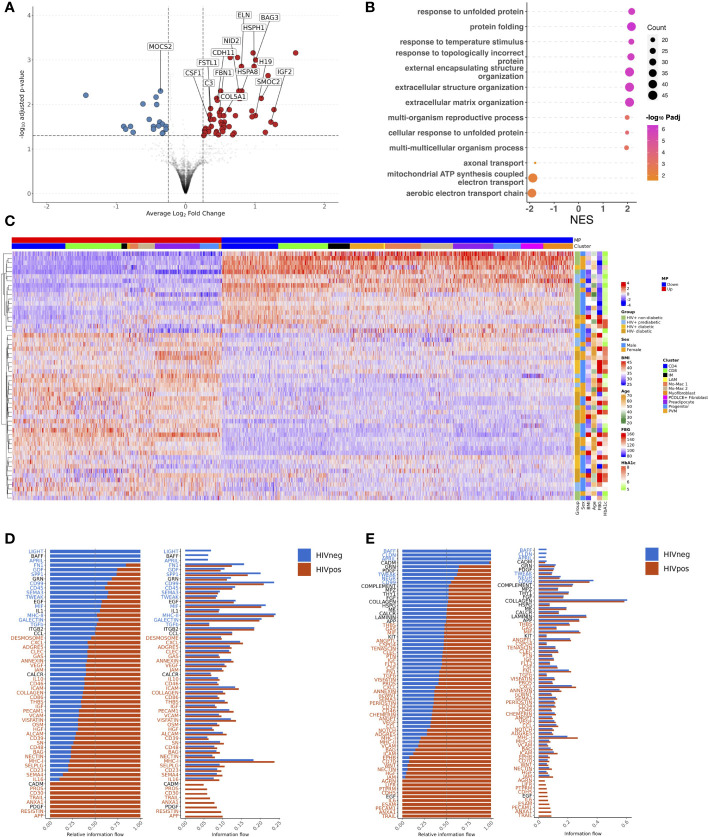
Results: Glucose intolerance was associated with increased lipid-associated macrophages, CD4+ and CD8+ T effector memory cells, and decreased perivascular macrophages. We observed a coordinated intercellular regulatory program which enriched for genes related to inflammation and lipid-processing across multiple cell types as glucose intolerance increased. Increased CD4+ effector memory tissue-resident cells most strongly associated with altered expression of adipocyte genes critical for lipid metabolism and cellular regulation. Intercellular communication analysis demonstrated enhanced pro-inflammatory and pro-fibrotic signaling between immune cells and stromal cells in PWH with glucose intolerance compared with non-diabetic PWH. Lastly, while cell type-specific gene expression among PWH with diabetes was globally similar to HIV-negative individuals with diabetes, we observed substantially divergent intercellular communication pathways.

Discussion: These findings suggest a central role of tissue-resident immune cells in regulating SAT inflammation among PWH with metabolic disease, and underscore unique mechanisms that may converge to promote metabolic disease.

Keywords: glucose intolerance; human immunodeficiency virus; immune cells; single-cell RNA sequencing; subcutaneous adipose tissue; type 2 diabetes mellitus; white adipose tissue.


Conflict of interest statement

JKr consults for Boehringer Ingelheim, Janssen, and Bristol-Myers Squibb, serves on the scientific advisory board for APIE Therapeutics, and provides non-financial study support to Genentech. JKo has served as a consultant to Gilead Sciences, Merck, ViiV Healthcare, Theratechnologies, and Janssen, and has received research support from Gilead Sciences and Merck. CeW has served as a consultant for ViiV and has received research support from Gilead Sciences. The remaining authors declare that the research was conducted in the absence of any commercial or financial relationships that could be constructed as a potential conflict of interest.

Figures

Figure 1
Figure 1
Single-cell RNA sequencing reveals complex cellular composition of subcutaneous white adipose tissue. (A) Schematic overview of study design. Twenty HIV+ non-diabetic, 19 HIV+ prediabetic, and 20 HIV+ diabetic participants underwent abdominal subcutaneous adipose tissue harvesting with liposuction. Tissue was processed with collagenase and dissociated. Single-cell suspensions from each participant were hashed and labeled with CITE-seq antibodies before multiplexing in groups of four. 10x libraries were generated using the Chromium platform and sequenced on the Illumina NovaSeq 6000. The bioinformatic pipeline included demultiplexing, quality control, dimensional reduction and clustering, and transcriptional analysis. (B) Uniform Manifold Approximation and Projection (UMAP) of 162,552 cells from 59 individuals after removal of doublets and quality control, with manual annotation of cell clusters based on canonical gene markers. (C) UMAP after harmony integration grouped by disease status showing successful integration; HIV+ non-diabetic (green), HIV+ prediabetic (blue), and HIV+ diabetic (yellow). (D) Gene expression projected onto the UMAP identifying major cell types including stromal (COL1A2, CCDC80), vascular (CLDN5, ACTA2), myeloid (CD68, CD1C), and T cell and natural killer cells (CD3E, NKG7). (E) Boxplot showing the proportion of major cell categories (stromal, vascular, lymphoid, and myeloid) as a percentage of total cells split by disease status (n = 59) (HIV+ non-diabetic, green; HIV+ prediabetic, blue; HIV+ diabetic, yellow). The horizontal black line represents the median, the box shows the lower and upper quartile limits and the whiskers are 1.5x the interquartile range. * p < 0.05, ** p < 0.01; ns, not significant.
Figure 2
Figure 2
Analysis of subsets shows delineation of cell types that are important for adipose tissue function. (A) Uniform Manifold Approximation and Projection (UMAP) of myeloid cells (n = 39,990 cells) from 59 individuals after subsetting and reclustering showing 14 distinct cell types/states. (B) Dot plot showing selected myeloid gene markers on the x-axis and cell type on the y-axis. The dot size reflects the percentage of cells expressing the gene while the color reflects the scaled average expression. (C) UMAP of T cells, natural killer cells, and innate lymphoid cells (n = 28,061 cells) from 59 individuals after subsetting and reclustering showing 16 distinct cell types/states. (D) Dot plot showing selected lymphoid gene markers on the x-axis and cell type on the y-axis. The dot size reflects the percentage of cells expressing the gene while the color reflects the scaled average expression. (E) UMAP of stromal cells (n = 50,492 cells) from 59 individuals after subsetting and reclustering. (F) Dot plot showing selected stromal gene markers on the x-axis and cell type on the y-axis. The dot size reflects the percentage of cells expressing the gene while the color reflects the scaled average expression. (G) UMAP of vascular cells (n = 41,958 cells) from 59 individuals after subsetting and reclustering. (H) Dot plot showing selected vascular gene markers on the x-axis and cell type on the y-axis. The dot size reflects the percentage of cells expressing the gene while the color reflects the scaled average expression. cMo, classical monocyte; cDC1, conventional dendritic cell type 1; cDC2B, conventional dendritic cell type 2B; DC, dendritic cell; EC, endothelial cell; ECM, extracellular matrix; FIB, fibroblast; ILC, innate lymphoid cell; IM, intermediate macrophage; ISG+, interferon-stimulated gene +; LAM, lipid-associated macrophage; Mac, macrophage; mNK, mature natural killer; Mo, monocyte; MT, metallothionein+; myoFIB, myofibroblast; NK, natural killer; nMo, non-classical monocyte; pDC, plasmacytoid dendritic cell; PreAd, preadipocyte; PVM, perivascular macrophage; TCM, T central memory; TEM, T effector memory; VSMC, vascular smooth muscle.
Figure 3
Figure 3
Lipid-associated, intermediate macrophages, and CD4+ and CD8+ T effector memory proportions are associated with glucose intolerance. (A) Boxplot showing the proportion of macrophage types split by disease state (HIV+ non-diabetic, green; HIV+ prediabetic, blue; HIV+ diabetic, yellow) (n = 54). The horizontal black line represents the median, the box shows the lower and upper quartile limits and the whiskers are 1.5x the interquartile range. * p < 0.05, ** p < 0.01; ns, not significant. (B) Partial spearman’s correlations between macrophage cell proportions (x-axis) and fasting blood glucose (FBG) or hemoglobin A1c (HbA1c) (y-axis). The area of the circle represents the adjusted p value (larger area = more significant adjusted p-value). Spearman’s ρ is colored red (positive) or blue (negative). (C) Partial spearman’s correlations between myeloid cell proportions (x-axis) and FBG or HbA1c (y-axis). (D) Boxplot showing the proportion of CD8+ T cell subsets as a proportion of total CD8+ T cells split by disease state (n = 47). (E) Partial spearman’s correlations between CD8+ T cell proportions (x-axis) and FBG or HbA1c (y-axis). (F) Boxplot showing the proportion of CD4+ T cell subsets as a proportion of total CD4+ T cells split by disease state (n = 44). (G) Partial spearman’s correlations between CD4+ T cell proportions (x-axis) and FBG or HbA1c (y-axis). cDC1, conventional dendritic cell type 1; cDC2B, conventional dendritic cell type 2B, cMo, classical monocyte; IM, intermediate macrophage; ISG+ Mo, ISG+ monocyte; LAM, lipid-associated macrophage; Migratory DC, migratory dendritic cell; Mo-Mac, monocyte-macrophage; nMo, non-classical monocyte; Other Mo, other monocyte; pDC, plasmacytoid dendritic cell; PVM, perivascular macrophage; TCM, T central memory; TEM, T effector memory.
Figure 4
Figure 4
Body mass index and sex are associated with compositional changes in immune and stromal cells. (A–C) Partial spearman’s correlations. Spearman’s ρ for the biological factor (body mass index [BMI] or age) and each cluster proportion was calculated. The area of the circle represents the adjusted p value (larger area = more significant adjusted p-value). Spearman’s ρ is colored red (positive) or blue (negative) for (A) macrophage, (B) CD4+ T cells, and (C) CD8+ T cells. (D–G) Ordinal linear regression with cluster proportion as the outcome and sex as the independent variable adjusted for age, BMI, and diabetes status. The regression coefficient for sex was converted into an odds ratio (female:male) and plotted with odds ratio (square) and 95% confidence interval (lines) on the x-axis and cell type on they y-axis for (D) macrophage (E) CD4+ T cells (F) CD8+ T cells, and (G) stromal cells. BMI, body mass index; ECM, extracellular matrix; IM, intermediate macrophage; LAM, lipid-associated macrophage; Mac, macrophage; Mo, monocyte; PVM, perivascular macrophage; TCM, T central memory; TEM, T effector memory.
Figure 5
Figure 5
Intercellular correlation of proportions with cells associated with glucose intolerance. (A–D) Partial spearman’s correlations. Spearman’s ρ was calculated between the cells of interest (proportion) and each cluster proportion. The area of the circle represents the adjusted p value (larger area = more significant adjusted p-value). Spearman’s ρ is colored red (positive) or blue (negative) for (A) CD4+ and CD8+ T effector memory (TEM) proportion and myeloid cell proportions, (B) all T cell proportions and myeloid cell proportions, (C) CD4+ and CD8+ T effector memory (TEM) proportions and stromal cell proportions, (D) and macrophage proportions and stromal cell proportions. (E) Scatter plot with intermediate macrophages as a percent of macrophages on the x-axis and myofibroblasts as a percent of stromal cells on the y-axis. cDC1, conventional dendritic cell type 1; cDC2B, conventional dendritic cell type 2B; cMo, classical monocyte; DC, dendritic cell; ECM, extracellular matrix; IM, intermediate macrophage; LAM, lipid-associated macrophage; Mo, monocyte; Mo-Mac, monocyte-macrophage; PVM, perivascular macrophage; pDC, plasmacytoid dendritic cell; TCM, T central memory; TEM, T effector memory.
Figure 6
Figure 6
Transcriptional shift from immunoregulatory to metabolic phenotype in macrophages and effector memory phenotype in T cells with glucose intolerance. (A) Macrophage volcano plot with average Log2 fold change (x-axis) and –log10 adjusted p-value (y-axis) for prediabetic vs non-diabetic (reference) PWH. Genes that had ≥ 0.25 log2 fold change and adjusted p-value < 0.05 were colored red (higher expression) and blue (lower expression). (B) Gene set enrichment analysis (GSEA) using the KEGG database. The top over and under enriched pathways were included with normalized enrichment score (NES) on x-axis and descriptive term on y-axis. Dot size represents the number of gene hits in the pathway and dot color represents the –log10 adjusted p-value. (C) Ordered and smoothed transcription factor gene expression (scaled) along the pseudotime trajectory for monocyte-macrophage 2 to perivascular macrophage. Selected genes were significantly differentially expressed along the pseudotime with ≥ log2(2) fold change according to TradeSeq. (D) Ordered and smoothed transcription factor gene expression (scaled) along the pseudotime trajectory for monocyte-macrophage 2 to lipid associated macrophages. Selected genes were significantly differentially expressed along the pseudotime with ≥ log2(2) fold change according to TradeSeq. (E) CD4+ T cell volcano plot with average Log2 fold change (x-axis) and –log10 adjusted p-value (y-axis) for prediabetic vs non-diabetic (reference) PWH. Genes that had ≥ 0.25 log2 fold change and adjusted p-value < 0.05 were colored red (higher expression) and blue (lower expression). (F) CD8+ T cell volcano plot with average Log2 fold change (x-axis) and –log10 adjusted p-value (y-axis) for prediabetic vs non-diabetic (reference) PWH. Genes that had ≥ 0.25 log2 fold change and adjusted p-value < 0.05 were colored red (higher expression) and blue (lower expression). LAM, lipid-associated macrophage; Mo-Mac, monocyte-macrophage; PVM, perivascular macrophage; NES, normalized enrichment score.
Figure 7
Figure 7
An intercellular gene expression program enriched for interferon-γ, tumor necrosis factor, and lipid metabolism defines glucose intolerance. (A) Distribution of expression scores for each cell type component for multicellular program (MP) 1 with kernel density estimates. (B) Over-representation analysis using Gene Ontology biological process for genes in the up and down compartments in MP1. Dot size represents the number of gene hits in the pathway and dot color represents the –log10 adjusted p-value. (C) Average scaled expression of top CD4+ T cell genes from MP1 sorted by expression (columns), across samples plotted with hierarchical clustering (rows) and labeled with clinical variables including body mass index (BMI), age, sex, and measures of glucose intolerance. (D) Average scaled expression of top CD8+ T cell genes from MP1 sorted by expression (columns), across samples plotted with hierarchical clustering (rows) and labeled with clinical variables including BMI, age, sex, and measures of glucose intolerance. BMI, body mass index; FBG, fasting blood glucose; HbA1c, hemoglobin A1c; IM, intermediate macrophage; LAM, lipid-associated macrophage; Mo-Mac, monocyte-macrophage; MP, multicellular program; MyoFIB, myofibroblast; PVM, perivascular macrophage.
Figure 8
Figure 8
Intercellular communication analysis predicts enhanced signaling of pro-fibrotic, pro-inflammatory pathways in PWH with glucose intolerance (GI). (A) Relative number of interactions (left) and strength of interactions (right) comparing PWH with glucose intolerance and non-diabetic (nonDM) PWH. Increased and decreased relative signaling are shown in red and blue, respectively. The target cells are shown on the x-axis and the source cells are shown on the y-axis. Rows and columns were plotted with hierarchical clustering. (B–G) Bar plot with relative information flow (left) or overall information flow (right) on the x-axis and predicted ligand-ligand receptor pathways from source cells to target cells. Signaling with glucose intolerance is shown in orange while signaling in non-diabetics is shown in blue. Pathways with significantly greater interaction with glucose intolerance based on Wilcoxon rank sum are labeled in orange while pathways with significantly greater interaction in non-diabetic are labeled in blue (p < 0.05). (B) Intermediate macrophage (source) to myofibroblast and cycling myofibroblast (target). (C) Intermediate macrophage (source) to preadipocyte and progenitor cells (target) (D) Cycling myofibroblast and myofibroblast (source) to intermediate macrophage (target). (E) Preadipocyte and progenitor cells (source) to intermediate macrophages (target). (F) CD4+ TEM (source) to myofibroblast and cycling myofibroblast (target). (G) CD4+ TEM (source) to preadipocyte and progenitor cells (target). cMo, classical monocyte; cDC1, conventional dendritic cell type 1; cDC2B, conventional dendritic cell type 2B; DC, dendritic cell; EC, endothelial cell; FIB, fibroblast; ILC, innate lymphoid cell; IM, intermediate macrophage; ISG+, interferon-stimulated gene +; LAM, lipid-associated macrophage; Mac, macrophage; mNK, mature natural killer; Mo, monocyte; MT, metallothionein+; myoFIB, myofibroblast; NK, natural killer; nMo, non-classical monocyte; pDC, plasmacytoid dendritic cell; PreAd, preadipocyte; Prog, progenitor; PVM, perivascular macrophage.
Figure 9
Figure 9
HIV-negative diabetic and HIV-positive diabetic have similar macrophage and T effector memory cell polarization. (A) Box plot showing the proportion of major cell categories (stromal, vascular, lymphoid, and myeloid) as a percentage of total cells split by disease state (HIV+ non-diabetic, green; HIV+ diabetic, yellow; HIV- diabetic, orange) (n = 72). The horizontal black line represents the median, the box shows the lower and upper quartile limits and the whiskers are 1.5x the interquartile range. * p < 0.05, ** p < 0.01, *** p < 0.001, **** p < 0.0001; ns, not significant. (B) Boxplot showing the proportion of macrophage subsets as a percentage of total macrophage cells split by disease status (n = 70). (C) Boxplot showing the proportion of CD4+ T cell subsets as a percentage of total CD4+ T cells split by disease status (n = 52). (D) Boxplot showing the proportion of CD8+ T cell subsets as a percentage of total CD8+ T cells split by disease status (n = 51). (E) Boxplot showing the proportion of vascular subsets as a percentage of total vascular cells split by disease status (n = 71). (F, G) Partial spearman’s correlations in HIV-negative diabetic individuals only. Spearman’s ρ for the biological factor (body mass index [BMI] or age) and each cluster proportion was calculated. The area of the circle represents the adjusted p value (larger area = more significant adjusted p-value). Spearman’s ρ is colored red (positive) or blue (negative) for (F) stromal and (G) vascular cells. BMI, body mass index; EC, endothelial cell; ECM, extracellular matrix; IM, intermediate macrophage; Mo-Mac, monocyte-macrophage; LAM, lipid-associated macrophage; PVM, perivascular macrophage, TCM, T central memory; TEM, T effector memory; VSMC, vascular smooth muscle cell.
Figure 10
Figure 10
HIV-negative diabetic and HIV-positive diabetic have a similar multicellular gene expression program but divergent intercellular communication pathways. (A) Preadipocyte volcano plot with average Log2 fold change (x-axis) and –log10 adjusted p-value (y-axis) for HIV-positive diabetic vs HIV- diabetic (reference) persons. Genes that had ≥ 0.25 log2 fold change and adjusted p-value < 0.05 were colored red (higher expression) and blue (lower expression). (B) Gene set enrichment analysis (GSEA) using the Gene Ontology database. The top over and under enriched pathways were included with normalized enrichment score (NES) on x-axis and descriptive term on y-axis. Dot size represents the number of gene hits in the pathway and dot color represents the –log10 adjusted p-value. (C) Average scaled expression of top genes from all cells in Multicellular Program (MP) 1 sorted by expression (columns), across samples plotted with hierarchical clustering (rows) and labeled with clinical variables including body mass index (BMI), age, sex, and measures of glucose intolerance. (D, E) Bar plot with relative information flow (left) or overall information flow (right) on the x-axis and predicted ligand-ligand receptor pathways from source cells to target cells. Signaling in HIV+ diabetic is shown in orange while signaling in HIV- diabetic is shown in blue. Pathways with significantly greater interaction in HIV+ diabetics based on Wilcoxon rank sum are labeled in orange while pathways with significantly greater interaction in HIV- diabetics are labeled in blue (p < 0.05). (D) Macrophages (source) to all cells (target). (E) Stromal (source) to all cells (target). BMI, body mass index; FBG, fasting blood glucose; HbA1c, hemoglobin A1c; IM, intermediate macrophage; LAM, lipid-associated macrophage; NES, normalized enrichment score; PVM, perivascular macrophage.

Similar articles

Cited by

References

    1. Jaacks LM, Vandevijvere S, Pan A, McGowan CJ, Wallace C, Imamura F, et al. . The obesity transition: stages of the global epidemic. Lancet Diabetes Endocrinol (2019) 7(3):231–40. doi: 10.1016/S2213-8587(19)30026-9 - DOI - PMC - PubMed
    1. Saeedi P, Petersohn I, Salpea P, Malanda B, Karuranga S, Unwin N, et al. . Global and regional diabetes prevalence estimates for 2019 and projections for 2030 and 2045: Results from the International Diabetes Federation Diabetes Atlas, 9(th) edition. Diabetes Res Clin Pract (2019) 157:107843. doi: 10.1016/j.diabres.2019.107843 - DOI - PubMed
    1. Nansseu JR, Bigna JJ, Kaze AD, Noubiap JJ. Incidence and risk factors for prediabetes and diabetes mellitus among HIV-infected adults on antiretroviral therapy: A systematic review and meta-analysis. Epidemiology (2018) 29(3):431–41. doi: 10.1097/EDE.0000000000000815 - DOI - PubMed
    1. Shah ASV, Stelzle D, Lee KK, Beck EJ, Alam S, Clifford S, et al. . Global burden of atherosclerotic cardiovascular disease in people living with HIV: systematic review and meta-analysis. Circulation (2018) 138(11):1100–12. doi: 10.1161/CIRCULATIONAHA.117.033369 - DOI - PMC - PubMed
    1. Putcharoen O, Wattanachanya L, Sophonphan J, Siwamogsatham S, Sapsirisavat V, Gatechompol S, et al. . New-onset diabetes in HIV-treated adults: predictors, long-term renal and cardiovascular outcomes. AIDS (2017) 31(11):1535–43. doi: 10.1097/QAD.0000000000001496 - DOI - PubMed

Publication types