. 2023 Aug 29:14:1248658.
doi: 10.3389/fimmu.2023.1248658. eCollection 2023.

Cellular immunity to SARS-CoV-2 following intrafamilial exposure in seronegative family members

Affiliations

Cellular immunity to SARS-CoV-2 following intrafamilial exposure in seronegative family members

Cecilia Jay et al. Front Immunol. .

Abstract

Introduction: Family studies of antiviral immunity provide an opportunity to assess virus-specific immunity in infected and highly exposed individuals, as well as to examine the dynamics of viral infection within families. Transmission of SARS-CoV-2 between family members represented a major route for viral spread during the early stages of the pandemic, due to the nature of SARS-CoV-2 transmission through close contacts.

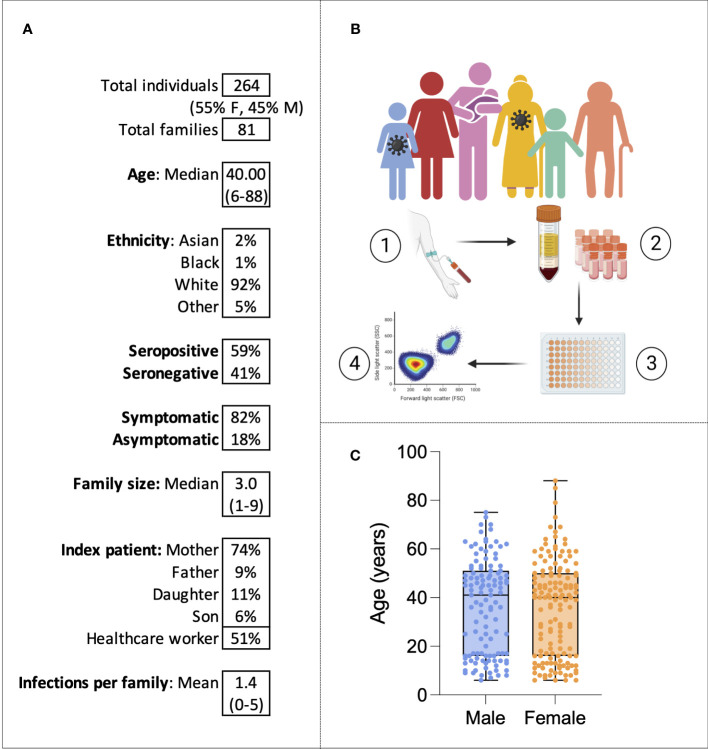
Methods: Here, humoral and cellular immunity is explored in 264 SARS-CoV-2 infected, exposed or unexposed individuals from 81 families in the United Kingdom sampled in the winter of 2020 before widespread vaccination and infection.

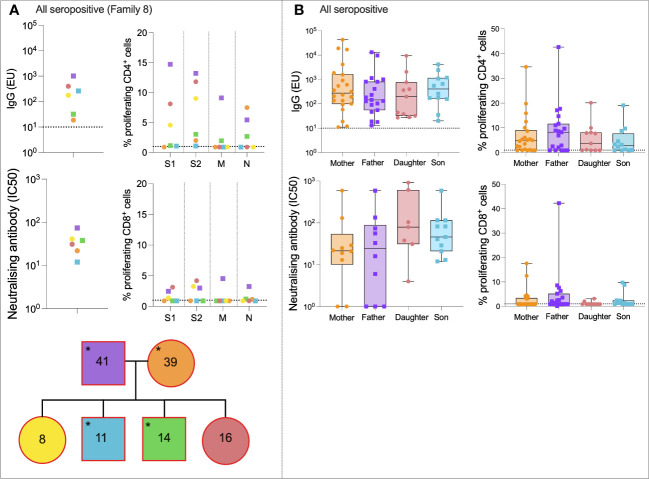
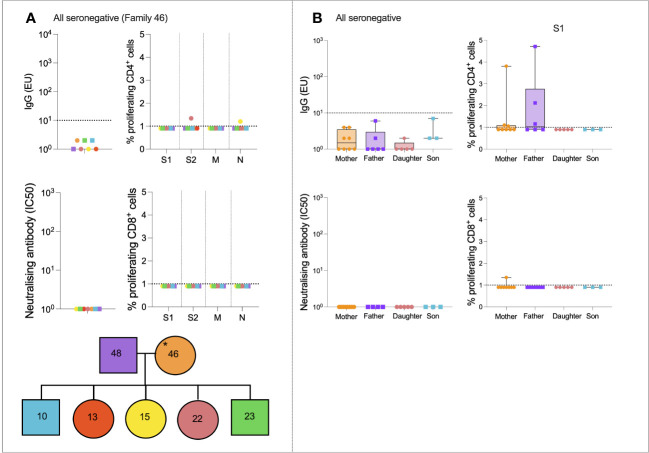
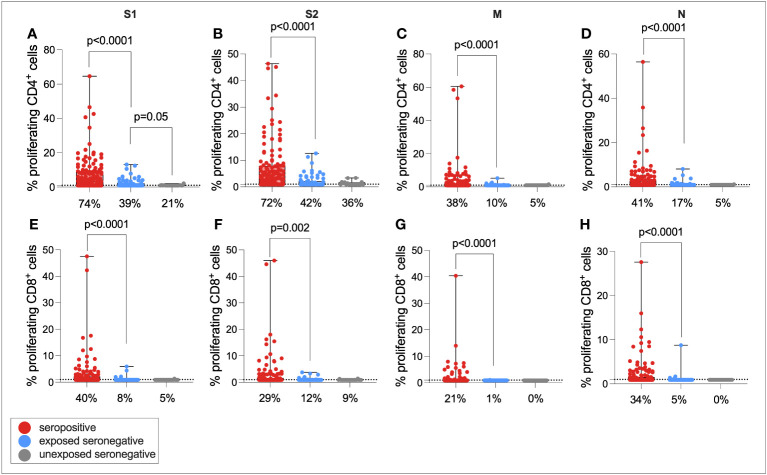
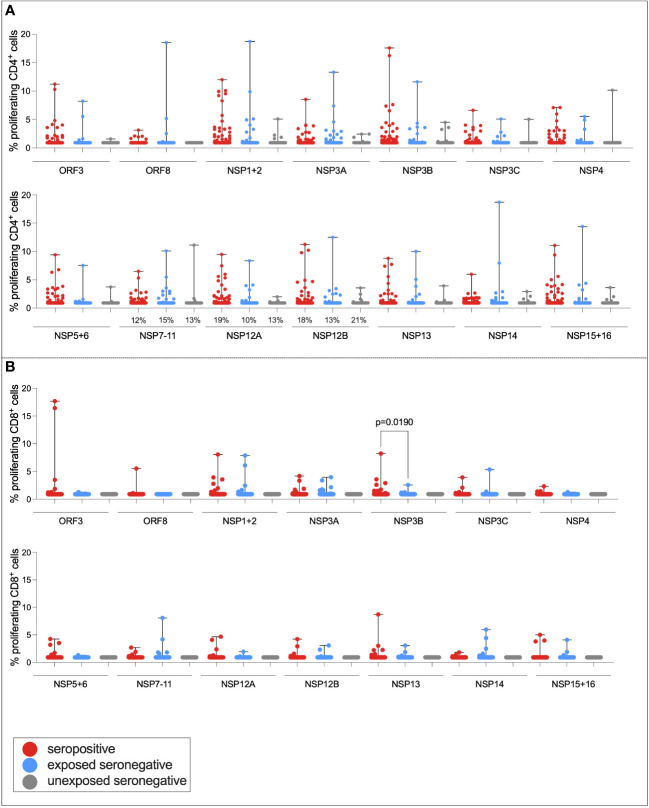
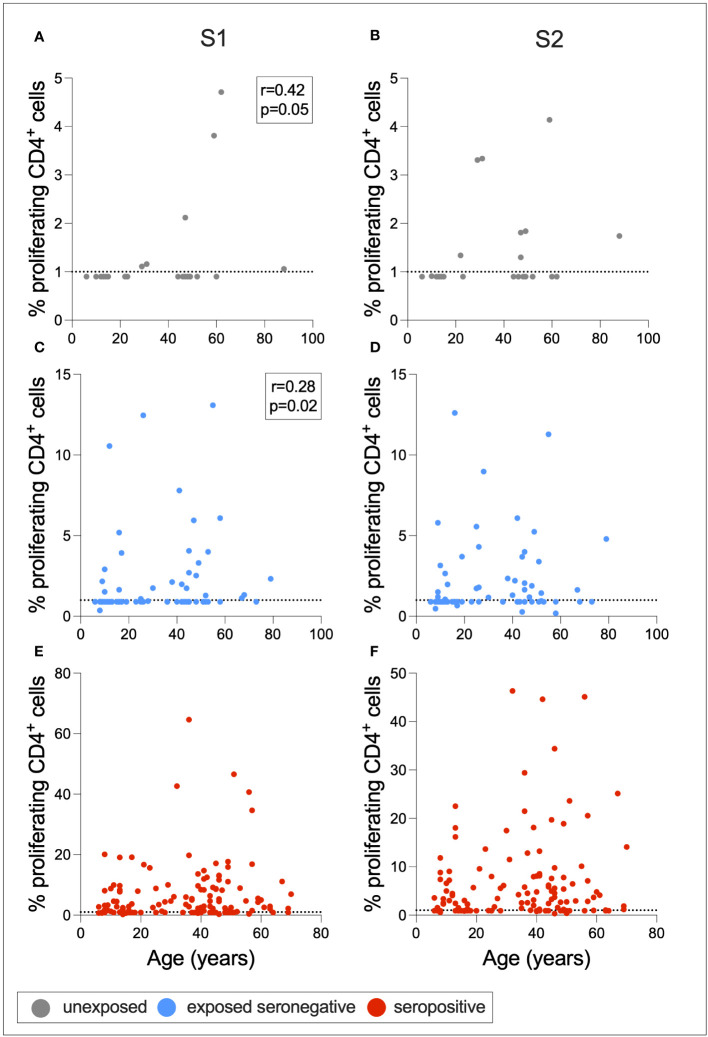
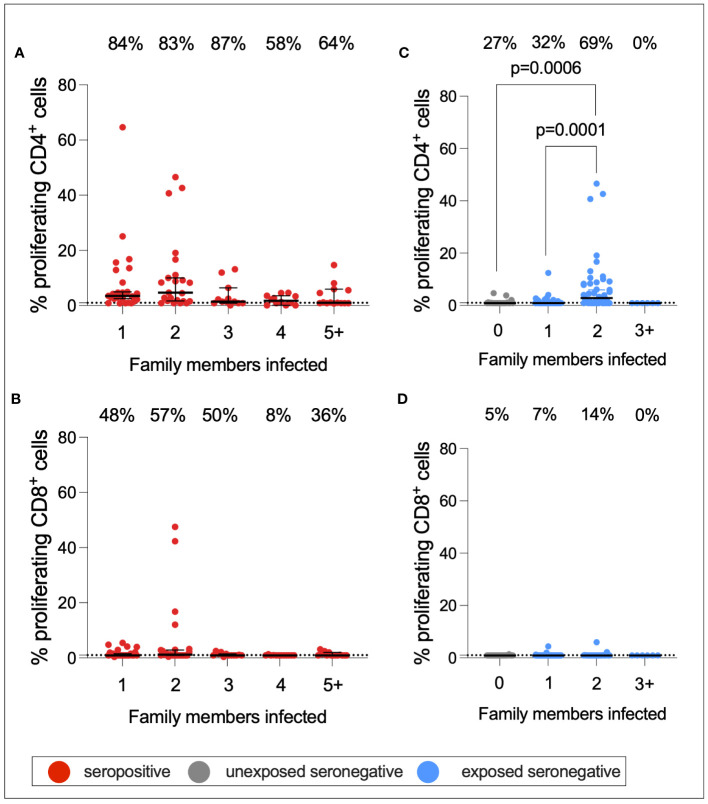
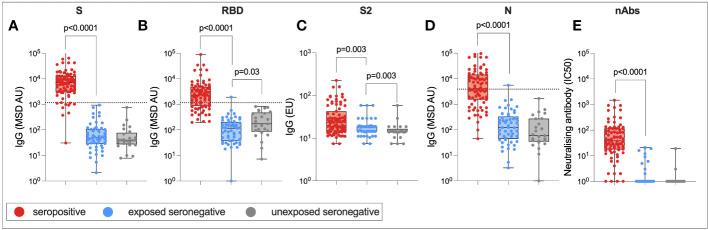
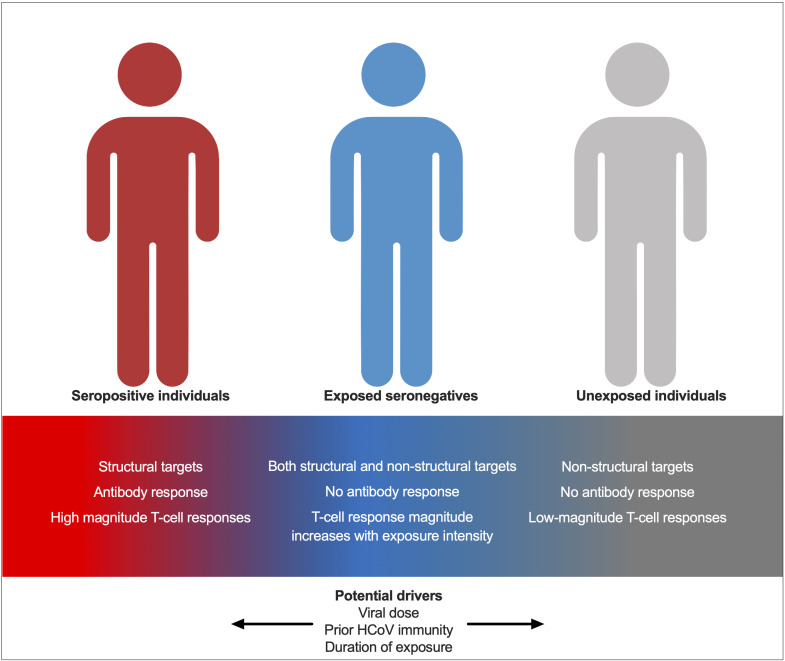
Results: We describe robust cellular and humoral immunity into COVID-19 convalescence, albeit with marked heterogeneity between families and between individuals. T-cell response magnitude is associated with male sex and older age by multiple linear regression. SARS-CoV-2-specific T-cell responses in seronegative individuals are widespread, particularly in adults and in individuals exposed to SARS-CoV-2 through an infected family member. The magnitude of this response is associated with the number of seropositive family members, with a greater number of seropositive individuals within a family leading to stronger T-cell immunity in seronegative individuals.

Discussion: These results support a model whereby exposure to SARS-CoV-2 promotes T-cell immunity in the absence of an antibody response. The source of these seronegative T-cell responses to SARS-CoV-2 has been suggested as cross-reactive immunity to endemic coronaviruses that is expanded upon SARS-CoV-2 exposure. However, in this study, no association between HCoV-specific immunity and seronegative T-cell immunity to SARS-CoV-2 is identified, suggesting that de novo T-cell immunity may be generated in seronegative SARS-CoV-2 exposed individuals.

Keywords: COVID-19; SARS-CoV-2; T-cells; exposed seronegative; family.


Conflict of interest statement

The authors declare that the research was conducted in the absence of any commercial or financial relationships that could be construed as a potential conflict of interest.

Figures

Figure 1
Figure 1
The family cohort. Characteristics of the cohort (A). Graphical representation of the study: sampling of infected individuals and their family members, PBMC and serum isolation, assays, and analysis (B). Age distribution of the cohort by sex (C). Virus symbols indicate exemplar seropositive individuals.
Figure 2
Figure 2
All seropositive families. Anti-S IgG, nAb responses, CD4+ T-cell responses, and CD8+ responses in a seropositive family group consisting of mother, father, two sons, and two daughters (A). IgG, nAb, and T-cell responses in all individuals from the “All seropositive” family type (B). Male patients are squares; female patients are circles. Seropositive individuals are outlined in red. Asterisks refer to symptomatic individuals. Proliferation values below 1% were given nominal values of 0.9%. Dotted lines refer to cutoffs as determined previously (11, 12).
Figure 3
Figure 3
All seronegative families. Anti-S IgG, nAb responses, CD4+ T-cell responses, and CD8+ responses in a seronegative family group consisting of mother, father, two sons, and three daughters (A). IgG, nAb, and T-cell responses in all individuals from the “All seronegative” family type (B). Male patients are squares; female patients are circles. Asterisks refer to symptomatic individuals. Proliferation values below 1% were given nominal values of 0.9%. Dotted lines refer to cutoffs as determined previously (11, 12).
Figure 4
Figure 4
Cellular immunity in seropositive, ESN, and USN individuals. CD4+ T-cell responses to SARS-CoV-2 S1 (A), S2 (B), M (C), and N (D) as measured by proliferation assay in seropositive individuals (red), ESNs (blue), and USNs (gray). CD8+ T-cell responses to S1 (E), S2 (F), M (G), and N (H) as measured by proliferation assay. p-values refer to Mann–Whitney test values. Data points below 1% were given nominal values of 0.9%. Dotted lines refer to cutoffs as determined previously (11). Percentages refer to the number of individuals with responses above 1% proliferation.
Figure 5
Figure 5
T-cell responses to NSPs in ESN individuals. CD4+ T-cell responses targeting SARS-CoV-2 NSPs in seropositive (red), ESN (blue), and USN (gray) individuals (A). CD8+ T-cell responses targeting SARS-CoV-2 NSPs in seropositive, ESN and USN individuals (B). Percentages refer to the number of individuals with responses above 1% proliferation, specifically for the RTC region of the genome. p-values refer to Kruskal–Wallis test values with Dunn’s multiple comparisons. Data points below 1% were given nominal values of 0.9%.
Figure 6
Figure 6
Associations between age and T-cell response. Correlations between age and S1- or S2-specific CD4+ T-cell response in USNs (A, B gray), ESNs (C, D blue), and seropositive individuals (E, F red). R- and p-values refer to Spearman rank test values. Data points below 1% were given nominal values of 0.9%. Dotted lines refer to cutoffs as determined previously (11).
Figure 7
Figure 7
S1-specific T-cell responses by number of family members infected. CD4+ (A) and CD8+ (B) T-cell responses in seropositive (red) individuals with 1–5+ family members infected. CD4+ (C) and CD8+ (D) T-cell responses in USN (gray) and ESN (blue) individuals with 0–5+ family members infected. p-values refer to Mann–Whitney test values. Values below 1% were given nominal values of 0.9%. Dotted lines refer to cutoffs as determined previously (11). Percentages refer to the number of individuals with responses above 1% proliferation.
Figure 8
Figure 8
Humoral immune responses in ESNs. IgG targeting S (A), RBD (B), S2 (C), and N (D), and nAb titers (E) in seropositive (red), ESN (blue), and USN (gray) individuals. p-values refer to Mann–Whitney test values. Dotted lines represent seropositivity cutoffs as previously determined (12).
Figure 9
Figure 9
A model for immunity in seropositive individuals, ESNs, and USNs. Individuals represent points along a spectrum from USN to seropositive, modulated by viral dose, prior immunity to endemic HCoVs, and duration of exposure.

References

    1. Pan X, Chen D, Xia Y, Wu X, Li T, Ou X, et al. . Asymptomatic cases in a family cluster with SARS-CoV-2 infection. Lancet Infect Diseases (2020) 20(4):410–1. doi: 10.1016/S1473-3099(20)30114-6 - DOI - PMC - PubMed
    1. Ghinai I, Woods S, Ritger KA, McPherson TD, Black SR, Sparrow L, et al. . Community transmission of SARS-CoV-2 at two family gatherings — Chicago, illinois, February–March 2020. MMWR Morb Mortal Wkly Rep (2020) 69(15):446–50. doi: 10.15585/mmwr.mm6915e1 - DOI - PMC - PubMed
    1. Jiang XL, Zhang XL, Zhao XN, Li CB, Lei J, Kou ZQ, et al. . Transmission potential of asymptomatic and paucisymptomatic severe acute respiratory syndrome coronavirus 2 infections: A 3-family cluster study in China. J Infect Diseases (2020) 221(12):1948–52. doi: 10.1093/infdis/jiaa206 - DOI - PMC - PubMed
    1. Witkowski JM, Fulop T, Bryl E. Immunosenescence and COVID-19. Mech Ageing Dev (2022) 204:111672. doi: 10.1016/j.mad.2022.111672 - DOI - PMC - PubMed
    1. Zimmermann P, Curtis N. Why is COVID-19 less severe in children? A review of the proposed mechanisms underlying the age-related difference in severity of SARS-CoV-2 infections. Arch Dis Child (2021) 106(5):429–39. doi: 10.1136/archdischild-2020-320338 - DOI - PubMed

Publication types