. 2023 Aug 23;14(35):9560-9573.
doi: 10.1039/d3sc01244a. eCollection 2023 Sep 13.

Single-nucleobase resolution of a surface energy transfer nanoruler for in situ measurement of aptamer binding at the receptor subunit level in living cells

Affiliations

Single-nucleobase resolution of a surface energy transfer nanoruler for in situ measurement of aptamer binding at the receptor subunit level in living cells

Yu Zhang et al. Chem Sci. .

Abstract

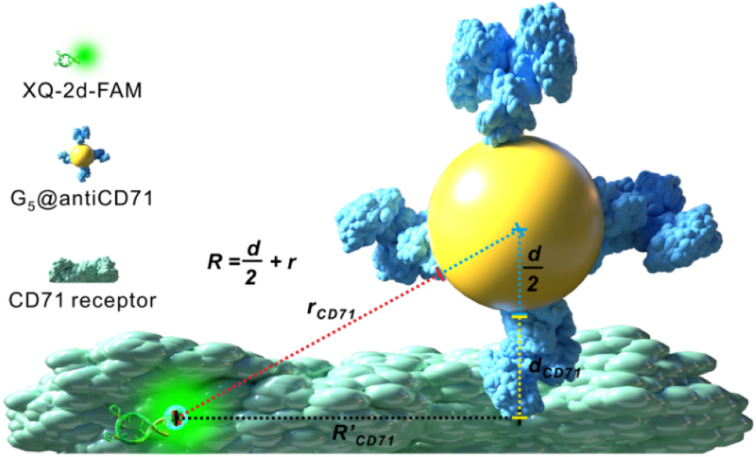
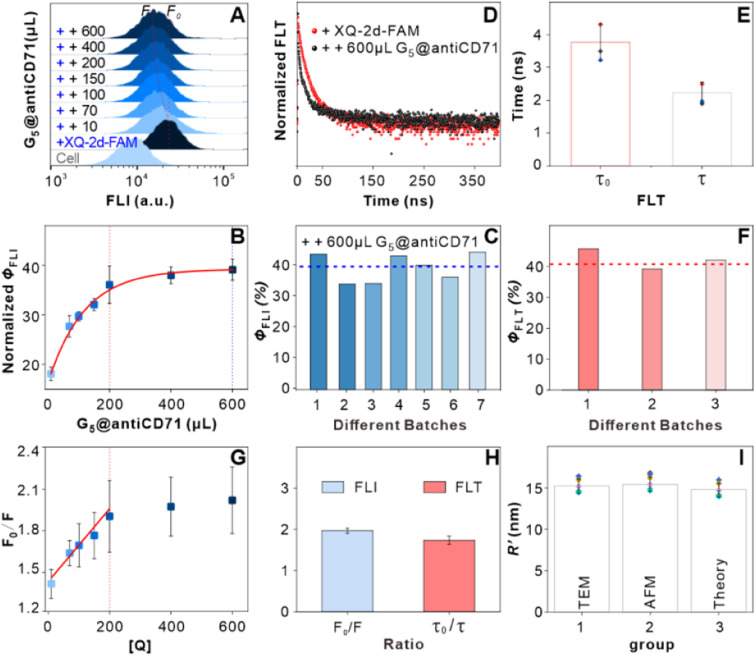
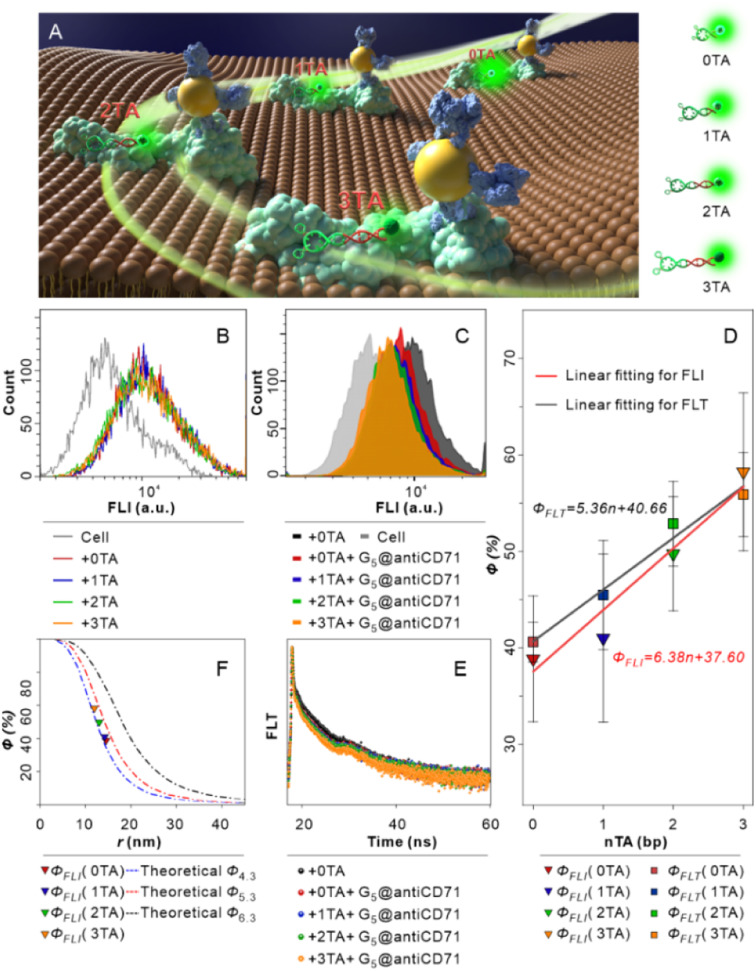
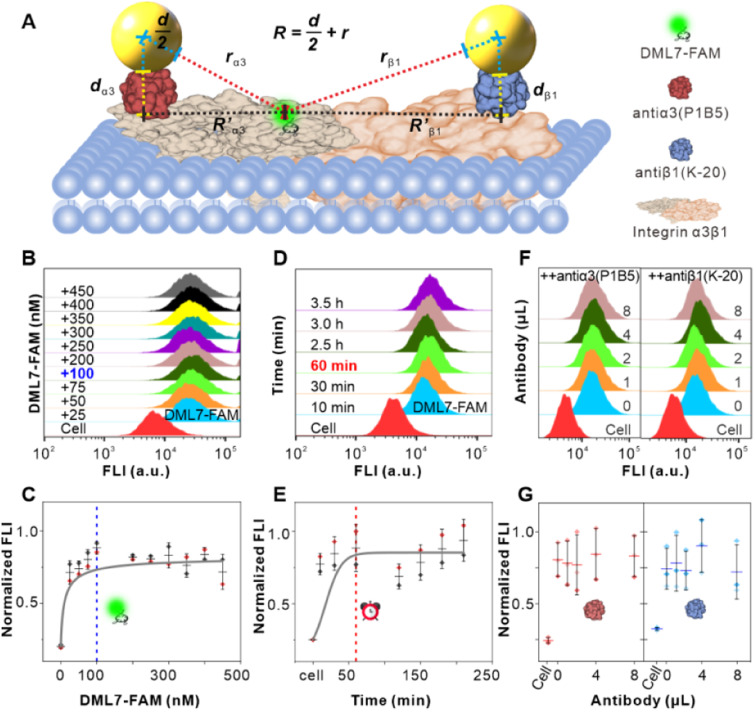
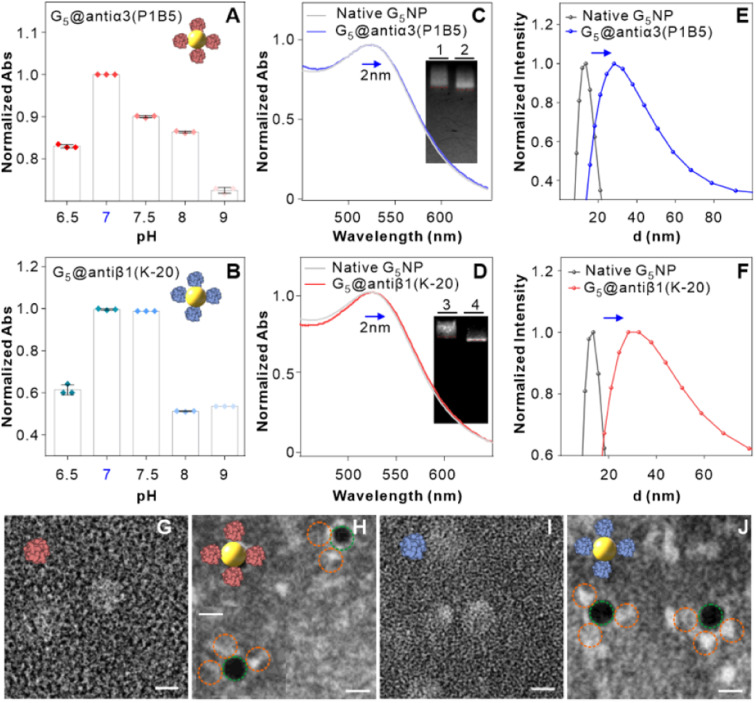
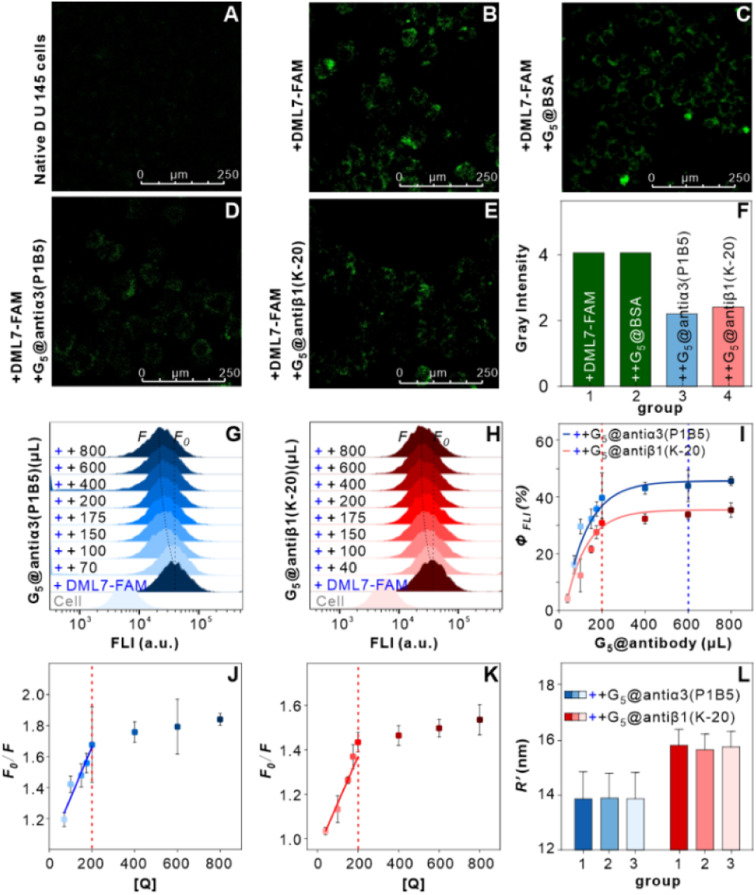
In situ identification of aptamer-binding targets on living cell membrane surfaces is of considerable interest, but a major challenge, specifically, when advancing recognition to the level of membrane receptor subunits. Here we propose a novel nanometal surface energy transfer (NSET) based nanoruler with a single-nucleobase resolution (SN-nanoruler), in which FAM-labeled aptamers and single-sized gold nanoparticle (GNP) antibody conjugates act as a donor and an acceptor. A single nucleobase resolution of the SN-nanoruler was experimentally illustrated by molecular size, orientation, quenching nature, and other dye-GNP pairs. The SN-nanoruler provides high reproducibility and precision for measuring molecule distance on living cell membranes at the nanometer level owing to only the use of single-sized antibody-capped GNPs. In situ identification of the aptamer binding site was advanced to the protein subunit level on the living cell membrane for the utilization of this SN-nanoruler. The results suggest that the proposed strategy is a solid step towards the wider application of optical-based rulers to observe the molecular structural configuration and dynamic transitions on the membrane surface of living cells.


Conflict of interest statement

The authors declare no competing interests.

Figures

Scheme 1
Scheme 1. SN-nanoruler working model for measuring distance on the CD71 receptor of PL45 cells. R represents the distance from FAM dye to the center of G5NPs, r represents the distance from FAM dye to the surface of G5NPs, and R′ represents the separation distance between the XQ-2d-FAM binding site and antiCD71 binding site. The d and dCD71 are the diameters of G5NPs and antiCD71 antibody, respectively.
Fig. 1
Fig. 1. Binding feature analysis of the ligands in living PL45 cells. (A and B) Saturated binding concentration analysis of the XQ-2d-FAM aptamer to the CD71 receptor on PL45 cells. The FCM charts indicated 0, 50, 100, 150, 200, 250, 300, 350, and 400 nM of XQ-2d-FAM from bottom to top in A, respectively. (C and D) Best co-incubation time of the XQ-2d-FAM aptamer with the CD71 receptor on PL45 cells. The FCM charts indicated native PL45 cells and cells with saturated XQ-2d-FAM for about 5, 20, 40, and 60 min and 2, 4, 7 and h from bottom to top in C, respectively. (E and F) Competitive binding analysis of saturated XQ-2d-FAM and different amounts of antiCD71, including 1, 2, 4, and 8 μL, respectively.
Fig. 2
Fig. 2. Preparation and characterization of a G5@antiCD71 conjugate. (A) Normalized absorbance of the G5@antiCD71 conjugate at varied pH values. (B) Normalized absorbance of the G5@antiCD71 conjugate for various volumes of antiCD71. (C) UV-VIS absorption spectra of native G5NPs (blue line) and G5@antiCD71 (red line), respectively. The inset indicates agarose gel electrophoresis assay of native G5NPs (channel 1) and G5@antiCD71 (channel 2). (D) The polydispersity index on hydration dynamics diameters of native G5NPs and G5@antiCD71 by DLS measurements, respectively. (E–G) TEM images of native G5NPs, native antiCD71, and G5@antiCD71, respectively. The green and yellow circles in G indicate G5NPs and antiCD71, respectively. The scale bar in (E–G) is 5 nm.
Fig. 3
Fig. 3. Feasibility verification of the SN-nanoruler by confocal imaging analysis of PL45 cells. (A) Native PL45 cells without the fluorescence background. (B) PL45 cells with the saturated XQ-2d-FAM aptamer. (C) The cell samples in (B) further treated by DAPI staining. (D) The merged image of (B) and (C). (E) PL45 cells treated with excess saturated G5@antiCD71, after incubation with saturated XQ-2d-FAM. (F) PL45 cells treated with excess saturated G5@BSA, after incubation with saturated XQ-2d-FAM, as a negative control. (G–I) Grey values of cell FLI in (B), (E), and (F) that were estimated using Image J software. (J). (J) Normalized grey values of (G–I) that were estimated using Image J software.
Fig. 4
Fig. 4. Feasibility verification of the SN-nanoruler by FLI and FLT related experiments. (A) FCM analysis on PL45 cell samples. FCM charts indicated native PL45 cells (cell), cells with saturated XQ-2d-FAM (+FAM), and cells with saturated XQ-2d-FAM and G5@antiCD71 of different amounts, i.e., 10, 70, 100, 150, 200, 400, and 600 μL from bottom to top, respectively (from “++ 10” to “++ 600”). (B) Fluorescence quenching efficiency as a function of the amounts of G5@antiCD71. (C) Seven repeats of the Φ test that were calculated by FLI experiments. (D) FLT of cells incubated with saturated XQ-2d-FAM (+FAM, red line) and then co-incubated with excess saturated G5@antiCD71 (++ G5@antiCD71, black line). (E) Mean FLT of cells with saturated XQ-2d-FAM treatments before (τ0) and after co-incubation with the saturated G5@antiCD71 quencher (τ), respectively. (F) Three repeats of the Φ test that were calculated by FLT experiments. (G) Linear relationship of F0/F and [Q] when added with different amounts of G5@antiCD71. (H) The ratio of F0/F calculated using FLI (blue) and τ0/τ calculated using FLT (red), respectively. (I) Analysis of distance between two binding sites in the presence of saturated XQ-2d-FAM and saturated G5@antiCD71 according to the estimated antibody sizes from TEM (group 1), AFM (group 2) and the theoretical calculation (group 3), respectively.
Fig. 5
Fig. 5. SN-nanoruler with a single-nucleobase resolution identified by FLI and FLT experiments. (A) Single-nucleobase resolution model by lengthening the “n TA” spacer, i.e., one TA base pair at a time, between the 5′ end of XQ-2d and FAM, where n is the number of TA base pairs. (B) FCM analysis of native PL45 cells (cell), cells incubated with saturated XQ-2d-FAM (0 TA), XQ-2d-1TA-FAM (1 TA), XQ-2d-2TA-FAM (2 TA), and XQ-2d-3TA-FAM (3 TA), respectively. (C) FCM analysis of cells, cells incubated with saturated 0 TA, and cells incubated with saturated n TA and then saturated G5@antiCD71, respectively. (D) Linear fitting relationship between the number of TA and ΦFLI (red line) and ΦFLT (black line), respectively, calculated according to the change in FAM FLI and FLT. (E) FLT analysis of cells incubated with saturated 0 TA and cells incubated with saturated n TA and then co-incubated with excess saturated G5@antiCD71, respectively. (F) Comparisons of our experimental data with the theoretical simulation curves. Theoretical curves show the r-dependent Φ of GNPs with diameters of 4.3 nm (blue line), 5.3 nm (red line), and 6.6 nm (black line), respectively, adopted from the literature. The color triangles indicate experimental Φ values calculated from FLI.
Fig. 6
Fig. 6. Binding feature analysis of DML7-FAM and two antibodies on the integrin α3β1 receptor of DU145 cells. (A) Illustration on the SN-nanoruler for measuring α3β1 subunit-level distance. DML7 and each antibody bring FAM dye and G5NP to their binding sites, respectively. and represent the separation distance between the corresponding binding sites, and dα3 and dβ1 represent the size of each antibody, respectively. (B and C) Saturated binding concentration analysis of DML7-FAM. The numbers in the FCM chart indicated each final concentration (nM) of DML7-FAM incubated with native DU145 cells (cell). (D and E) Best co-incubation time analysis of DML7-FAM. The numbers in the FCM chart indicated each incubation time of saturated DML7-FAM with native DU145 cells (cell). (F and G) Competitive binding analysis of saturated DML7-FAM and different amounts of antiα3 (P1B5) (left) and antiβ1 (K-20) (right) including 1, 2, 4, and 8 μL, respectively. And the order of incubation with cells is DML7-FAM and antibody.
Fig. 7
Fig. 7. Synthesis and characterization of the G5@antibody conjugate. (A and B) Normalized absorbance of antiα3 (P1B5) and G5@antiβ1 (K-20) conjugates at varied pH values. (C and D) Normalized UV-VIS absorption spectra of native G5NP (gray line), G5@antiα3 (P1B5) (blue line), and G5@antiβ1 (K-20) (red line). The insets of C and D indicate agarose gel electrophoresis assay of G5@antiα3 (P1B5) and G5@antiβ1 (K-20) (channels 1 and 3) and native G5NPs (channels 2 and 4). (E and F) The polydispersity on hydration dynamics diameters of native G5NPs (gray line), G5@antiα3 (P1B5) (blue line) and G5@antiβ1 (K-20) (red line), respectively. (G–J) TEM images of native antiα3 (P1B5), G5@antiα3 (P1B5), native antiβ1 (K-20), and G5@antiβ1 (K-20), respectively. The green and yellow circles in (G–J) indicate G5NPs and antibodies, respectively. The scale bar in (G–J) is 5 nm.
Fig. 8
Fig. 8. Measurement of the DML7-FAM binding integrin α3β1 receptor protein subunit domain in living cell systems. (A–E) Confocal imaging analysis of DU145 cells including native cells (A), incubation with the saturated DML7-FAM aptamer (B), and subsequent co-incubation with excess saturated G5@BSA as a negative control (C), G5@antiα3 (P1B5) (D), and G5@antiβ1 (K-20) (E), respectively. (F) FLI analysis of grey values that were estimated using Image J software. Group 1, 2, 3, and 4 indicated the cells in (B), (C), (D), and (E). (G and H) FCM assay on FLI quenching of DML7-FAM induced by different amounts of G5@antiα3 (P1B5) and G5@antiβ1 (K-20), respectively. FCM charts included native DU145 cells (cell), incubation with saturated DML7-FAM (+DML7-FAM), and the subsequent co-incubation with G5@antibody of different microliters as indicated by the numbers in each panel (++ number). (I) The ΦFLI curves plotted as a function of the amounts of G5@antiα3 (P1B5) (blue data) and G5@antiβ1 (K-20) (red data), respectively. (J and K) Linear relationship of F0/F and [Q] before the saturation binding of G5@antiα3 (P1B5) (J) and G5@antiβ1 (K-20) (K), respectively. (L) The calculated R′ values between the binding sites of DML7-FAM and each antibody according to the antibody size parameters obtained from TEM (group 1), AFM (group 2) and the theoretical calculation (group 3), respectively.

Similar articles

Cited by

References

    1. Shangguan D. Li Y. Tang Z. Cao Z. C. Chen H. W. Mallikaratchy P. Sefah K. Yang C. J. Tan W. Aptamers evolved from live cells as effective molecular probes for cancer study. Proc. Natl. Acad. Sci. U.S.A. 2006;103(32):11838–11843. doi: 10.1073/pnas.0602615103. doi: 10.1073/pnas.0602615103. - DOI - DOI - PMC - PubMed
    1. Drabik A. Ner-Kluza J. Mielczarek P. Civit L. Mayer G. Silberring J. Advances in the Study of Aptamer-Protein Target Identification Using the Chromatographic Approach. J. Proteome Res. 2018;17(6):2174–2181. doi: 10.1021/acs.jproteome.8b00122. doi: 10.1021/acs.jproteome.8b00122. - DOI - DOI - PubMed
    1. Shangguan D. Cao Z. Meng L. Mallikaratchy P. Sefah K. Wang H. Li Y. Tan W. Cell-specific aptamer probes for membrane protein elucidation in cancer cells. J. Proteome Res. 2008;7(5):2133–2139. doi: 10.1021/pr700894d. doi: 10.1021/pr700894d. - DOI - DOI - PMC - PubMed
    1. Tan J. Zhao M. Wang J. Li Z. Liang L. Zhang L. Yuan Q. Tan W. Regulation of Protein Activity and Cellular Functions Mediated by Molecularly Evolved Nucleic Acids. Angew Chem. Int. Ed. Engl. 2019;58(6):1621–1625. doi: 10.1002/anie.201809010. doi: 10.1002/anie.201809010. - DOI - DOI - PMC - PubMed
    1. Miao X. Li Z. Zhu A. Feng Z. Tian J. Peng X. Ultrasensitive electrochemical detection of protein tyrosine kinase-7 by gold nanoparticles and methylene blue assisted signal amplification. Biosens. Bioelectron. 2016;83:39–44. doi: 10.1016/j.bios.2016.04.032. doi: 10.1016/j.bios.2016.04.032. - DOI - DOI - PubMed