A bifunctional kinase-phosphatase module balances mitotic checkpoint strength and kinetochore-microtubule attachment stability
- PMID: 37712330
- PMCID: PMC10577578
- DOI: 10.15252/embj.2022112630
A bifunctional kinase-phosphatase module balances mitotic checkpoint strength and kinetochore-microtubule attachment stability
Abstract
Two major mechanisms safeguard genome stability during mitosis: the mitotic checkpoint delays mitosis until all chromosomes have attached to microtubules, and the kinetochore-microtubule error-correction pathway keeps this attachment process free from errors. We demonstrate here that the optimal strength and dynamics of these processes are set by a kinase-phosphatase pair (PLK1-PP2A) that engage in negative feedback from adjacent phospho-binding motifs on the BUB complex. Uncoupling this feedback to skew the balance towards PLK1 produces a strong checkpoint, hypostable microtubule attachments and mitotic delays. Conversely, skewing the balance towards PP2A causes a weak checkpoint, hyperstable microtubule attachments and chromosome segregation errors. These phenotypes are associated with altered BUB complex recruitment to KNL1-MELT motifs, implicating PLK1-PP2A in controlling auto-amplification of MELT phosphorylation. In support, KNL1-BUB disassembly becomes contingent on PLK1 inhibition when KNL1 is engineered to contain excess MELT motifs. This elevates BUB-PLK1/PP2A complex levels on metaphase kinetochores, stabilises kinetochore-microtubule attachments, induces chromosome segregation defects and prevents KNL1-BUB disassembly at anaphase. Together, these data demonstrate how a bifunctional PLK1/PP2A module has evolved together with the MELT motifs to optimise BUB complex dynamics and ensure accurate chromosome segregation.
Keywords: KNL1; PLK1; PP2A-B56; error-correction signalling; mitotic checkpoint.
© 2023 The Authors. Published under the terms of the CC BY 4.0 license.
Conflict of interest statement
The authors declare that they have no conflict of interest.
Figures

- A–D
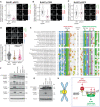
Effects of preventing PLK1 binding to BUBR1 (BUBR1‐T620A referred to as BUBR1ΔPLK1) on levels of BUBR1‐pS676 (A), BUBR1‐pT680 (B), BUBR1‐pS670 (C) and mCherry‐B56γ (D) at unattached kinetochores, in nocodazole‐arrested HeLa FRT cells expressing indicated YFP‐tagged BUBR1 constructs. Kinetochore intensities from 30 to 80 cells, 3–5 experiments. Kinetochore intensities are normalised to BUBR1 WT control. Violin plots show the distributions of kinetochore intensities between cells. For each violin plot, each dot represents an individual cell, the horizontal line represents the median and the vertical one the 95% CI of the median, which can be used for statistical comparison of different conditions (see Materials and Methods). Representative example immunofluorescence images of the kinetochore quantifications are shown for each BUBR1 phospho‐site in (A–D). The insets show magnifications of the outlined regions. Scale bars: 5 μm. Inset size: 1.5 μm.
- E
Alignment of PLK1‐ and PP2A‐binding region on all MADBUB homologues in metazoa that contain a predicted PP2A‐binding motif. The number of residues between PLK1 and PP2A binding is reported between the two alignments.
- F, G
Mitotic HeLa FRT cells expressing indicated exogenous BUBR1 constructs were harvested and lysed. Lysates were then blotted with indicated antibodies.
- H
Schematic illustrating how PLK1 and PP2A regulate each other's binding to BUBR1.

- A–D
Effects of PLK1 inhibition on levels of BUBR1‐pS676 (A), BUBR1‐pT680 (B), BUBR1‐pS670 (C) and mCherry‐B56γ (D) at unattached kinetochores, in nocodazole‐arrested HeLa FRT cells untreated or treated with the PLK1 inhibitor BI‐2536 (100 nM). Kinetochore intensities from 40 to 100 cells, 4–5 experiments. Kinetochore intensities are normalised to the time point 0′. Violin plots show the distributions of kinetochore intensities. For each violin plot, each dot represents an individual cell, the horizontal line represents the median and the vertical one the 95% CI of the median, which can be used for statistical comparison of different conditions (see Materials and Methods).
- E–H
Example immunofluorescence images of the kinetochore quantifications shown in (A–D). The insets show magnifications of the outlined regions. Scale bars: 5 μm. Inset size: 1.5 μm.

- A
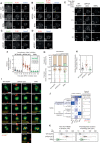
Schematic illustrating PLK1 and PP2A bound to WT BUBR1 (Bifunctional, on top) and the BUBR1 mutants used to lock PLK1 (Kinase, mid panel) or PP2A (Phosphatase, bottom panel).
- B, C
Effect of locking PLK1 or PP2A on levels of PLK1 (B) and BUBR1‐pT620 (C) at unattached kinetochores, in nocodazole‐arrested HeLa FRT cells expressing the indicated BUBR1 mutants or treated with control or BUB1 siRNAs. Kinetochore intensities from 30 to 40 cells, 3–4 experiments.
- D, E
Effects of locking PLK1 or PP2A on KNL1‐MELT dephosphorylation and YFP‐BUBR1 levels at unattached kinetochores (D) and duration of mitotic arrest (E) in nocodazole‐arrested cells treated with the MPS1 inhibitor AZ‐3146 (2.5 μM). In (D), treatment with MG132 (10 μM) was included to prevent mitotic exit after the addition of the MPS1 inhibitor, and kinetochore intensities were from 40 cells per condition, four experiments. Graph in (E) displays 50 cells per condition per experiment, three experiments.
- F–H
Effects of locking PLK1 or PP2A on chromosome alignment and kinetochore–microtubules attachments. (F) Example immunofluorescence images to show the presence of chromosome misalignments (DAPI) and the presence of unattached kinetochores (MAD1) in MG132‐treated cells. The insets show magnifications of the outlined regions. Scale bars: 5 μm. Inset size: 1.5 μm. (G) Top panel: protocol used to visualise chromosome misalignment in fixed samples (see Materials and Methods for details). Bottom panel: graph showing mean frequencies (± SEM) of three experiments, 100 cells quantified per condition per experiment. (H) The number of kinetochores positive for MAD1 was measured as a readout of unattached kinetochores. The measurement was performed on 30–40 cells from four experiments, before and after a cold‐shock treatment to disrupt unstable kinetochore–microtubules attachments. Treatment with MG132 (10 μM) was included in (F–H) to prevent cells from exiting mitosis.
- I
Frequencies of errors in anaphase in BUBR1 WT and B56γ cells (see also Fig EV2I–K). The graph shows mean frequencies (± SEM) of three experiments, 46–50 cells per experiment.

- A–E
Example immunofluorescence images of the kinetochore quantifications are shown in Fig 2B–D. Panel (D) shows the knockdown efficiency of BUB1, in relation to Fig 2B. The insets show magnifications of the outlined regions. Scale bars: 5 μm. Inset size: 1.5 μm.
- F
Effects of locking PLK1 or PP2A on the levels of PLK1 at unattached kinetochores, in nocodazole‐arrested HeLa FRT cells expressing the indicated BUBR1 mutants and treated with the MPS1 inhibitor AZ‐3146 (2.5 μM). Treatment with MG132 (10 μM) was included to prevent mitotic exit after the addition of the MPS1 inhibitor. Kinetochore intensities from 30 cells, in three experiments.
- G
Effects of locking PLK1 or PP2A on the duration of the mitotic arrest in nocodazole‐arrested HeLa FRT cells expressing the indicated BUBR1 mutants. Top panel: graph showing mean frequencies (± SEM) of cells that exit from mitosis. Bottom panel: distributions of the mitotic durations. Data from three experiments, 50 cells per condition per experiment.
- H
Effects of locking PLK1 or PP2A on the levels of HEC1‐pS55 at unattached kinetochores, in nocodazole‐arrested HeLa FRT cells expressing the indicated BUBR1 mutants. Kinetochore intensities from 45 cells, in three experiments.
- I–K
Effects of locking PLK1 or PP2A on the mitotic cell fate after nuclear envelope breakdown (NEBD). Panel (I) shows example images from live movies highlighting the most frequent mitotic cell fates. Cell fates are reported in yellow, and white arrows highlight defects during chromosome alignment or segregation. Scale bar: 20 μm. In (J), Left panel: heatmap showing the mean frequencies of cell fates after NEBD for each BUBR1 mutant—three experiments, 50 cells per condition per experiment. Right panel: percentages of the cell fates shown in the left panel from the three repeats of the experiment. For each distribution, the thick line corresponds to the mean values reported in the left panel. Panel (K) displays duration of mitosis (left panel) and prometaphase (right panel) of cells from (I) that divide after NEBD. Sample sizes: 146 cells in BUBR1 WT, 27 cells in ΔPP2A (ΔC) and 150 cells in B56γ. Data from three experiments.

- A
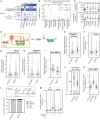
Schematic illustrating the PLK1/PP2A feedback loop on WT BUBR1 (left panel) and the BUBR1 alanine mutants on PLK1/CDK1 sites that were used to impair PP2A recruitment (right panel) and alter the PLK1/PP2A.
- B, C
Effect of impaired PP2A recruitment to BUBR1 on levels of BUBR1‐pT620 (B) and PLK1 (C) at unattached kinetochores, in nocodazole‐arrested HeLa FRT cells expressing the indicated BUBR1 mutants. Kinetochore intensities from 30 to 60 cells, 3–6 experiments.
- D–F
Effect of impaired PP2A recruitment to BUBR1 on levels of PLK1 (E) and mCherry‐B56γ (F) at ectopic foci on Chr I (D), in nocodazole‐arrested HeLa FRT cells expressing the indicated BUBR1 mutants. The schematics in (D) illustrate the experimental design to recruit YFP‐BUBR1 to the telomere of Chr I in HeLa FRT cells (see also Appendix Fig S1C and D and Materials and Methods for details). Panels (E) and (F) show PLK1 and mCherry‐B56γ levels at these chromatin foci. Foci intensities from 48 to 55 cells, three experiments.
- G, H
Effect of impaired PP2A recruitment to BUBR1 on KNL1‐MELT phosphorylation (G) and duration of mitotic arrest (H) in nocodazole‐arrested HeLa FRT cells expressing the indicated BUBR1 mutants. Cells in (H) were treated with the MPS1 inhibitor AZ‐3146 (2.5 μM). Panel (G) displays kinetochore intensities of 30–70 cells per condition, six experiments. Panel (H) displays 50 cells per condition per experiment, three experiments.
- I–K
Effect of impaired PP2A recruitment to BUBR1 on kinetochore levels of HEC1‐pS55 (I), chromosome alignment (J) and stability of kinetochore–microtubule attachments (K). Panel (I) shows levels of HEC1‐pS55 at unattached kinetochores, in nocodazole‐arrested HeLa FRT cells expressing the indicated BUBR1 mutants. Kinetochore intensities from 45 cells, three experiments. In (J), top panel is the protocol used to visualise chromosome misalignment in fixed samples (see Materials and Methods for details). Bottom panel includes graph showing mean frequencies of chromosome misalignments (± SEM) of three experiments, 100 cells quantified per condition per experiment. In (K), the number of kinetochores positive for MAD1 was measured as a readout of unattached kinetochores. The measurement was performed on 30–40 cells from 3 to 4 experiments, before and after a cold‐shock treatment to disrupt unstable kinetochore–microtubules attachments. In (J and K), treatment with MG132 (10 μM) was included to prevent cells from exiting mitosis.

- A–C
Evaluating the effect of indicated BUBR1 mutants on the mitotic cell fate after nuclear envelope breakdown (NEBD) (A and B) and on the duration of mitosis (C). The heatmap in panel (A) shows the mean frequencies of cell fates after NEBD in each condition—3–6 experiments, 50 cells per condition per experiment. Panel (B) shows the frequencies of the cell fates shown in (A) from the 3 to 6 repeats of the experiment. For each distribution, the thick line corresponds to the mean values reported in (A). Panel (C) shows the duration of mitosis (top panel) and prometaphase (bottom panel) of cells from (A) that divide after NEBD. Sample sizes: 295 cells in BUBR1 WT, 36 cells in ΔPP2A (ΔK), 127 cells in KARD2A, 89 cells in 670A, 93 cells in KARD3A and 135 cells in KARD2D. Data from 3 to 6 experiments.
- D
Schematic illustrating the PLK1/PP2A feedback loop on WT BUBR1 (left panel) and the BUBR1 aspartate mutant designed to enhance PP2A recruitment (right panel).
- E, F
Effect of BUBR1 aspartate mutant on levels of BUBR1‐pT620 (E) and PLK1 (F) at unattached kinetochores in nocodazole‐arrested HeLa FRT cells expressing the indicated BUBR1 mutants. Kinetochore intensities from 30 to 60 cells, 3–6 experiments. Note that distributions of WT BUBR1 condition are the same shown in Fig 3B and C.
- G, H
Effect of BUBR1 aspartate mutant on levels of PLK1 (G) and mCherry‐B56γ (H) at ectopic foci on Chr I, in nocodazole‐arrested HeLa FRT cells expressing the indicated BUBR1 mutants (see also Appendix Fig S1C and D and Materials and Methods for details). Foci intensities from 43 to 55 cells, three experiments. Note that distributions of WT BUBR1 condition are the same as shown in Fig 3E and F.
- I, J
Effect of BUBR1 aspartate mutant on KNL1‐MELT phosphorylation (I) and duration of mitotic arrest (J) in nocodazole‐arrested HeLa FRT cells expressing the indicated BUBR1 mutants. Cells in panel (J) were treated with the MPS1 inhibitor AZ‐3146 (2.5 μM). Panel (I) displays kinetochore intensities of 60–70 cells per condition, six experiments. Panel (J) displays 50 cells per condition per experiment, three experiments. Note that distributions of WT BUBR1 condition are the same as shown in Fig 3G and H.
- K–M
Effect of BUBR1 aspartate mutant on kinetochore levels of HEC1‐pS55 (K), chromosome alignment (L) and stability of kinetochore–microtubule attachments (M). Panel (K) shows levels of HEC1‐pS55 at unattached kinetochores, in nocodazole‐arrested HeLa FRT cells expressing the indicated BUBR1 mutants. Kinetochore intensities from 45 cells, three experiments. Note that distributions of WT BUBR1 and ΔPP2A(ΔK) conditions are the same as shown in Fig 3I. In (L), the top panel shows the protocol used to visualise chromosome misalignment in fixed samples (see Materials and Methods for details). Graph in bottom panel displays mean frequencies of chromosome misalignments (± SEM) of three experiments, 100 cells quantified per condition per experiment. Note that the mean frequencies of WT BUBR1 condition are the same as shown in Fig 3J. Panel (M) shows the number of kinetochores positive for MAD1 was measured as a readout of unattached kinetochores. The measurement was performed on 30–40 cells from 3 to 4 experiments, before and after a cold‐shock treatment to disrupt unstable kinetochore–microtubules attachments. Note that distributions of WT BUBR1 condition are the same as shown in Fig 3K. Treatment with MG132 (10 μM) was included in (L and M) to prevent cells from exiting mitosis.

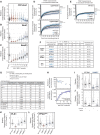
Scheme of human KNL1 with N‐terminal YFP‐tag. MELT motifs are represented with different shades of blue, according to the activity as evaluated in Vleugel et al (2015).
Schematic illustrating the KNL1 mutants created with a different number of active MELTs (see Materials and Methods for details).
Levels of KNL1‐pMELT, BUB1 and BUBR1 at unattached kinetochores, in nocodazole‐arrested HeLa FRT cells expressing the KNL1 mutants shown in panel (B). Kinetochore intensities from 40 to 60 cells, 3–5 experiments.
Levels of PLK1 (top graph) and mCherry‐B56γ (bottom graph) at unattached kinetochores, in nocodazole‐arrested HeLa FRT cells expressing the indicated KNL1‐MELT mutants. Kinetochore intensities from 30 to 80 cells, 3–4 experiments. Kinetochore intensities are normalised to the WT KNL1 condition.

- A–C
Levels of YFP‐KNL1 (A), BUB1 (B) and BUBR1 (C) at unattached kinetochores relative to CenpC, in nocodazole‐arrested HeLa FRT cells expressing the indicated KNL1 MELT mutants. Measurements performed on the same cells are shown in Fig 4C. Kinetochore intensities from 40 to 120 cells, 3–10 experiments.
- D, E
Fluorescence recovery after photobleaching (FRAP) measurements of BUB1 (D, top graph), BUBR1 (D, bottom graph) and KNL1 (E) at unattached kinetochores, in nocodazole‐arrested HeLa FRT cells expressing WT, 6xMELT or 19xMELT KNL1 mutants. For each condition, the mean recovery is represented by a thick line, the 95% CI of the mean with a shaded area and the mobile fraction of the recovery as percentage at the end of each curve (see also (F), Appendix Fig S3 and Materials and Methods for details). Number of cells from three experiments for BUB1 FRAP: 24 for WT Knl1, 25 for 6xMELT and 33 for 19xMELT. Number of cells from three experiments for BUBR1 FRAP: 30 for WT Knl1, 24 for 6xMELT and 24 for 19xMELT. Number of cells from three experiments for KNL1 FRAP: 54 for WT Knl1, 49 for 6xMELT and 57 for 19xMELT.
- F
Parameters related to the FRAP curves reported in panels (D) and (E) after fitting with a double‐exponential law (see Materials and Methods for details).
- G, H
Estimates of the number of KNL1 molecules and active MELT motifs per kinetochore, in nocodazole‐arrested HeLa FRT cells expressing the indicated KNL1 MELT mutants. The table in panel (G) reports the estimates per each KNL1 MELT mutants (see Materials and Methods for details). The graph in panel (H) shows the number of KNL1 molecules (top) or the number of active KNL1‐MELT motifs (bottom) plotted against the number of active MELTs per KNL1 molecule, using the data and the assumptions from (G). Data points in panel (H) (bottom) were fitted with an exponential plateau law (see Materials and Methods for details). The fitted curve is reported in the graph, together with the 95% CI of the fit and the estimated plateau. Goodness of fit: 98.69% (based on adjusted R 2).
- I, J
The levels of YFP‐KNL1 (I) and efficiency of BUB1 knockdown (J) at unattached kinetochores in nocodazole‐arrested HeLa FRT cells expressing WT or 19xMELT KNL1 mutants and knocked down for GAPDH or BUB1. Kinetochore intensities from 30 to 90 cells, 3–6 experiments.
- K, L
Levels of PLK1 (K) and mCherry‐B56γ (L) at unattached kinetochores relative to CenpC, in nocodazole‐arrested HeLa FRT cells expressing the indicated KNL1 MELT mutants. The measurements were performed on the same cells shown in Fig 4D. Kinetochore intensities from 30 to 80 cells, 3–4 experiments.

- A, B
Evaluation of the SAC signalling in KNL1‐MELT mutants, in terms of the duration of the mitotic arrest (A) and BUB1 levels at unattached kinetochores (B), in nocodazole‐arrested HeLa FRT cells expressing the indicated KNL1 mutants and treated with the MPS1 inhibitor AZ‐3146 (2.5 μM). Panel (A) displays 50 cells per condition per experiment, three experiments. Panel (B) shows kinetochore intensities from 30 cells, three experiments. Treatment with MG132 (10 μM) was included in (B) to prevent mitotic exit after the addition of the MPS1 inhibitor.
- C, D
Evaluating the contribution of PLK1 kinase activity to sustained SAC signalling, in terms of BUB1 levels at unattached kinetochores (C), and the duration of the mitotic arrest (D), in nocodazole‐arrested cells expressing WT or 19xMELT KNL1 and treated with the MPS1 inhibitor AZ‐3146 (2.5 μM), with or without the PLK1 inhibitor BI‐2536 (100 nM). Panel (C) shows kinetochore intensities from 30 cells, three experiments. The graph in panel (D) shows mean (± SEM) of three experiments, 50 cells per condition per experiment. Treatment with MG132 (10 μM) was included in (C) to prevent mitotic exit after the addition of the MPS1 inhibitor.
- E, F
Levels of MAD1‐pT716 (E) and BUB1‐pT461 (F) at unattached kinetochores in cells treated as in (B). Kinetochore intensities from 30 cells, three experiments. Treatment with MG132 (10 μM) was included to prevent mitotic exit after the addition of the MPS1 inhibitor.
- G
Evaluation of the role of PLK1 on the levels of BUB1‐pT461 in nocodazole‐arrested HeLa FRT cells expressing the indicated BUBR1 mutants, treated or not with the PLK1 inhibitor BI‐2536 (100 nM) for 30′. Kinetochore intensities from 30 cells, six experiments.

- A
Evaluation of KNL1‐pMELT levels at unattached kinetochores, in nocodazole‐arrested HeLa FRT cells expressing the indicated KNL1 mutants and treated with the MPS1 inhibitor AZ‐3416 (2.5 μM). Kinetochore intensities from 30 cells, three experiments. Treatment with MG132 (10 μM) was included to prevent mitotic exit after the addition of the MPS1 inhibitor.
- B, C
Evaluation of the role of BUB1 kinase activity in sustaining the SAC signalling, in terms of BUB1 levels at unattached kinetochores (B) and the duration of the mitotic arrest (C), in nocodazole‐arrested HeLa FRT cells expressing the indicated KNL1 mutants and treated with the MPS1 inhibitor AZ‐3146 (2.5 μM), with or without the BUB1 inhibitor BAY‐1816032 (5 μM). Panel (B) shows kinetochore intensities from 30 cells, in three experiments. Note that distributions of WT KNL1 and 19xMELT without BUB1 inhibition are the same as shown in Fig 5C. The graph in panel (C) shows mean (± SEM) of three experiments, 50 cells per condition per experiment. Treatment with MG132 (10 μM) was included in (B) to prevent mitotic exit after the addition of the MPS1 inhibitor.
- D
Levels of MAD1 at unattached kinetochores, in nocodazole‐arrested HeLa FRT cells expressing the indicated KNL1 mutants and treated with the MPS1 inhibitor AZ‐3416 (2.5 μM). Kinetochore intensities from 30 cells, three experiments. Treatment with MG132 (10 μM) was included to prevent mitotic exit after the addition of the MPS1 inhibitor.

- A
Levels of BUB1 (top panel) and BUBR1 (bottom panel) at kinetochores, in nocodazole or MG132‐treated HeLa FRT cells expressing the indicated KNL1 mutants (see also Appendix Fig S4A for a detailed comparison between nocodazole and MG132 treatments in all the experimental conditions). Kinetochore intensities from 20 to 30 cells, in 2–3 experiments.
- B
Example immunofluorescence images of some of the key kinetochore quantifications shown in (A) and Appendix Fig S4A. The insets show magnifications of the outlined regions. Scale bars: 5 μm. Inset size: 1.5 μm.
- C
Evaluation of the contribution of PLK1 and MPS1 in sustaining BUB1 recruitment at kinetochores, in MG132‐treated HeLa FRT cells expressing the indicated KNL1 mutants. Top panel: protocol used to enrich cells in metaphase and to inhibit PLK1 ± MPS1 (using BI‐2536 100 nM and AZ‐3146 2.5 μM, respectively, see also Materials and Methods for details). Bottom panel: kinetochore levels of BUB1 per KNL1. Kinetochore intensities from 20 to 30 cells, in three experiments.
- D
Duration of metaphase of HeLa FRT cells expressing the indicated KNL1 MELT mutants (see Fig 7A, Appendix Fig S5A and Materials and Methods for details). Number of cells from three experiments: 131 for WT KNL1 and 103 for 19xMELT.
- E
Levels of MAD1 at kinetochores, in nocodazole or MG132‐treated HeLa FRT cells expressing the indicated KNL1 mutants. Kinetochore intensities from 20 cells, in two experiments.
- F–H
Evaluation of the contribution of PLK1 in sustaining the recruitment of BUB1 and KNL1 to the midbody, in anaphase HeLa FRT cells expressing WT or 19xMELT KNL1 mutants and treated or not with PLK1 inhibitor (using BI‐2536 100 nM, see Materials and Methods for details). Panel (F) shows example immunofluorescence images of anaphase cells, in which the midbody is highlighted by white arrows. Scale bars: 5 μm. The graphs in (G) and (H) show mean frequencies (± SEM) of anaphase cells with visible KNL1 (G) or BUB1 (H) at the midbody. Data from 10 cells per experiment, in three experiments.

Mitotic cell fate after nuclear envelope breakdown (NEBD) in cells expressing the KNL1‐MELT mutants. The heatmap shows the mean frequencies of cell fates after NEBD in each condition: three experiments, 29–50 cells per condition per experiment (see also Appendix Fig S5A).
Evaluating the effects on chromosome alignment in KNL1‐MELT mutants. Top panel: protocol used to visualise chromosome misalignment in fixed samples (see Materials and Methods for details). Bottom panel: mean frequencies (± SEM) of three experiments, 100 cells quantified per condition per experiment. Treatment with MG132 (10 μM) was included to prevent mitotic exit.
Levels of PLK1 (top) and mCherry‐B56γ (bottom) at kinetochores, in nocodazole or MG132‐treated HeLa FRT cells expressing the indicated KNL1 mutants. Kinetochore intensities from 30 to 80 cells, in 3–4 experiments. Note that distributions of WT KNL1 in nocodazole are the same as shown in Fig 4D.
Evaluating the effects on chromosome alignment in HeLa FRT cells, expressing the indicated KNL1‐MELT mutants and challenged to correct more KT‐MT attachment errors (using STLC 10 μM, see Materials and Methods for details). Top panel: protocol used to visualise chromosome alignment in fixed samples (see Materials and Methods for details). Bottom panel: mean frequencies of chromosome alignment errors (± SEM) from three experiments, 100 cells quantified per condition per experiment (see also Appendix Fig S5B for different time points after release from STLC). Treatment with MG132 (10 μM) was included to prevent mitotic exit.
As a measure of unattached kinetochores, the number of kinetochores positive for MAD1 recruitment was measured. The measurement was performed in cells expressing the indicated KNL1‐MELT mutants, before and after a cold‐shock treatment to disrupt unstable kinetochore–microtubules attachments; 30–60 cells, 3–6 experiments. Treatment with MG132 (10 μM) was included to prevent mitotic exit.
Evaluation of the defects in chromosome segregation in WT and 19xMELT KNL1 cells, enriched in anaphase after a release from a STLC block (see Materials and Methods for details). The graph shows mean (± SEM) of three experiments, 100 cells per condition per experiment.

References
Publication types
MeSH terms
Substances
Grants and funding
LinkOut - more resources
Full Text Sources
Research Materials
Miscellaneous

