

Application of a physiologically based pharmacokinetic model to predict isoniazid disposition during pregnancy
- PMID: 37712488
- PMCID: PMC10651660
- DOI: 10.1111/cts.13614
Application of a physiologically based pharmacokinetic model to predict isoniazid disposition during pregnancy
Abstract
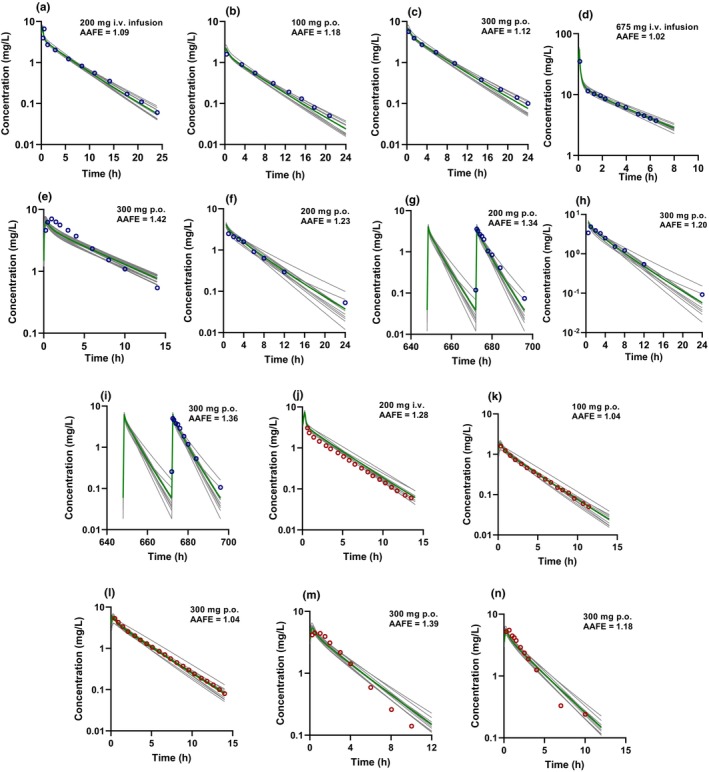
Pregnancy can increase the risk of latent tuberculosis infection (LTBI) progression to tuberculosis (TB) disease. Isoniazid (INH) is the preferred preventative treatment for LTBI in pregnancy. INH is mainly cleared by N-acetyltransferase 2 (NAT2) but the pharmacokinetics (PK) of INH in different NAT2 phenotypes during pregnancy is not well characterized. To address this knowledge gap, we used physiologically based pharmacokinetic (PBPK) modeling to evaluate NAT2 phenotype-specific effects of pregnancy on INH disposition. A whole-body PBPK model for INH was developed and verified for non-pregnant NAT2 fast (FA), intermediate (IA), and slow (SA) acetylators. Model predictive performance was assessed using a drug-specific model acceptance criterion for mean plasma area under the curve (AUC) and peak plasma concentration (Cmax ), and the absolute average fold error (AAFE) for individual plasma concentrations. The verified model was extended to simulate INH disposition during pregnancy in NAT2 SA, IA, and FA populations. A sensitivity analysis was conducted using the verified PBPK model and known changes in INH disposition during pregnancy to determine whether NAT2 activity changes during pregnancy or other INH clearance pathways are altered. This analysis suggested that NAT2 activity is unchanged while other INH clearance pathways increase by ~80% during pregnancy. The model was applied to explore the effect of pregnancy on INH disposition in two ethnic populations with different NAT2 phenotype distributions and with high TB burden. Our PBPK model can be used to predict INH disposition during pregnancy in diverse populations and expanded to other drugs cleared by NAT2 during pregnancy.
© 2023 The Authors. Clinical and Translational Science published by Wiley Periodicals LLC on behalf of American Society for Clinical Pharmacology and Therapeutics.
Conflict of interest statement
N.I. reports consultancy agreements with Boehringer‐Ingelheim and Johnson and Johnson, and honoraria from ASPET and McGraw Hill. O.U.A. has declared no competing interests for this work.
Figures


Similar articles
-
Population Pharmacokinetic Analysis of Isoniazid among Pulmonary Tuberculosis Patients from China.Antimicrob Agents Chemother. 2020 Feb 21;64(3):e01736-19. doi: 10.1128/AAC.01736-19. Print 2020 Feb 21. Antimicrob Agents Chemother. 2020. PMID: 31907179 Free PMC article.
-
A Physiologically Based Pharmacokinetic Model of Isoniazid and Its Application in Individualizing Tuberculosis Chemotherapy.Antimicrob Agents Chemother. 2016 Sep 23;60(10):6134-45. doi: 10.1128/AAC.00508-16. Print 2016 Oct. Antimicrob Agents Chemother. 2016. PMID: 27480867 Free PMC article.
-
The influence of dose and N-acetyltransferase-2 (NAT2) genotype and phenotype on the pharmacokinetics and pharmacodynamics of isoniazid.Eur J Clin Pharmacol. 2007 Jul;63(7):633-9. doi: 10.1007/s00228-007-0305-5. Epub 2007 May 16. Eur J Clin Pharmacol. 2007. PMID: 17505821
-
A Systematic Review and Meta-analysis of Isoniazid Pharmacokinetics in Healthy Volunteers and Patients with Tuberculosis.Clin Ther. 2020 Nov;42(11):e220-e241. doi: 10.1016/j.clinthera.2020.09.009. Epub 2020 Oct 5. Clin Ther. 2020. PMID: 33032843
-
Parametric population pharmacokinetics of isoniazid: a systematic review.Expert Rev Clin Pharmacol. 2023 May;16(5):467-489. doi: 10.1080/17512433.2023.2196401. Epub 2023 Apr 3. Expert Rev Clin Pharmacol. 2023. PMID: 36971782
Cited by
-
The role of isoniazid dosage and NAT2 gene polymorphism in the treatment of tuberculous meningitis.Front Immunol. 2025 Jan 20;15:1535447. doi: 10.3389/fimmu.2024.1535447. eCollection 2024. Front Immunol. 2025. PMID: 39902038 Free PMC article.
-
PBPK Modeling to Recommend Nevirapine Dosing in HIV and HIV-TB Co-infected Patients: Leveraging Enzyme Auto-Induction, Drug Interactions, and Ethnic Variability.AAPS J. 2025 Mar 12;27(2):59. doi: 10.1208/s12248-025-01042-9. AAPS J. 2025. PMID: 40074933
-
Advancing Precision Medicine: A Review of Innovative In Silico Approaches for Drug Development, Clinical Pharmacology and Personalized Healthcare.Pharmaceutics. 2024 Feb 27;16(3):332. doi: 10.3390/pharmaceutics16030332. Pharmaceutics. 2024. PMID: 38543226 Free PMC article. Review.
-
Precision Medicine Strategies to Improve Isoniazid Therapy in Patients with Tuberculosis.Eur J Drug Metab Pharmacokinet. 2024 Sep;49(5):541-557. doi: 10.1007/s13318-024-00910-7. Epub 2024 Aug 17. Eur J Drug Metab Pharmacokinet. 2024. PMID: 39153028 Free PMC article. Review.
-
An Update on the Clinical Management of HIV and Tuberculosis Co-Infection in Pregnancy: TB Preventative Therapy, Long-Acting ARVs, and Bedaquiline-Based Regimens.Curr HIV/AIDS Rep. 2025 Jun 16;22(1):37. doi: 10.1007/s11904-025-00746-z. Curr HIV/AIDS Rep. 2025. PMID: 40522414 Free PMC article. Review.
References
-
- Zenner D, Kruijshaar ME, Andrews N, Abubakar I. Risk of tuberculosis in pregnancy: a national, primary care‐based cohort and self‐controlled case series study. Am J Respir Crit Care Med. 2012;185(7):779‐784. - PubMed
Publication types
MeSH terms
Substances
LinkOut - more resources
Full Text Sources
Medical
Miscellaneous
