. 2024 Jan;72(1):69-89.
doi: 10.1002/glia.24462. Epub 2023 Sep 15.

Novel method of isolating nuclei of human oligodendrocyte precursor cells reveals substantial developmental changes in gene expression and H3K27ac histone modification

Affiliations

Novel method of isolating nuclei of human oligodendrocyte precursor cells reveals substantial developmental changes in gene expression and H3K27ac histone modification

Alexey Kozlenkov et al. Glia. 2024 Jan.

Abstract

Oligodendrocyte precursor cells (OPCs) generate differentiated mature oligodendrocytes (MOs) during development. In adult brain, OPCs replenish MOs in adaptive plasticity, neurodegenerative disorders, and after trauma. The ability of OPCs to differentiate to MOs decreases with age and is compromised in disease. Here we explored the cell specific and age-dependent differences in gene expression and H3K27ac histone mark in these two cell types. H3K27ac is indicative of active promoters and enhancers. We developed a novel flow-cytometry-based approach to isolate OPC and MO nuclei from human postmortem brain and profiled gene expression and H3K27ac in adult and infant OPCs and MOs genome-wide. In adult brain, we detected extensive H3K27ac differences between the two cell types with high concordance between gene expression and epigenetic changes. Notably, the expression of genes that distinguish MOs from OPCs appears to be under a strong regulatory control by the H3K27ac modification in MOs but not in OPCs. Comparison of gene expression and H3K27ac between infants and adults uncovered numerous developmental changes in each cell type, which were linked to several biological processes, including cell proliferation and glutamate signaling. A striking example was a subset of histone genes that were highly active in infant samples but fully lost activity in adult brain. Our findings demonstrate a considerable rearrangement of the H3K27ac landscape that occurs during the differentiation of OPCs to MOs and during postnatal development of these cell types, which aligned with changes in gene expression. The uncovered regulatory changes justify further in-depth epigenetic studies of OPCs and MOs in development and disease.

Keywords: OPC; development; epigenetics.


Conflict of interest statement

CONFLICT OF INTEREST STATEMENT

The authors declare that they have no conflict of interest.

Figures

Figure 1.
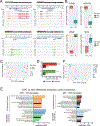
Figure 1.. Schematic of the FANS protocol to isolate nuclei of OPC and MO cells from human postmortem brain tissue.
Data for a representative FANS experiment are shown. Upper right panel, dendrogram of the FANS gating steps. Other panels show the sequential gating steps. The labels on the axes denote the antibodies (NeuN, SOX10, SOX6) and the fluorophores (DAPI, PE, AF488, AF647) used. The numbers represent the percentages of sorted populations relative to the parent population in the previous gating step.
Figure 2.
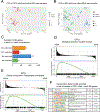
Figure 2.. Validation of the FANS-separated OPC and MO populations by gene expression profiling.
(A) Principal component (PC) analysis of nuclear RNA-seq data sets of MOs and OPCs from 3 donors. (B) Pairwise comparison of gene expression between OPCs and MOs. Each dot represents one gene (data for protein-coding or lincRNA genes are shown). TPM, transcripts per million reads. Green, examples of known markers of MOs. Red, examples of known markers of OPCs. Purple, examples of oligodendroglial lineage markers (e.g., SOX10, NKX2-2). Orange, examples of markers of other brain cell populations (e.g., BDNF, GLI3, CX3CR1). (C) Gene ontology (GO) analysis of the differentially expressed (DE) genes which are enriched in either OPCs (left) or in MOs (right) compared to the other cell type. The website portal WebGestalt was used for the analysis (see Methods). Data for GO Biological Processes and GO Cellular Components are shown for a maximum of 10 top enriched terms. See Table S3 for the entire list of enriched GO terms.
Figure 3.
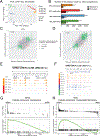
Figure 3.. Comparison of the H3K27ac landscapes between adult OPCs and MOs.
(A) H3K27ac ChIP-seq profiles within loci of OPC (CSPG4, PDGFRA) or MO (MOBP, MOG) marker genes. H3K27ac traces for OPC and MO samples from 5 adult donors are shown. Red traces denote OPC and green traces denote MO samples. The H3K27ac signal is normalized across all samples. (B) Gene expression data for genes shown in (A). (C) PC analysis of the H3K27ac adult data sets. (D) Barplot depicting the numbers of differentially acetylated (DA) peaks identified in the OPC vs. MO comparison using DESeq2 with thresholds FC > 2 and FDR < 0.05. (E) GO analysis of the DA peaks which are enriched in OPCs (left) and MOs (right) compared to the other cell type. The website portal GREAT was used for the analysis. Data for GO Biological Processes and GO Cellular Components for the maximum 10 top enriched terms are shown. See Table S7 for the entire list of the enriched GO terms. Red, GO terms associated with myelination. Light blue, cytoskeleton. Orange, proteoglycan biosynthesis. Dark blue, synaptic components. Pink: axonogenesis. Green: ion channels. Gray: endosomal transport. (F) PC analysis of the combined H3K27ac data sets of MOs and OPCs from this study, and GLU neurons, MGE-GABA neurons and oligodendroglial (OLIG) cells from (Kozlenkov et al., 2018). OLIG consist of OPC and MO populations. Data for all detected peaks were used in the analysis; see Fig. S4 for the analysis of the 1,000 most variable peaks.
Figure 4.
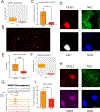
Figure 4.. Analysis of concordant changes between gene expression and H3K27ac signal in adult OPCs and MOs.
(A) Heatmap of RNA-seq gene expression values (log10(TPM+0.1) and H3K27ac signal intensities (rlog values) for adult replicate samples of OPCs (red column header) and MOs (green column header). Each row denotes a pair of a gene and an associated H3K27ac peak. The peak-to-gene annotations were calculated with the R package ChIPseeker. Also shown are log2(Fold Change) values for the differential expression (DE) and differential H3K27ac acetylation (DA) comparisons between OPCs and MOs, as well as the DE and DA status for genes and peaks. Data are shown separately for promoter peaks (defined as H3K27ac peaks overlapping the regions within 1,000 bp from a transcription start site of a gene), and putative enhancer peaks (distal H3K27ac peaks). The peak-to-gene pairs are sorted by the value of log2(FC) in the DE comparison. Examples of genes and their promoter peaks for several OPC and MO marker genes are highlighted. (B) Correlation between OPCs vs. MOs differences in gene expression and differences in H3K27ac signal intensities for peak-to-gene pairs. r: Pearson correlation coefficient. Blue line, linear regression line. Green, peak-to-gene pairs that show concordant changes in gene expression and H3K27ac signal. Red, peak-to-gene pairs that show discordant changes in gene expression and H3K27ac signal. Gray, other peak-to-gene pairs. (C) Box plots depicting the H3K27ac signal (rlog values) in OPCs (red background) or MOs (green background) for peaks associated with genes that are enriched in OPCs (red), enriched in MOs (green), or not DE (gray) in the OPC vs. MO comparison. Left panel, data for promoter peaks. Right panel, data for enhancer peaks. Statistical comparisons are by Welch t-test, (*) denotes significant differences (all p-values < 2.2e-12).
Figure 5.
Figure 5.. Significant differences in the gene expression profiles of OPCs and MOs between infant and adult brain.
(A) PC analysis of RNA-seq infant and adult OPC samples. Orange, infant OPC samples. Red, adult OPC samples. (B) PC analysis of RNA-seq infant and adult MO samples. Blue, infant MO samples. Green, adult MO samples. Labels in (A) and (B) denote the age of subjects in years. (C) Numbers of DE genes detected in adult vs. infant comparisons in OPCs and MOs. (D) and (E) Selected results of gene set enrichment analysis (GSEA) in OPCs and MOs. GSEA plots for selected GO terms enriched in infant-upregulated genes in OPCs are shown. See Table S10 for the entire list of the enriched GO terms. (F) Results of the analysis of transcription factor binding motif enrichment at promoters of infant vs. adult DE genes. The list of significantly enriched motifs for infant > adult DE OPC genes is shown. The analysis was performed with software tool HOMER.
Figure 6.
Figure 6.. Developmental changes in the H3K27ac histone modification profiles of OPCs and MOs between infants and adults.
(A) PC analysis of H3K27ac ChIP-seq profiles of MO and OPC samples from infant or adult subjects (a total of 20 samples). The labels denote the age of subjects in years. Blue, infant MO samples. Green, adult MO samples. Orange, infant OPC samples. Red, adult OPC samples. (B) Barplot depicting the numbers of differentially acetylated (DA) peaks detected in infant vs. adult comparisons. DA peaks were defined with DESeq2 using thresholds: FC > 2 and FDR < 0.05. Color code: as in Fig. 6A. (C) and (D) Correlations between adult vs. infant differences in gene expression and differences in H3K27ac signal intensities for peak-to-gene pairs in OPCs (C) and MOs (D). r: Pearson correlation coefficient. Blue line, linear regression line. Green, peak-to-gene pairs that show concordant changes in gene expression and H3K27ac signal. Red, peak-to-gene pairs that show discordant changes in gene expression and H3K27ac signal. Gray, other peak-to-gene pairs. (E) and (F). Examples of gene loci for genes with age-dependent differences in H3K27ac profiles in OPCs and MOs. (E) the chr6:27,800,000–27,898,000 region – a subcluster of histone genes which is a part of the histone gene cluster HIST1, (F) GRIK2 locus. y/o, age in years. (G) and (H) Selected results of gene set enrichment analysis (GSEA) for infant vs. adult H3K27ac comparisons in OPCs and MOs. GSEA plots for selected GO terms enriched in infant-upregulated genes in OPCs (G) and MOs (H) are shown. See Table S15 for the entire list of the enriched GO terms.
Figure 7.
Figure 7.. Validation of developmental changes in OPC gene expression through immunohistochemistry.
(A) Expression levels of the MKI67 gene in infant and adult OPCs. (B) Representative microscope image of infant DLPFC cortical tissue stained with anti-Ki67 (white) and anti-OLIG2 (red). All Ki67+ cells overlapped with OLIG2+ cells. (C) Density of Ki67+/OLIG2+ cells (cells/mm2) in DLPFC gray matter sections from infants and adults. (D) Representative confocal microscope image (40x magnification) of an OPC cell (NG2+/OLIG2+/DAPI+ cell) which is also positive for Ki67 staining. Scale bar: 10 microns. (E) Percentage of OPC nuclei (SOX6+/SOX10+/NeuN- nuclei) observed in FAN-sorting experiments (n= 11 infant and 14 adult subjects). (F) Expression levels of the SOX9 gene in infant and adult OPCs. (G) H3K27ac profiles from infant (orange) and adult (red) OPC samples in the vicinity of the SOX9 locus, (H) Representative confocal microscope image (63x magnification) of an OPC cell (NG2+/OLIG2+/DAPI+ cell on the right of the field of view) which is also positive for SOX9 staining. The SOX9-positive cell on the left is OLIG2- and NG2-negative. Scale bar: 10 microns. (I) Percentage of SOX9-positive OPCs among all OPCs in DLPFC gray matter sections from infants and adults.

Similar articles

References

    1. Aggarwal S, Yurlova L and Simons M (2011) ‘Central nervous system myelin: Structure, synthesis and assembly’, Trends in Cell Biology Elsevier Ltd, 21(10), pp. 585–593. doi: 10.1016/j.tcb.2011.06.004. - DOI - PubMed
    1. Akay LA, Effenberger AH and Tsai LH (2021) ‘Cell of all trades: Oligodendrocyte precursor cells in synaptic, vascular, and immune function’, Genes and Development, 35(3), pp. 180–198. doi: 10.1101/GAD.344218.120. - DOI - PMC - PubMed
    1. Bakhti M, Aggarwal S and Simons M (2014) ‘Myelin architecture: zippering membranes tightly together’, Cellular and Molecular Life Sciences, 71(7), pp. 1265–1277. doi: 10.1007/s00018-013-1492-0. - DOI - PMC - PubMed
    1. Barateiro A, Brites D and Fernandes A (2016) ‘Oligodendrocyte Development and Myelination in Neurodevelopment: Molecular Mechanisms in Health and Disease’, Current Pharmaceutical Design, 22, pp. 656–679. - PubMed
    1. Barber HM, Ali MF and Kucenas S (2022) ‘Glial Patchwork: Oligodendrocyte Progenitor Cells and Astrocytes Blanket the Central Nervous System’, Frontiers in Cellular Neuroscience, 15(January), pp. 1–14. doi: 10.3389/fncel.2021.803057. - DOI - PMC - PubMed

Publication types