Disruption of the microbiota-gut-brain axis is a defining characteristic of the α-Gal A (-/0) mouse model of Fabry disease
- PMID: 37712629
- PMCID: PMC10506438
- DOI: 10.1080/19490976.2023.2256045
Disruption of the microbiota-gut-brain axis is a defining characteristic of the α-Gal A (-/0) mouse model of Fabry disease
Abstract
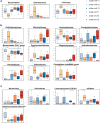
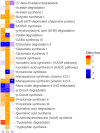
Fabry disease (FD) is an X-linked metabolic disease caused by a deficiency in α-galactosidase A (α-Gal A) activity. This causes accumulation of glycosphingolipids, especially globotriaosylceramide (Gb3), in different cells and organs. Neuropathic pain and gastrointestinal (GI) symptoms, such as abdominal pain, nausea, diarrhea, constipation, and early satiety, are the most frequent symptoms reported by FD patients and severely affect their quality of life. It is generally accepted that Gb3 and lyso-Gb3 are involved in the symptoms; nevertheless, the origin of these symptoms is complex and multifactorial, and the exact mechanisms of pathogenesis are still poorly understood. Here, we used a murine model of FD, the male α-Gal A (-/0) mouse, to characterize functionality, behavior, and microbiota in an attempt to elucidate the microbiota-gut-brain axis at three different ages. We provided evidence of a diarrhea-like phenotype and visceral hypersensitivity in our FD model together with reduced locomotor activity and anxiety-like behavior. We also showed for the first time that symptomology was associated with early compositional and functional dysbiosis of the gut microbiota, paralleled by alterations in fecal short-chain fatty acid levels, which partly persisted with advancing age. Interestingly, most of the dysbiotic features suggested a disruption of gut homeostasis, possibly contributing to accelerated intestinal transit, visceral hypersensitivity, and impaired communication along the gut-brain axis.
Keywords: Fabry disease; gastrointestinal disorders; gut microbiota; gut-brain axis; short-chain fatty acids; visceral pain; α-Gal A null mice.
Conflict of interest statement
No potential conflict of interest was reported by the author(s).
Figures


Similar articles
-
Altered globotriaosylceramide accumulation and mucosal neuronal fiber density in the colon of the Fabry disease mouse model.Neurogastroenterol Motil. 2019 Mar;31(3):e13529. doi: 10.1111/nmo.13529. Epub 2019 Jan 4. Neurogastroenterol Motil. 2019. PMID: 30609268
-
Characterization of Fabry disease-associated lyso-Gb3 on mouse colonic ion transport and motility.Am J Physiol Gastrointest Liver Physiol. 2024 Dec 1;327(6):G810-G817. doi: 10.1152/ajpgi.00220.2024. Epub 2024 Oct 15. Am J Physiol Gastrointest Liver Physiol. 2024. PMID: 39404773
-
Anderson-Fabry disease: a multiorgan disease.Curr Pharm Des. 2013;19(33):5974-96. doi: 10.2174/13816128113199990352. Curr Pharm Des. 2013. PMID: 23448451 Review.
-
Characterization of small fiber pathology in a mouse model of Fabry disease.Elife. 2018 Oct 17;7:e39300. doi: 10.7554/eLife.39300. Elife. 2018. PMID: 30328411 Free PMC article.
-
The Gut-Brain Axis in Multiple Sclerosis. Is Its Dysfunction a Pathological Trigger or a Consequence of the Disease?Front Immunol. 2021 Sep 21;12:718220. doi: 10.3389/fimmu.2021.718220. eCollection 2021. Front Immunol. 2021. PMID: 34621267 Free PMC article. Review.
Cited by
-
Benefits of Camelina sativa Supplementation in Morphine Treatment: Enhanced Analgesia, Delayed Tolerance and Reduced Gut Side Effects Through PPAR-α Receptor Engagement.Int J Mol Sci. 2025 Mar 11;26(6):2519. doi: 10.3390/ijms26062519. Int J Mol Sci. 2025. PMID: 40141162 Free PMC article.
-
The Hidden Burden: Gastrointestinal Involvement in Lysosomal Storage Disorders.Metabolites. 2025 May 29;15(6):361. doi: 10.3390/metabo15060361. Metabolites. 2025. PMID: 40559385 Free PMC article. Review.
-
Mechanistic Intimate Insights into the Role of Hydrogen Sulfide in Alzheimer's Disease: A Recent Systematic Review.Int J Mol Sci. 2023 Oct 23;24(20):15481. doi: 10.3390/ijms242015481. Int J Mol Sci. 2023. PMID: 37895161 Free PMC article. Review.
-
Gut microbiota dysbiosis affects intestinal sensitivity through epithelium-to-neuron signaling: novel insights from a colon organoid-based model to improve visceral pain therapy.Gut Microbes. 2025 Dec;17(1):2547029. doi: 10.1080/19490976.2025.2547029. Epub 2025 Sep 3. Gut Microbes. 2025. PMID: 40903878 Free PMC article.
-
Diabetic Neuropathic Pain: Directions for Exploring Treatments.Biomedicines. 2024 Mar 6;12(3):589. doi: 10.3390/biomedicines12030589. Biomedicines. 2024. PMID: 38540203 Free PMC article. Review.
References
Publication types
MeSH terms
LinkOut - more resources
Full Text Sources
