. 2023 Sep 15;11(5):e0228523.
doi: 10.1128/spectrum.02285-23. Online ahead of print.

Precision detection of recent HIV infections using high-throughput genomic incidence assay

Affiliations

Precision detection of recent HIV infections using high-throughput genomic incidence assay

Gina Faraci et al. Microbiol Spectr. .

Abstract

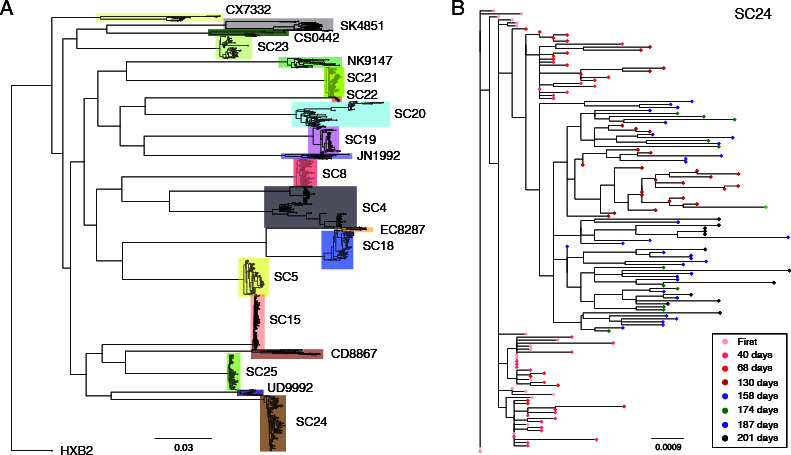
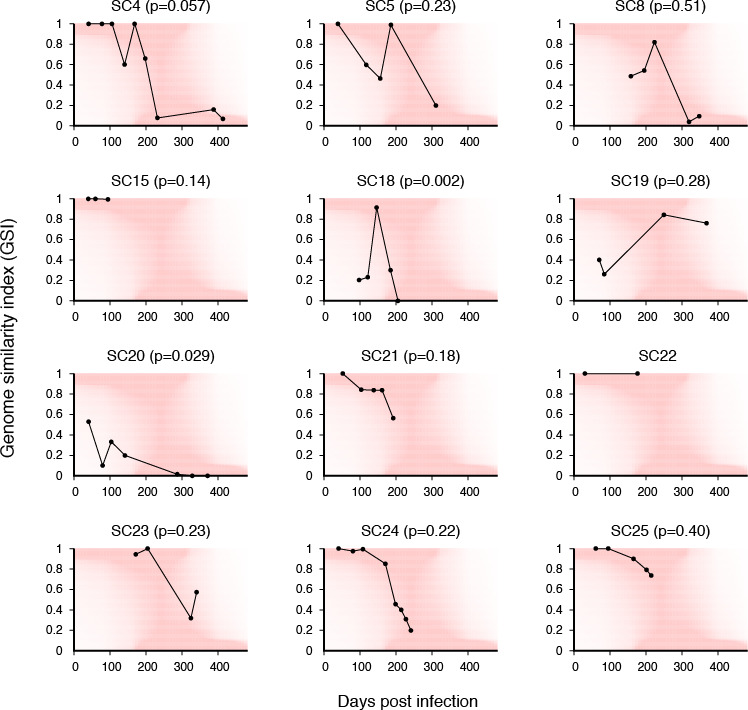
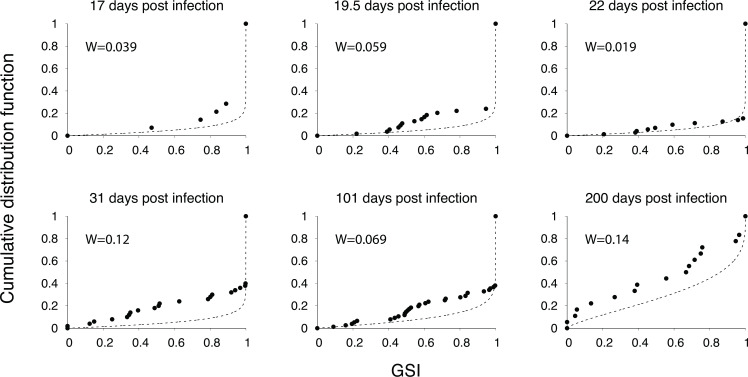
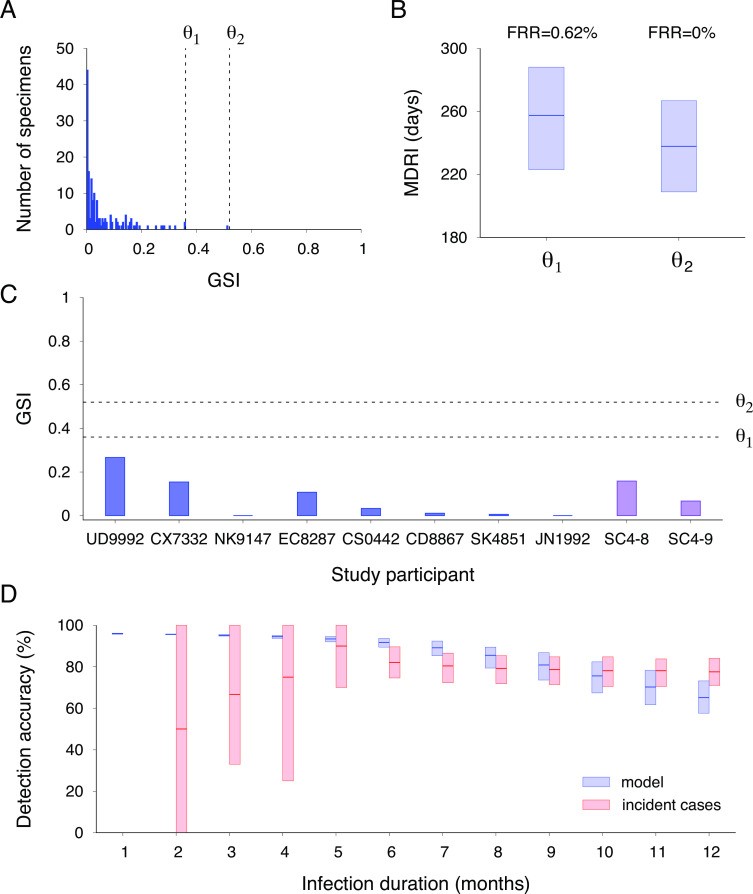
HIV incidence is a key measure for tracking disease spread and identifying populations and geographic regions where new infections are most concentrated. The HIV sequence population provides a robust signal for the stage of infection. Large-scale and high-precision HIV sequencing is crucial for effective genomic incidence surveillance. We produced 1,034 full-length envelope gene sequences from a seroconversion cohort by conducting HIV microdrop sequencing and measuring the genomic incidence assay's genome similarity index (GSI) dynamics. The measured dynamics of 9 of 12 individuals aligned with the GSI distribution estimated independently using 417 publicly available incident samples. We enhanced the capacity to identify individuals with recent infections, achieving predicted detection accuracies of 92% (89%-94%) for cases within 6 months and 81% (74%-87%) for cases within 9 months. These accuracy levels agreed with the observed detection accuracy intervals of an independent validation data set. Additionally, we produced 131 full-length envelope gene sequences from eight individuals with chronic HIV infection. This analysis confirmed a false recency rate (FRR) of 0%, which was consistent with 162 publicly available chronic samples. The mean duration of recent infection (MDRI) was 238 (209-267) days, indicating an 83% improvement in performance compared to current recent infection testing algorithms. The shifted Poisson mixture model was then used to estimate the time since infection, and the model estimates showed an 88% consistency with the days post infection derived from HIV RNA test dates and/or seroconversion dates. HIV microdrop sequencing provides unique prospects for large-scale incidence surveillance using high-throughput sequencing. IMPORTANCE Accurate identification of recently infected individuals is vital for prioritizing specific populations for interventions, reducing onward transmission risks, and optimizing public health services. However, current HIV-specific antibody-based methods have not been satisfactory in accurately identifying incident cases, hindering the use of HIV recency testing for prevention efforts and partner protection. Genomic incidence assays offer a promising alternative for identifying recent infections. In our study, we used microdroplet technologies to produce a large number of complete HIV envelope gene sequences, enabling the accurate detection of early infection signs. We assessed the dynamics of the incidence assay's metrics and compared them with statistical models. Our approach demonstrated high accuracy in identifying individuals with recent infections, achieving predicted detection rates exceeding 90% within 6 months and over 80% within 9 months of infection. This high-resolution method holds significant potential for enhancing the effectiveness of HIV incidence screening for case-based surveillance in public health initiatives.

Keywords: HIV incidence; genomic epidemiology; genomic surveillance; next-generation sequencing.


Conflict of interest statement

The authors declare no conflict of interest.

Figures

Fig 1
Fig 1
Maximum likelihood trees. (A) Maximum likelihood tree of all 1,165 full-length envelope gene sequences from both the CDC seroconversion cohort (denoted by SC) and LAC-USC Rand Schrader Clinic cohort, aligned with the HXB2-envelope sequence. Each colored box represents each study participant’s cluster. The envelope gene sequences were aligned using MAFFT (version 7.392) (28), and the resulting alignment was used to build a phylogenetic tree using FastTree (version 2.1.8) (29). The final tree was visualized using FigTree (version 1.4.4). (B) Maximum likelihood tree of 147 full-length envelope gene sequences from study participant SC24 in the CDC seroconversion cohort. The first sample was colored in pink, and subsequent sequences collected at 40, 68, 130, 158, 174, 187, and 201 days after the first sample were colored in light red, red, dark red, purple, green, blue, and black, respectively.
Fig 2
Fig 2
GSI dynamics for 12 individuals’ samples collected at serial visits. Under each individual trajectory, the heatmap (red) showed the fitted densities of the GSI distribution over time. The goodness-of-fit P-value was obtained from a one-sample Kolmogorov-Smirnov test.
Fig 3
Fig 3
Cumulative distribution functions (CDFs) for GSI. The fitted CDFs for GSI at six values of days post infection (dashed lines), along with the empirical CDFs (points) determined from 14 incident samples collected at 17 days post infection, 54 samples at 19.5 days, 71 samples at 22 days, 50 samples at 31 days, 76 samples at 101 days, and 18 samples collected between 175 and 225 days post infection. The Wasserstein distances, W, between the fitted and empirical CDFs are shown in each panel.
Fig 4
Fig 4
MDRI, FRR, and detection accuracy. (A) The GSI distribution of previously published envelope gene sequences from 162 chronic samples with an infection time longer than 1 year (18, 19). Setting a threshold value of 0.36 (denoted as θ 1), the FRR was 0.62% (0%–1.9%). Setting a higher threshold value of 0.52 (denoted as θ 2), the FRR was 0%. (B) The MDRI was estimated as 257 (223–288) days for θ 1 and as 238 (209–267) days for θ 2. (C) GSI values of eight chronically infected individuals from the LAC-USC Rand Schrader Clinic and two chronic specimens from the CDC seroconversion cohort. These values were below both θ 1 and θ 2 thresholds. (D) Detection accuracy of incident cases within a given time of infection using our model (red boxes) and publicly available incident specimens with a maximum infection duration (blue boxes) (18, 19). The model predicted that incident cases within 6 months of infection could be detected with an accuracy of 92% (89%–94%), which overlapped with the observed accuracy of 67 incident cases within 6 months, at 82% (75%–90%). Similarly, the model predicted an accuracy of 81% (74%–87%) for detecting incident cases within 9 months of infection, which overlapped with the measured accuracy for 103 incident cases within 9 months, at 79% (72%–85%).
Fig 5
Fig 5
Infection time estimates by SPMM. (A) The fit of SPMM (red line) to the Hamming distance distribution of SC4-1’s 16 envelope gene sequences (grey boxes). The number of founder strains was estimated as two and the time since infection was estimated as 40.6 (27.3–53.9). (B) Two lineages were colored by red and blue in the phylogenetic tree of SC4-1’s 16 envelope gene sequences. (C) Time since infection estimated by SPMM was consistent with HIV RNA test date estimate of (21–269) days and the Fiebig staging estimate of 40.5 (34–55) days. (D) The fit of SPMM to the Hamming distance distribution of SC4-2. (E) The fit of SPMM to the Hamming distance distribution of SC4-3. (F) Our model estimates for the times since infection of the SC4 samples were consistent with the estimates obtained by Fiebig staging and sample collection intervals (Pearson correlation coefficient Ρ = 0.98). (G) The fit of SPMM to the Hamming distance distribution of SC5-4. (H) The model estimate agreed with the infection time range based on dates of the last negative and first positive HIV RNA tests. (I) The fit of SPMM to the Hamming distance distribution of SC5-5. (J) The model estimates for specimens obtained from SC5 were consistent with the infection times determined by HIV RNA test dates and sample collection intervals (Ρ = 1.0). (K) The fit of SPMM to the Hamming distance distribution of SC15-1. (L) The model estimate for SC15-1 overlapped with the infection time interval determined by Fiebig staging but was greater than the interval determined by the dates of the HIV RNA tests. (M) The fit of SPMM to the Hamming distance distribution of SC15-2. (N) The fit of SPMM to the Hamming distance distribution of SC15-3. (O) SPMM’s infection time estimates were consistent with Fiebig estimates for the SC15’s three samples (Ρ = 0.99). (P) The SPMM model fit to the Hamming distance distribution of SC20-1’s 17 envelope gene sequences revealed the presence of four peaks, indicating the signature of three founder strains. (Q) Three lineages were colored in red, blue, and green in the phylogenetic tree of SC20-1. (R) The fit of SPMM to the Hamming distance distribution of SC21-1. (S) The model estimate fell within the range determined by the HIV RNA test results. (T) The SPMM model fit to the Hamming distance distribution of SC21-3. (U) The SPMM model fit to the Hamming distance distribution of SC21-4. (V) The SPMM model fit to the Hamming distance distribution of SC21-5. (W) The SPMM model fit to the Hamming distance distribution of SC21-6. (X) The model estimates were consistent with the sample collection intervals of SC21 (Ρ = 0.79).

References

    1. Busch MP, Pilcher CD, Mastro TD, Kaldor J, Vercauteren G, Rodriguez W, Rousseau C, Rehle TM, Welte A, Averill MD, Garcia Calleja JM, WHO Working Group on HIV Incidence Assays . 2010. Beyond detuning: 10 years of progress and new challenges in the development and application of assays for HIV incidence estimation. AIDS 24:2763–2771. doi: 10.1097/QAD.0b013e32833f1142 - DOI - PubMed
    1. Mastro TD. 2013. Determining HIV incidence in populations: moving in the right direction. J Infect Dis 207:204–206. doi: 10.1093/infdis/jis661 - DOI - PubMed
    1. Grabowski MK, Serwadda DM, Gray RH, Nakigozi G, Kigozi G, Kagaayi J, Ssekubugu R, Nalugoda F, Lessler J, Lutalo T, Galiwango RM, Makumbi F, Kong X, Kabatesi D, Alamo ST, Wiersma S, Sewankambo NK, Tobian AAR, Laeyendecker O, Quinn TC, Reynolds SJ, Wawer MJ, Chang LW, Rakai Health Sciences Program . 2017. HIV prevention efforts and incidence of HIV in Uganda. N Engl J Med 377:2154–2166. doi: 10.1056/NEJMoa1702150 - DOI - PMC - PubMed
    1. Karim SSA, Baxter C. 2019. HIV incidence rates in adolescent girls and young women in sub-Saharan Africa. Lancet Glob Health 7:e1470–e1471. doi: 10.1016/S2214-109X(19)30404-8 - DOI - PubMed
    1. Wirtz AL, Humes E, Althoff KN, Poteat TC, Radix A, Mayer KH, Schneider JS, Haw JS, Wawrzyniak AJ, Cannon CM, Stevenson M, Cooney EE, Adams D, Case J, Beyrer C, Laeyendecker O, Rodriguez AE, Reisner SL, American Cohort to Study HIV Acquisition Among Transgender Women (LITE) Study Group . 2023. HIV incidence and mortality in transgender women in the eastern and Southern USA: a multisite cohort study. Lancet HIV 10:e308–e319. doi: 10.1016/S2352-3018(23)00008-5 - DOI - PMC - PubMed

LinkOut - more resources