

Hearing Loss Prevalence, Years Lived With Disability, and Hearing Aid Use in the United States From 1990 to 2019: Findings From the Global Burden of Disease Study
- PMID: 37712826
- PMCID: PMC10718207
- DOI: 10.1097/AUD.0000000000001420
Hearing Loss Prevalence, Years Lived With Disability, and Hearing Aid Use in the United States From 1990 to 2019: Findings From the Global Burden of Disease Study
Abstract
Objectives: This article describes key data sources and methods used to estimate hearing loss in the United States, in the Global Burden of Disease study. Then, trends in hearing loss are described for 2019, including temporal trends from 1990 to 2019, changing prevalence over age, severity patterns, and utilization of hearing aids.
Design: We utilized population-representative surveys from the United States to estimate hearing loss prevalence for the Global Burden of Disease study. A key input data source in modeled estimates are the National Health and Nutrition Examination Surveys (NHANES), years 1988 to 2010. We ran hierarchical severity-specific models to estimate hearing loss prevalence. We then scaled severity-specific models to sum to total hearing impairment prevalence, adjusted estimates for hearing aid coverage, and split estimates by etiology and tinnitus status. We computed years lived with disability (YLDs), which quantifies the amount of health loss associated with a condition depending on severity and creates a common metric to compare the burden of disparate diseases. This was done by multiplying the prevalence of severity-specific hearing loss by corresponding disability weights, with additional weighting for tinnitus comorbidity.
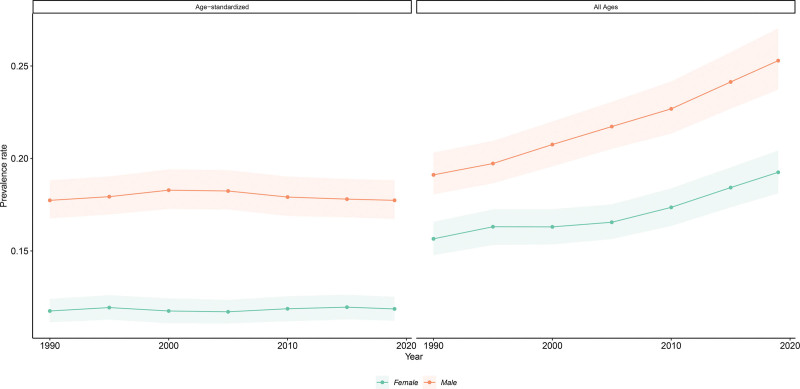
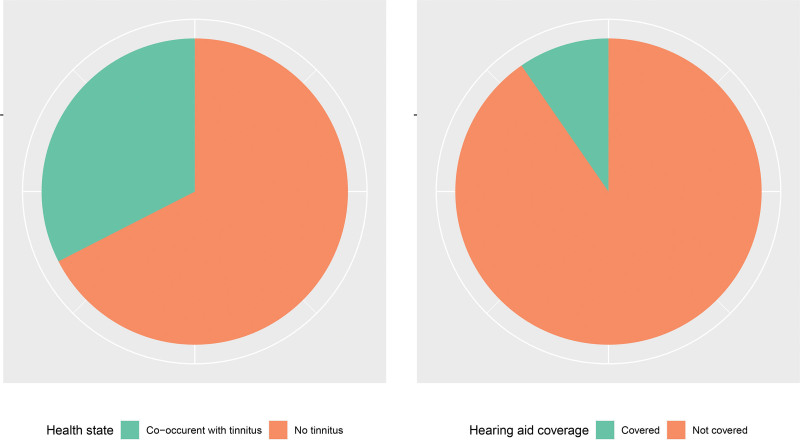
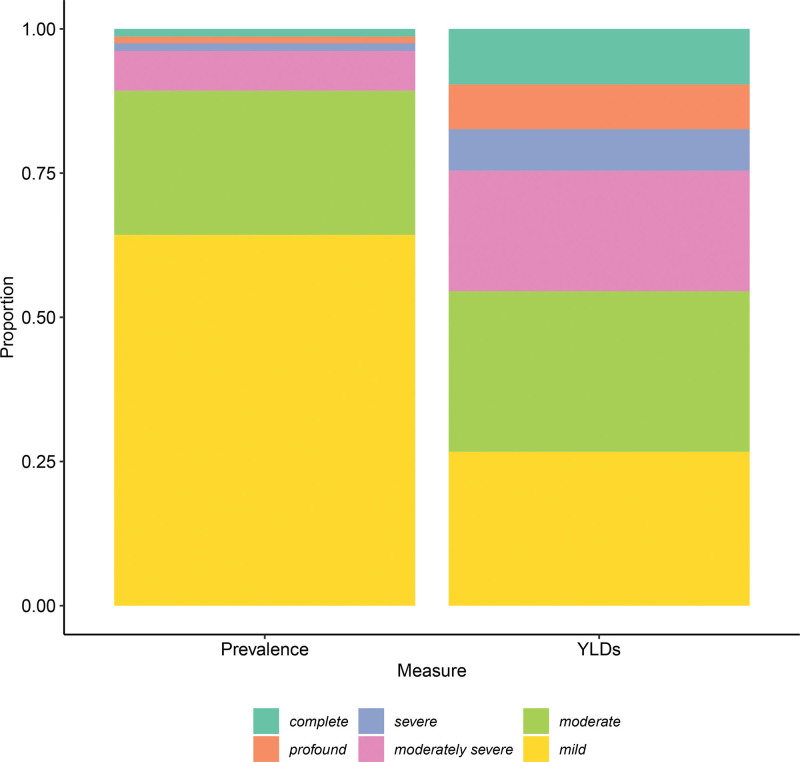
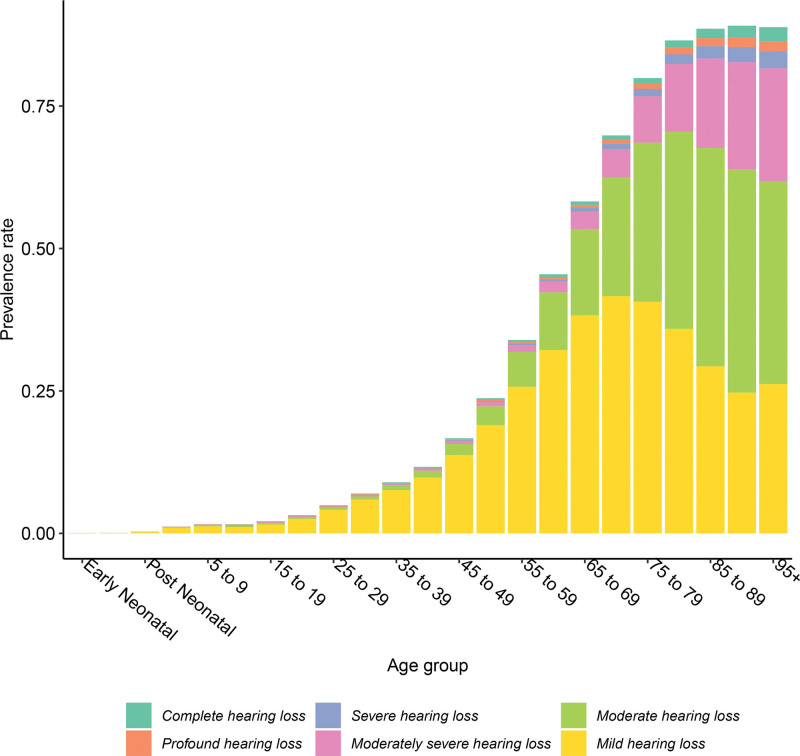
Results: An estimated 72.88 million (95% uncertainty interval (UI) 68.53 to 77.30) people in the United States had hearing loss in 2019, accounting for 22.2% (20.9 to 23.6) of the total population. Hearing loss was responsible for 2.24 million (1.56 to 3.11) YLDs (3.6% (2.8 to 4.7) of total US YLDs). Age-standardized prevalence was higher in males (17.7% [16.7 to 18.8]) compared with females (11.9%, [11.2 to 12.5]). While most cases of hearing loss were mild (64.3%, 95% UI 61.0 to 67.6), disability was concentrated in cases that were moderate or more severe. The all-age prevalence of hearing loss in the United States was 28.1% (25.7 to 30.8) higher in 2019 than in 1990, despite stable age-standardized prevalence. An estimated 9.7% (8.6 to 11.0) of individuals with mild to profound hearing loss utilized a hearing aid, while 32.5% (31.9 to 33.2) of individuals with hearing loss experienced tinnitus. Occupational noise exposure was responsible for 11.2% (10.2 to 12.4) of hearing loss YLDs.
Conclusions: Results indicate large burden of hearing loss in the United States, with an estimated 1 in 5 people experiencing this condition. While many cases of hearing loss in the United States were mild, growing prevalence, low usage of hearing aids, and aging populations indicate the rising impact of this condition in future years and the increasing importance of domestic access to hearing healthcare services. Large-scale audiometric surveys such as NHANES are needed to regularly assess hearing loss burden and access to healthcare, improving our understanding of who is impacted by hearing loss and what groups are most amenable to intervention.
Copyright © 2023 The Authors. Ear & Hearing is published on behalf of the American Auditory Society, by Wolters Kluwer Health, Inc.
Figures
References
-
- Fertility, Mortality, Migration, and Population Scenarios for 195 Countries and Territories from 2017 to 2100: A Forecasting Analysis for the Global Burden of Disease Study—The Lancet. 2020. Accessed October 29, 2020. https://doi.org/https://www.thelancet.com/journals/lancet/article/PIIS01.... - PMC - PubMed
-
- Hearing Loss Prevalence and Years Lived with Disability, 1990–2019: Findings from the Global Burden of Disease Study 2019—The Lancet. 2021. 2021. https://doi.org/https://www.thelancet.com/journals/lancet/article/PIIS01.... - PMC - PubMed
-
- Measuring the Global Burden of Disease | NEJM. 2013. Accessed August 8, 2022. https://doi.org/https://www.nejm.org/doi/full/10.1056/NEJMra1201534. - DOI - PubMed
-
- NHANES—About the National Health and Nutrition Examination Survey. 2020. January 8, 2020. https://doi.org/https://www.cdc.gov/nchs/nhanes/about_nhanes.htm.
-
- NHANES 2009-2010: Audiometry Data Documentation, Codebook, and Frequencies. n.d. Accessed March 24, 2023. https://doi.org/https://wwwn.cdc.gov/Nchs/Nhanes/2009-2010/AUX_F.htm.
Publication types
MeSH terms
Grants and funding
LinkOut - more resources
Full Text Sources
Medical
Miscellaneous
