. 2024 Feb;20(2):365-379.
doi: 10.1080/15548627.2023.2259215. Epub 2023 Sep 15.

PA2G4/EBP1 ubiquitination by PRKN/PARKIN promotes mitophagy protecting neuron death in cerebral ischemia

Affiliations

PA2G4/EBP1 ubiquitination by PRKN/PARKIN promotes mitophagy protecting neuron death in cerebral ischemia

Inwoo Hwang et al. Autophagy. 2024 Feb.

Abstract

Cerebral ischemia induces massive mitochondrial damage, leading to neuronal death. The elimination of damaged mitochondria via mitophagy is critical for neuroprotection. Here we show that the level of PA2G4/EBP1 (proliferation-associated 2G4) was notably increased early during transient middle cerebral artery occlusion and prevented neuronal death by eliciting cerebral ischemia-reperfusion (IR)-induced mitophagy. Neuron-specific knockout of Pa2g4 increased infarct volume and aggravated neuron loss with impaired mitophagy and was rescued by introduction of adeno-associated virus serotype 2 expressing PA2G4/EBP1. We determined that PA2G4/EBP1 is ubiquitinated on lysine 376 by PRKN/PARKIN on the damaged mitochondria and interacts with receptor protein SQSTM1/p62 for mitophagy induction. Thus, our study suggests that PA2G4/EBP1 ubiquitination following cerebral IR-injury promotes mitophagy induction, which may be implicated in neuroprotection.Abbreviations: AAV: adeno-associated virus; ACTB: actin beta; BNIP3L/NIX: BCL2 interacting protein 3 like; CA1: Cornu Ammonis 1; CASP3: caspase 3; CCCP: carbonyl cyanide m-chlorophenyl hydrazone; DMSO: dimethyl sulfoxide; PA2G4/EBP1: proliferation-associated 2G4; FUNDC1: FUN14 domain containing 1; IB: immunoblotting; ICC: immunocytochemistry; IHC: immunohistochemistry; IP: immunoprecipitation; MCAO: middle cerebral artery occlusion; MEF: mouse embryonic fibroblast; OGD: oxygen-glucose deprivation; PRKN/PARKIN: parkin RBR E3 ubiquitin protein ligase; PINK1: PTEN induced kinase 1; RBFOX3/NeuN: RNA binding fox-1 homolog 3; SQSTM1/p62: sequestosome 1; TIMM23: translocase of inner mitochondrial membrane 23; TOMM20: translocase of outer mitochondrial membrane 20; TUBB: tubulin beta class I; WT: wild-type.

Keywords: Ischemia; PA2G4/EBP1; PRKN/PARKIN; SQSTM1/p62; mitophagy.


Conflict of interest statement

No potential conflict of interest was reported by the author(s).

Figures

Figure 1.
Figure 1.
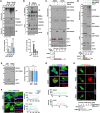
PA2G4 is upregulated and alleviates neuron loss after cerebral ischemic injury. (A) Expression of PA2G4 in the human brain (left) or pericyte cells (right). Gene expression profiles were obtained from human brains 3, 5, and 24 h after stroke (NCBI GEO NO. GSE58294) and human pericyte cells after oxygen–glucose deprivation (OGD) for 2 h (NCBI GEO NO. GSE109233). (B) RNA (left) and protein (right) expression levels of PA2G4 were analyzed by qRT-PCR and immunoblotting, respectively, from wild-type mouse hippocampi 0, 24, 48, and 72 h after a 45-min MCAO. The relative fold changes of RNA expression were quantified and are shown in bar graphs (bottom). (C) Protein expression of PA2G4 was measured from the DG, CA1, and CA3 of the hippocampus by immunoblotting (top). The intensity of PA2G4 expression was quantified (bottom). (D) Mouse brains were isolated at the indicated time after MCAO, and immunohistochemistry was performed using anti- PA2G4 (red) and MAP2 (green) antibodies. Images showing the CA1 region were used to quantify the intensity of PA2G4 staining. The corresponding data are displayed as a bar graph (right panel). Scale bar: 50 μm. All data are presented as means ± standard errors of the mean (SEMs); *p < 0.05, **p < 0.005, ***p < 0.001. Student’s two-tailed unpaired t-test (A, C) and one-way analysis of variance (ANOVA) followed by Bonferroni’s post hoc test (A, B, D) were performed.
Figure 2.
Figure 2.
Pa2g4 deficiency exacerbates IR brain injury. (A,B) Diagram of the experimental procedures for inducing ischemic stroke in mice. pa2g4-CKO mice and wild-type mice (control) were subjected to 30 min ischemia followed by 24 h of MCAO or sham operation (sham). Brain tissues were subjected to Nissl staining. The number of cells in the CA1 region was quantified and is shown as a bar graph (right side). Scale bars: 200 μm in hippocampus and 50 μm in CA1. (C) Representative images illustrating the histological validation of neuronal cell loss using immunohistochemistry to detect PA2G4 (red) and RBFOX3 (green, marker for neuron) after 24 h reperfusion. White boxes are magnifications. Scale bars: 50 μm for CA1 pictures and 10 μm for the magnified pictures. (D) Representative confocal images (left) and quantification (right) of neuronal death in the CA1 region based on TUNEL (green) and anti-active CASP3 (red) staining after MCAO. The number of TUNEL-positive cells and neuronal cell death data are shown. Scale bars: 50 μm. (E) Infarct volume in pa2g4-CKO and control mice was observed using T2-weighted MRI. The infarct volume was quantified and displayed as a bar graph (right). (F) Graph showing the survival percentage of pa2g4-CKO or control mice after MCAO and sham operation. The mortality was 95.3% at 1 day and significantly decreased at 5 days (48.7%) after MCAO in pa2g4-CKO mice. The following number of mice was sham-operated: n = 9 control and n = 12 pa2g4-CKO mice or subjected to MCAO: n = 23 control and n = 28 pa2g4-CKO mice. (G) Using a 10-μL Hamilton syringe, AAV2-MOCK or AAV2-PA2G4 were injected into the left CA1 of mice 5 days before MCAO. Viral expression was verified using a fluorescence microscope. Scale bar: 500 μm. (H) Nissl staining of AAV-injected mouse brains after MCAO. The size of the infarct area was measured using ImageJ and is displayed on the bottom. Scale bar: 1 mm. (I) Representative images of GFP and MAP2 (red) staining in ischemic-damaged brains injected with AAV-MOCK or AAV-PA2G4 used to assess neuronal cell death. The intensity of the MAP2 staining was quantified (right panel, n = 6 per group). Scale bar: 500 μm. (J) Representative confocal images (left) and quantification (right) of neuronal death in the CA1 region based on TUNEL (red) and GFP signals in AAV-injected mouse brains after MCAO. TUNEL+ indicates the total number of neuronal cell death. Scale bar: 50 μm. All data are presented as means ± SEMs; *p < 0.05, **p < 0.005, ***p < 0.001. Student’s two-tailed unpaired t-test (D, E, H, J) and two-way ANOVA with Tukey’s post hoc test (B, F, I) were performed.
Figure 3.
Figure 3.
PA2G4 is required in IR-induced mitophagy. (A) Ischemia-damaged hippocampi were separated into nuclear, cytosolic, and mitochondrial fractions. The location of PA2G4 was analyzed using immunoblotting with anti-PA2G4, histone H3 (nucleus), TUBB (cytosol), or TOMM20 (mitochondria) antibodies. A quantitative analysis was performed (right). (B) Primary hippocampal neurons at DIV 7 were treated with CCCP (mitophagy inducer) for 3h and stained using anti-PA2G4 (red), MAP2 (green, left), or TOMM20 (green, right) antibodies. The colocalization between PA2G4 and TOMM20 was analyzed and displayed as a heatmap and bar graph (right). Scale bar: 20 μm. (C) SH-SY5Y cells were treated with CCCP and fixed with 4% PFA after 0, 3, and 6 h. The cells were stained with anti-PA2G4 (red) and TOMM20 (green) antibodies. White boxes are magnifications. The fluorescence intensity of immunolabeled PA2G4/EBP1 and TOMM20 indicated by white arrows is shown as a graph (right). Scale bar: 20 or 5 μm. (D) Primary hippocampal neurons from Nes-Cre; pa2g4 (F/F) and pa2g4(F/F) were treated with CCCP. The neurons were stained with mitophagy dye (red), anti-PA2G4 (green) and MAP2 antibodies. The quantification of mitophagy is shown (top). White boxes are magnifications. Scale bar: 10 μm. (E) In situ Proximity Ligation Assay (PLA) was conducted using anti-TOMM20 and LC3 antibodies. Confocal images of TOMM20–LC3 PLA staining (red) after induced ischemic damage in CA1 are shown. Nuclei were stained using DAPI (blue). The quantification of PLA puncta is shown as a bar graph (bottom). White boxes are magnifications. Scale bar: 50 μm. (F) Mitophagy and apoptosis were analyzed by immunoblotting in the mouse brain after occlusion for 30 min and reperfusion for 24 h using the indicated antibodies. The intensity of PA2G4 and BAX signals was quantified (right panel). (G) Diagram illustrating the experimental time course (left top panel). Hippocampal slice cultures from ischemic-damaged mouse brains were stained using a mitophagy detection kit at DIV 1. Slices were fixed at DIV 3 and stained using an anti-RBFOX3 antibody (green). Mitophagy staining intensity was quantified (left bottom, n = 12 fields per condition). White boxes are magnifications of the DG and CA1 region. Scale bar: 500 μm. All data are presented as means ± SEMs; *p < 0.05, **p < 0.005, ***p < 0.001. Student’s two-tailed unpaired t-test (B, D, E, G), one-way ANOVA followed by Bonferroni’s post hoc test (F), and two-way ANOVA with Tukey’s post hoc test (A) were performed.
Figure 4.
Figure 4.
PA2G4 is a substrate of PRKN in mitophagy induction. (A) pa2g4-CKO and control mice were subjected to 30 min ischemia followed by 24 h of reperfusion or to a sham operation. Mitochondria were isolated from the hippocampus using a mitochondria fractionation kit (Abcam, #ab110168). Mitochondria ubiquitination was measured by immunoblotting using an anti-ubiquitin (UB) antibody. (B) Brain lysates from sham-operated mice or mice subjected to 30 min ischemia followed by 24, 48, and 72 h of reperfusion were used for immunoprecipitation with an anti-PA2G4 antibody. The ubiquitination of PA2G4 was measured by immunoblotting using an anti-UB antibody. (C) SH-SY5Ycells transfected with GFP-PRKN and/or GST-PA2G4 were treated with CCCP for 3 h. Afterward, a GST pull-down assay was conducted. The binding affinity between GST-PA2G4 and GFP-PRKN with or without CCCP was measured by western blotting. (D) GST pull-down assays were performed on lysates of cells transfected with GST-PA2G4 and/or GFP-together with HA-UB. Ubiquitination of PA2G4 was measured by immunoblotting using an anti-HA antibody. (E) HT-22 cells were transfected with gradient GFP-PRKN. The protein stability of PA2G4 was measured by IB (left) and quantified (right). (F) HT-22 cells were treated with DMSO or CCCP for 3 h and stained with anti-PA2G4 (green), UB (red), and PRKN (blue) antibodies. White boxes are magnifications. The fluorescence intensity of PA2G4, PRKN, and UB signals indicated by orange arrows was quantified (right). Scale bar: 20 μm. (G) HT-22 cells were treated with DMSO or CCCP for 3 h and stained with anti-PA2G4 (green), LC3 (red), and TOMM20 (blue) antibodies. The white boxes are magnifications. The fluorescence intensity of PA2G4, LC3, and TOMM20 signals indicated by orange arrows was quantified (bottom). Scale bar: 20 μm. (H) MEFs from Pa2g4(+/+) and pa2g4(−/−) mice were transfected with GFP-MOCK or GFP-PRKN and treated with CCCP for 3 h. Mitophagy was measured using a mitophagy detection kit (red). White boxes are magnifications. The intensity of the mitophagy signal was quantified and is shown as a bar graph (bottom). Scale bar: 10 μm. All data are presented as means ± SEMs; *p < 0.05, **p < 0.005, ***p < 0.001. A two-way ANOVA followed by Tukey’s post hoc test (G) was performed.
Figure 5.
Figure 5.
PRKN-mediated ubiquitination of the K376 residue on PA2G4 contributes to the recruitment of the mitophagy adaptor protein SQSTM1. (A) Flag-MOCK and Flag-WT PA2G4, K373A, and K376A were transfected into HT-22 cells and incubated with CCCP and MG132. Immunoprecipitation of the cell lysates was performed using an anti-Flag antibody to detect ubiquitination of PA2G4 wild-type and mutants. (B) Purified GST-WT PA2G4 and K376A were incubated with E1, E2-UbcH5a, active-PRKN, and UB at 37°C for 1 h. Purified GST, WT PA2G4, and PA2G4K376A were visualized using Coomassie staining and SDS-PAGE (top). PA2G4 ubiquitination was analyzed by immunoblotting using an anti-PA2G4 antibody (bottom). (C) Transfected HT-22 cells were treated with CCCP and stained with an anti-TOMM20 antibody (green) and mitophagy detection kit (red). White boxes are magnifications. The mitophagy signal intensity was quantified. Scale bar: 20 μm. (D) HT-22 cells were transfected with GST-PA2G4 with or without siRNA targeting Prkn (si-Prkn) and incubated with CCCP and MG132. After cell lysis, ubiquitination of PA2G4 was analyzed using immunoblotting with anti-K63 and K48 antibodies. (E) PLA was conducted using anti-PA2G4 and SQSTM1 antibodies. Confocal images of PA2G4–SQSTM1 PLA staining (red) after induced ischemic damage in CA1 are shown. Nuclei were stained with DAPI (blue). The quantification of PLA puncta is shown as a bar graph. White boxes are magnifications. Scale bar: 200 μm or 50 μm for the magnifications. (F) Representative immunohistochemistry pictures of ischemic-damaged hippocampus CA1 regions from pa2g4-CKO and control mice. Sections were stained with anti-PA2G4 (red) and SQSTM1 (green) antibodies. The fluorescence intensity of PA2G4 and SQSTM1 signals indicated by the white arrows is shown (top). The white boxes are magnifications. Scale bar: 20 or 5 μm. (G) PLA staining of SQSTM1 and TOMM20 in ischemic-damaged brain tissues. Nuclei were stained using DAPI (blue). The quantification of PLA puncta is shown as a bar graph. White boxes are magnifications. Scale bar: 200 μm for CA1 and 50 μm for the magnifications. (H) Flag-WT PA2G4 or K376A were transfected into HT-22 cells, and cells were incubated with CCCP. Binding affinity between PA2G4 and SQSTM1 was measured using western blotting. (I) Flag-WT PA2G4 or K376A and/or si-Prkn were transfected into cells and incubated with CCCP and MG132. Cell lysates were subjected to immunoprecipitation, and the interaction affinity between PA2G4 and SQSTM1 was analyzed using immunoblotting. All data are presented as means ± SEMs; *p < 0.05, **p < 0.005, ***p < 0.001. Student’s two-tailed unpaired t-test (E, G) and one-way ANOVA with Bonferroni’s post hoc test (D) were performed.
Figure 6.
Figure 6.
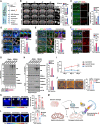
PA2G4K376 ubiquitination is essential for mitophagy induction and neural protection upon IR injury. (A) Diagram of the experimental procedures used for inducing an ischemic stroke in mice. (B) AAV-MOCK or AAV-WT PA2G4 or K376A were injected into the CA1 region of the hippocampus. The infarct volume was measured after 45 min MCAO using T2-weighted MRI. The red line indicates the boundary of the infarct regions (left). The infarct volume was quantified (right). (C) Representative confocal images (left) and quantification (right) of neuronal death in the CA1 region based on TUNEL (red) staining of AAV-injected mouse brains after MCAO. TUNEL+ indicates the total number of dead cells and neuronal cell death data are presented. Scale bar: 200 μm. (D, E) Representative immunohistochemistry of ischemic-damaged hippocampus CA1 from pa2g4-CKO and control mice. Sections were stained with antibodies specific from SQSTM1 (D, red) or LC3 (E, red) and TOMM20 (blue). White boxes are magnifications. The colocalization was analyzed and displayed as a heatmap and bar graph. Scale bar: 20 μm. (F) AAV-injected mouse brains after stroke were stained with anti-PA2G4 and SQSTM1 antibodies for PLA (red). Nuclei were stained using DAPI (blue). The quantification of PLA puncta is shown as a bar graph. White boxes are magnifications. Scale bar: 200 μm or 50 μm for magnifications. (G) Ubiquitination of mitochondria isolated from AAV-injected brains after MCAO was measured by western blotting using an anti-UB antibody. (H) Brain lysates of AAV-injected MCAO brains were subjected to immunoprecipitation using an anti-PA2G4 antibody. The ubiquitination of PA2G4 was measured by immunoblotting using an anti-UB antibody. (I) Locomotion of AAV-injected mice after MCAO analyzed using the accelerated rotarod test; n = 5 for MOCK and WT PA2G4 and n = 9 for PA2G4K376A. (J) Representative maps showing the total distance traveled by AAV-injected mice after MCAO during 10 min in the open-field test (n = 5 for MOCK and WT PA2G4 and n = 8 for PA2G4K376A). (K) Representative heatmaps illustrating the time spent in different locations during the novel object recognition test performed for 10 min. O1, Object 1 or familiar object; N, novel object; n = 5 for MOCK and WT PA2G4 and n = 9 for PA2G4K376A. (L) Representative heatmaps of the mice performance in the Y-maze test. Visiting of arms in the order 1-2-3 is an example of an alternation (AAR); n = 5 for MOCK and WT PA2G4 and n = 9 for PA2G4K376A. (M) Schematic model of PA2G4-PRKN-mediated mitophagy. All data are presented as means ± SEMs; ns > 0.05, *p < 0.05, **p < 0.005, ***p < 0.001. One-way ANOVA with Bonferroni’s post hoc test (B–F, K, M) and two-way ANOVA followed by Tukey’s post hoc test (L) were performed.

References

    1. Kirino T, Sano K.. Fine structural nature of delayed neuronal death following ischemia in the gerbil hippocampus. Acta Neuropathol. 1984;62:209–18. - PubMed
    1. Vosler PS, Gao Y, Brennan CS, et al. Ischemia-induced calpain activation causes eukaryotic (translation) initiation factor 4G1 (eIF4GI) degradation, protein synthesis inhibition, and neuronal death. Proc Natl Acad Sci U S A. 2011;108:18102–7. - PMC - PubMed
    1. Tanaka K, Ludwig LM, Krolikowski JG, et al. Isoflurane produces delayed preconditioning against myocardial ischemia and reperfusion injury: role of cyclooxygenase-2. Anesthesiology. 2004;100:525–31. - PubMed
    1. Livingston MJ, Wang J, Zhou J, et al. Clearance of damaged mitochondria via mitophagy is important to the protective effect of ischemic preconditioning in kidneys. Autophagy 2019;15:2142–62. - PMC - PubMed
    1. Yuan Y, Zheng Y, Zhang X, et al. BNIP3L/NIX-mediated mitophagy protects against ischemic brain injury independent of PARK2. Autophagy 2017;13:1754–66. - PMC - PubMed

Publication types

LinkOut - more resources