. 2023 Sep 15:12:RP88521.
doi: 10.7554/eLife.88521.

BATF relieves hepatic steatosis by inhibiting PD1 and promoting energy metabolism

Affiliations

BATF relieves hepatic steatosis by inhibiting PD1 and promoting energy metabolism

Zhiwang Zhang et al. Elife. .

Abstract

The rising prevalence of nonalcoholic fatty liver disease (NAFLD) has become a global health threat that needs to be addressed urgently. Basic leucine zipper ATF-like transcription factor (BATF) is commonly thought to be involved in immunity, but its effect on lipid metabolism is not clear. Here, we investigated the function of BATF in hepatic lipid metabolism. BATF alleviated high-fat diet (HFD)-induced hepatic steatosis and inhibited elevated programmed cell death protein (PD)1 expression induced by HFD. A mechanistic study confirmed that BATF regulated fat accumulation by inhibiting PD1 expression and promoting energy metabolism. PD1 antibodies alleviated hepatic lipid deposition. In conclusion, we identified the regulatory role of BATF in hepatic lipid metabolism and that PD1 is a target for alleviation of NAFLD. This study provides new insights into the relationship between BATF, PD1, and NAFLD.

Keywords: BATF; NAFLD; PD1; cell biology; immune; mouse.


Conflict of interest statement

ZZ, QL, TP, LY, ZL, SS, SL, MH, YL, TD, YL, LZ No competing interests declared

Figures

Figure 1.
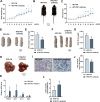
Figure 1.. Effects of BATF on lipid deposition in hepatocytes under high-fat diet.
(A) The mice and liver Oil red O staining in normal diet group (CN) and high-fat diet group (HFD). Bar, 1 cm (left panel) and 100 μm (right panel). (B) The protein expression of BATF in liver tissues (n=4). (C) The mRNA expression of BATF in liver tissues (n=5). (D) Spearman correlation Analysis between TPM of BATF and NAFLD Patients with Different Degrees (n=4–18). (E) Triglyceride content (n=5). (F) Detection of BATF overexpression in HepG2 (n=2). (G) Oil red O staining of HepG2 cells with OA/PA when BATF was overexpressed and (H) triglyceride content (n=4). (I) Oil red O staining of L02 cells with OA/PA when BATF was overexpressed and (J) triglyceride content (n=3). (K) Oil red O staining of primary hepatocytes with OA/PA when BATF was overexpressed and (L) triglyceride content (n=3). The data are expressed as mean ± SD. *p<0.05, **p<0.01.
Figure 1—figure supplement 1.
Figure 1—figure supplement 1.. Effects of BATF on lipid levels in hepatocytes.
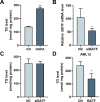
(A) Triglyceride content with OA/PA (n=3). (B) BATF mRNA levels. NC, negative control group; siBATF, BATF inhibition group, (n=3). (C) Triglyceride content with OA/PA treatment, (n=5). (D) Triglyceride content with OA/PA when BATF was overexpressed, (n=3). The data are expressed as mean ± SD. *p<0.05, **p<0.01.
Figure 2.
Figure 2.. Effects of BATF on hepatic fat deposition in mice.
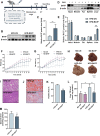
(A) Experimental designs illustration of mice. (B) Expression of BATF protein in liver (n=4). (C) Densitometric quantification of the blotting. (D) Expression of BATF protein in various tissues of HFD-CN mice HBAAV/8-ZsGreen, WB in lane1, 3, 5, 7, 9 and HFD-BATF mice HBAAV2/8-CMV-m-BATF-3×flag-ZsGreen, WB in lane 2, 4, 6, 8, 10. (E) Densitometric quantification of the blotting. (F) Mice bodyweight (n=8–10). (G) Mice fat ratio (n=8–10). (H) Mice liver. Bar, 1 cm. (I) HE staining of mice liver sections. Bar, 100 μm. (J) (K) Oil red O staining of mice liver sections and quantitative analysis. Bar, 100 μm (n=3). (L) Liver triglyceride levels (n=8–10). (M) Liver total Glycerin levels (n=8–10).
Figure 2—figure supplement 1.
Figure 2—figure supplement 1.. The effect of BATF on metabolic indicators in mice.
(A) Average daily feed intake (n=7). (B) Liver total cholesterol levels (n=8–10). (C) Fasting blood glucose level in mice (n=8–10). (D) Liver glucose oxidase activity. (E) Glucose tolerance test and (F) quantitative analysis (n=5–6). The data are expressed as mean ± SD. *p<0.05, **p<0.01.
Figure 3.
Figure 3.. BATF boosts lipid breakdown and energy metabolism in mice livers.
(A) ALT activity in mice liver (n=8). (B) AST activity in mice liver (n=7). (C) The Fasn, Srebp1, Gpam, Acc1 mRNA expression level in mice liver (n=6–8). (D) The AMPKα1, Aco, Acox1, Bcl2, Cpt1, Hsl, Acc2, Atgl mRNA expression level in mice liver (n=6–7). (E) SCAD activity in HepG2 cells with OA/PA treatment (n=4). (F) ATP content in HepG2 cells with OA/PA treatment (n=4). (G) Oxygen consumption rate (OCR). (H) Basal respiration, maximal respiration, proton leak and coupling efficiency. The data are expressed as mean ± SD. *p<0.05, **p<0.01.
Figure 4.
Figure 4.. BATF alleviates HFD-induced adipocyte hypertrophy in mice.
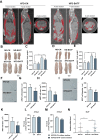
(A) CT images of fat axial view. (B) eWAT of mice. Bar, 1 cm. (C) eWAT weight / bodyweight (n=9–10). (D) iWAT of mice. Bar, 1 cm. (E) eWAT weight / bodyweight (n=9–10). (F) HE staining of eWAT, (G) adipocyte diameter and (H) cell area. Bar, 200 μm. (I) HE staining of iWAT, (J) adipocyte diameter and (K) cell area. Bar, 200 μm. (L) Triglyceride content of undifferentiated 3T3L1 cells (n=5). (M) Triglyceride content of differentiated 3T3L1 cells (n=3–4). (N) The mRNA expression of IL27 in liver tissues (n=5). The data are expressed as mean ± SD. *p<0.05, **p<0.01.
Figure 5.
Figure 5.. BATF alleviates hepatocyte lipid accumulation by inhibiting PD1.
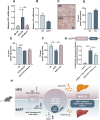
(A) The mRNA expression of PD1 in liver tissues (n=3). (B) The mRNA expression of PD1 in HepG2 cells (n=3). (C) Oil red O staining of HepG2 cells, Bar, 20 μm, (n=3). (D), (E), (F) Triglyceride content with OA/PA (n≥3). (G) Dual luciferase assay on Hepa1-6 cells cotransfected with firefly luciferase constructs containing the PD1 promoter, Renilla luciferase vector pRL-TK and pcDNA3.1(-) or pcDNA3.1(-)-BATF, (n≥3). (H) The Mechanism diagram of BATF alleviates hepatocyte lipid accumulation by PD1. The data are expressed as mean ± SD. *p<0.05, **p<0.01.
Figure 6.
Figure 6.. Effects of PD1 antibody on liver lipid metabolism in HFD mice.
(A) Mice bodyweight (n≥5). (B) The mice were injected with IgG or PD1 antibody under HFD (n≥5). (C) Mice fat ratio (n≥5). (D) eWAT of mice. Bar, 1 cm. (E) eWAT weight / bodyweight (n≥5). (F) iWAT of mice. Bar, 1 cm. (G) eWAT weight / bodyweight (n≥5). (H) The liver of mice. (I) HE staining of mice liver sections. Bar, 100 μm. (J) Liver triglyceride (TG) levels. (K) The AMPKα1, Cpt1, Acca, Atgl mRNA expression level in mice liver (n≥5). (L) SCAD activity in liver of mice (n=5). The data are expressed as mean ± SD. *p<0.05, **p<0.01.
Author response image 1.
Author response image 1.. The expression level of BATF in clumster of cells in the liver.
Author response image 2.
Author response image 2.. The images of the heart and spleen of mice.

Update of

  • doi: 10.1101/2023.04.18.537352
  • doi: 10.7554/eLife.88521.1
  • doi: 10.7554/eLife.88521.2

References

    1. Cotter TG, Rinella M. Nonalcoholic Fatty Liver Disease 2020: the state of the disease. Gastroenterology. 2020;158:1851–1864. doi: 10.1053/j.gastro.2020.01.052. - DOI - PubMed
    1. Eberlé D, Hegarty B, Bossard P, Ferré P, Foufelle F. SREBP transcription factors: master regulators of lipid homeostasis. Biochimie. 2004;86:839–848. doi: 10.1016/j.biochi.2004.09.018. - DOI - PubMed
    1. Freeman GJ, Long AJ, Iwai Y, Bourque K, Chernova T, Nishimura H, Fitz LJ, Malenkovich N, Okazaki T, Byrne MC, Horton HF, Fouser L, Carter L, Ling V, Bowman MR, Carreno BM, Collins M, Wood CR, Honjo T. Engagement of the PD-1 immunoinhibitory receptor by a novel B7 family member leads to negative regulation of lymphocyte activation. The Journal of Experimental Medicine. 2000;192:1027–1034. doi: 10.1084/jem.192.7.1027. - DOI - PMC - PubMed
    1. Gross B, Pawlak M, Lefebvre P, Staels B. PPARs in obesity-induced T2DM, dyslipidaemia and NAFLD. Nature Reviews. Endocrinology. 2017;13:36–49. doi: 10.1038/nrendo.2016.135. - DOI - PubMed
    1. Hoang SA, Nguyen LQ, Nguyen NH, Tran CQ, Nguyen DV, Le NT, Ha CV, Vu QN, Phan CM. Metal nanoparticles as effective promotors for Maize production. Scientific Reports. 2019;9:13925. doi: 10.1038/s41598-019-50265-2. - DOI - PMC - PubMed

Publication types

Substances

Associated data