

Guidelines for Evaluating the Comparability of Down-Sampled GWAS Summary Statistics
- PMID: 37713023
- PMCID: PMC10584908
- DOI: 10.1007/s10519-023-10152-z
Guidelines for Evaluating the Comparability of Down-Sampled GWAS Summary Statistics
Abstract
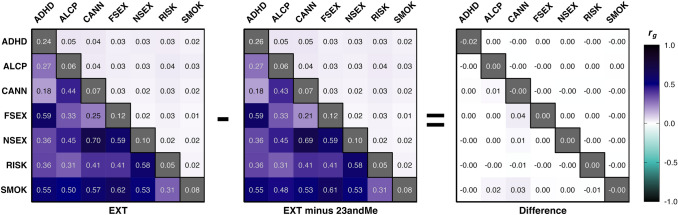
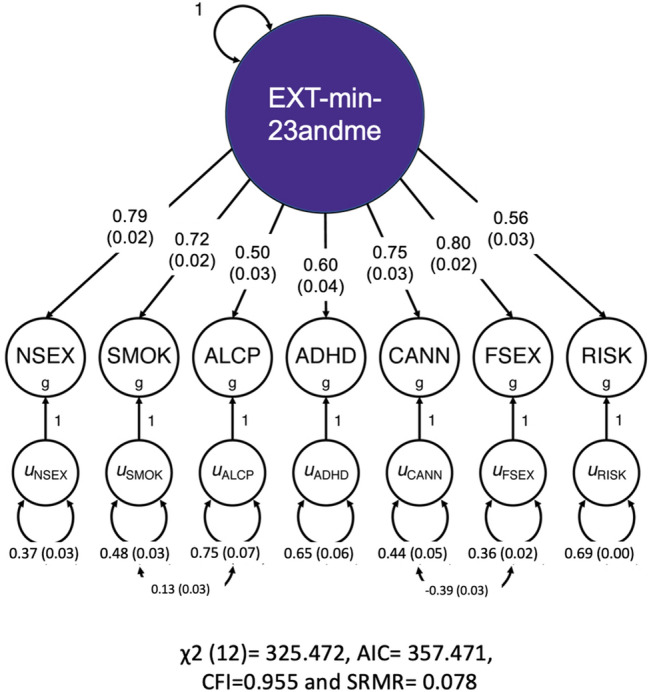
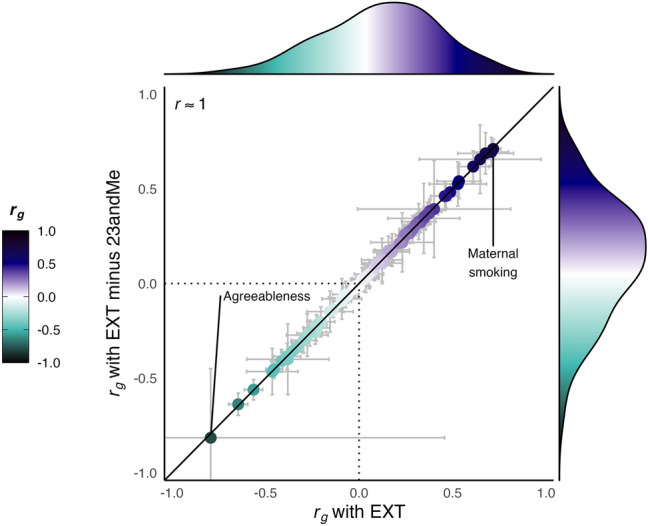
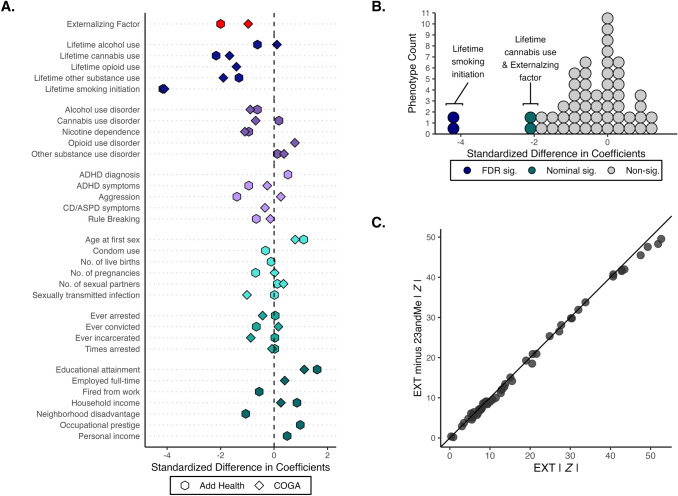
Proprietary genetic datasets are valuable for boosting the statistical power of genome-wide association studies (GWASs), but their use can restrict investigators from publicly sharing the resulting summary statistics. Although researchers can resort to sharing down-sampled versions that exclude restricted data, down-sampling reduces power and might change the genetic etiology of the phenotype being studied. These problems are further complicated when using multivariate GWAS methods, such as genomic structural equation modeling (Genomic SEM), that model genetic correlations across multiple traits. Here, we propose a systematic approach to assess the comparability of GWAS summary statistics that include versus exclude restricted data. Illustrating this approach with a multivariate GWAS of an externalizing factor, we assessed the impact of down-sampling on (1) the strength of the genetic signal in univariate GWASs, (2) the factor loadings and model fit in multivariate Genomic SEM, (3) the strength of the genetic signal at the factor level, (4) insights from gene-property analyses, (5) the pattern of genetic correlations with other traits, and (6) polygenic score analyses in independent samples. For the externalizing GWAS, although down-sampling resulted in a loss of genetic signal and fewer genome-wide significant loci; the factor loadings and model fit, gene-property analyses, genetic correlations, and polygenic score analyses were found robust. Given the importance of data sharing for the advancement of open science, we recommend that investigators who generate and share down-sampled summary statistics report these analyses as accompanying documentation to support other researchers' use of the summary statistics.
Keywords: Data removal; Down-sample; Genome-wide association study; Genomic SEM; Genomics; Leave-one-out; Meta-analysis; Summary statistics.
© 2023. The Author(s).
Conflict of interest statement
Camille M. Williams, Holly Poore, Peter T. Tanksley, Hyeokmoon Kweon, Natasia S. Courchesne-Krak, Diego Londono-Correa, Travis T. Mallard, Peter Barr, Philipp D. Koellinger, Irwin D. Waldman, Sandra Sanchez-Roige, K. Paige Harden, Abraham A Palmer, Danielle M. Dick and Richard Karlsson Linnér declare that they have no conflict of interest.
Figures
Update of
-
Guidelines for Evaluating the Comparability of Down-Sampled GWAS Summary Statistics.bioRxiv [Preprint]. 2023 Mar 24:2023.03.21.533641. doi: 10.1101/2023.03.21.533641. bioRxiv. 2023. Update in: Behav Genet. 2023 Nov;53(5-6):404-415. doi: 10.1007/s10519-023-10152-z. PMID: 36993611 Free PMC article. Updated. Preprint.
References
-
- Allen Institute for Brain Science. (2022). BrainSpan atlas of the developing human brain. http://www.brainspan.org/. Accessed 22 Dec 2022
-
- Becker J, Burik CAP, Goldman G, Wang N, Jayashankar H, Bennett M, Belsky DW, Karlsson Linnér R, Ahlskog R, Kleinman A, Hinds DA, Caspi A, Corcoran DL, Moffitt TE, Poulton R, Sugden K, Williams BS, Harris KM, Steptoe A, et al. Resource profile and user guide of the polygenic index repository. Nat Hum Behaviour. 2021;5(12):12. doi: 10.1038/s41562-021-01119-3. - DOI - PMC - PubMed
-
- Bucholz KK, McCutcheon VV, Agrawal A, Dick DM, Hesselbrock VM, Kramer JR, Kuperman S, Nurnberger JI, Salvatore JE, Schuckit MA, Bierut LJ, Foroud TM, Chan G, Hesselbrock M, Meyers JL, Edenberg HJ, Porjesz B. Comparison of parent, peer, psychiatric, and cannabis use influences across stages of offspring alcohol involvement: evidence from the COGA prospective study. Alcohol Clin Exp Res. 2017;41(2):359–368. doi: 10.1111/acer.13293. - DOI - PMC - PubMed
Publication types
MeSH terms
Grants and funding
LinkOut - more resources
Full Text Sources
