Multicenter Study
. 2023 Sep;18(5):667-684.
doi: 10.1007/s11523-023-00989-z. Epub 2023 Sep 15.

Population Pharmacokinetics and Exposure-Response with Teclistamab in Patients With Relapsed/Refractory Multiple Myeloma: Results From MajesTEC-1

Affiliations
Multicenter Study

Population Pharmacokinetics and Exposure-Response with Teclistamab in Patients With Relapsed/Refractory Multiple Myeloma: Results From MajesTEC-1

Xin Miao et al. Target Oncol. 2023 Sep.

Abstract

Background: Teclistamab, a B-cell maturation antigen × CD3 bispecific antibody, is approved in patients with relapsed/refractory multiple myeloma (RRMM) who have previously received an immunomodulatory agent, a proteasome inhibitor, and an anti-CD38 antibody.

Objective: We report the population pharmacokinetics of teclistamab administered intravenously and subcutaneously (SC) and exposure-response relationships from the phase I/II, first-in-human, open-label, multicenter MajesTEC-1 study.

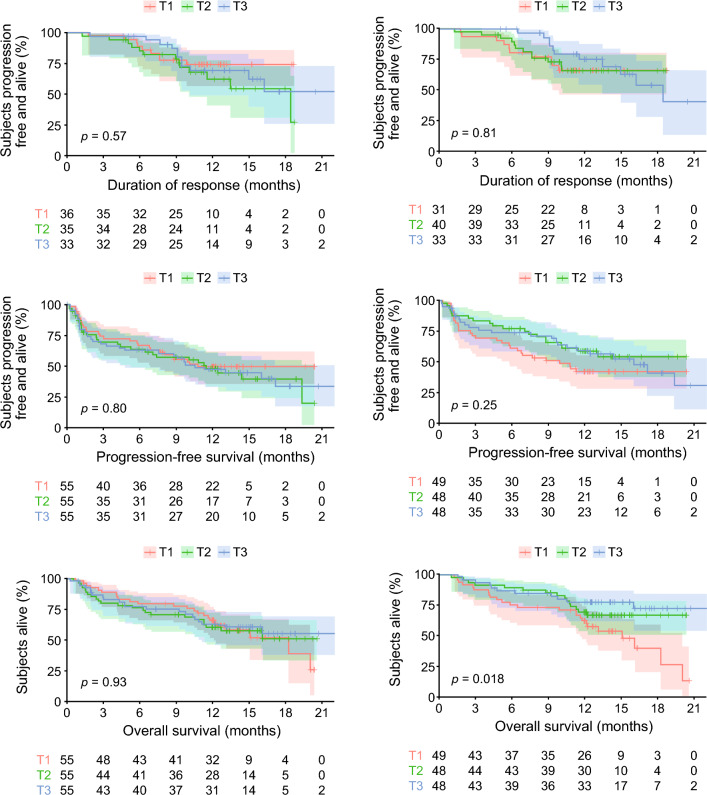
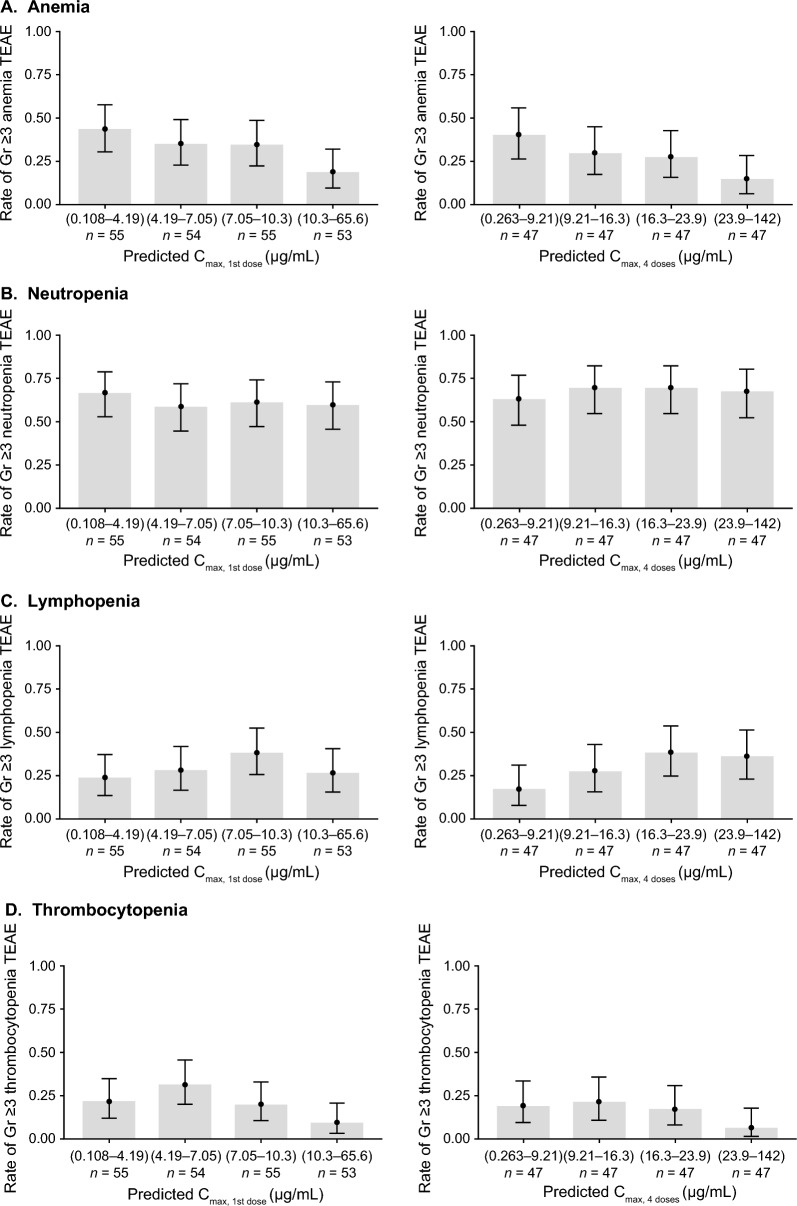
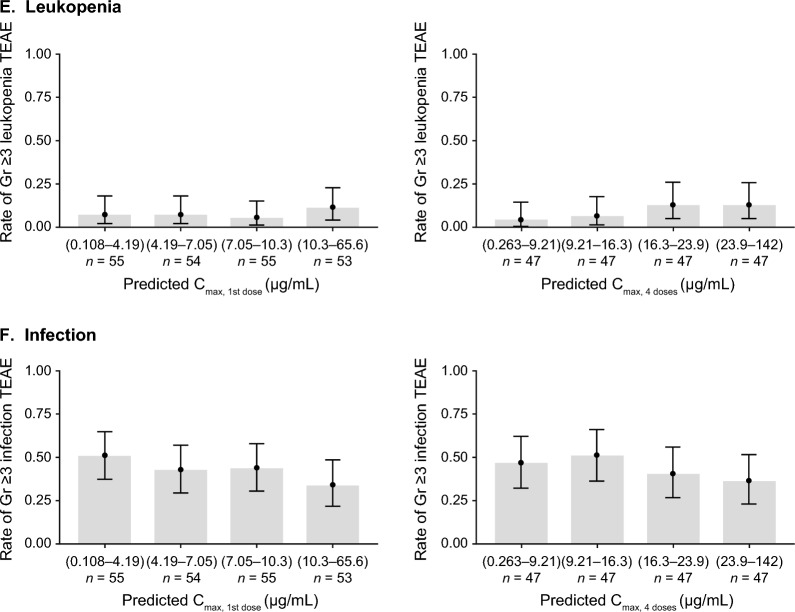
Methods: Phase I of MajesTEC-1 consisted of dose escalation and expansion at the recommended phase II dose (RP2D; 1.5 mg/kg SC weekly, preceded by step-up doses of 0.06 and 0.3 mg/kg); phase II investigated the efficacy of teclistamab RP2D in patients with RRMM. Population pharmacokinetics and the impact of covariates on teclistamab systemic exposure were assessed using a 2-compartment model with first-order absorption for SC and parallel time-independent and time-dependent elimination pathways. Exposure-response analyses were conducted, including overall response rate (ORR), duration of response (DoR), progression-free survival (PFS), overall survival (OS), and the incidence of grade ≥ 3 anemia, neutropenia, lymphopenia, leukopenia, thrombocytopenia, and infection.

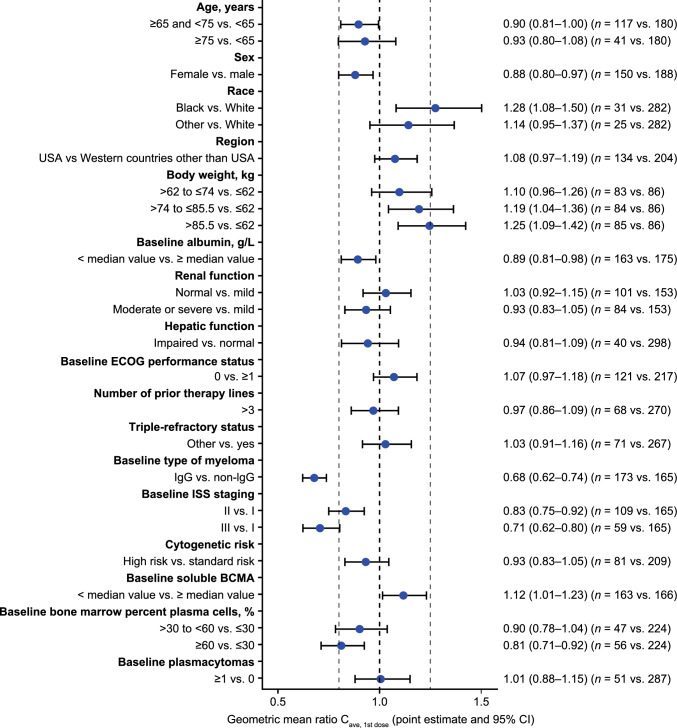
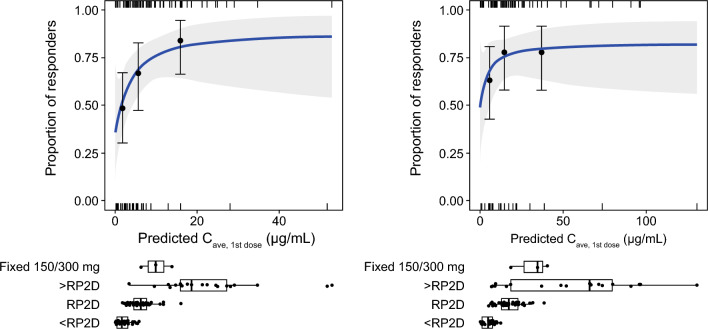
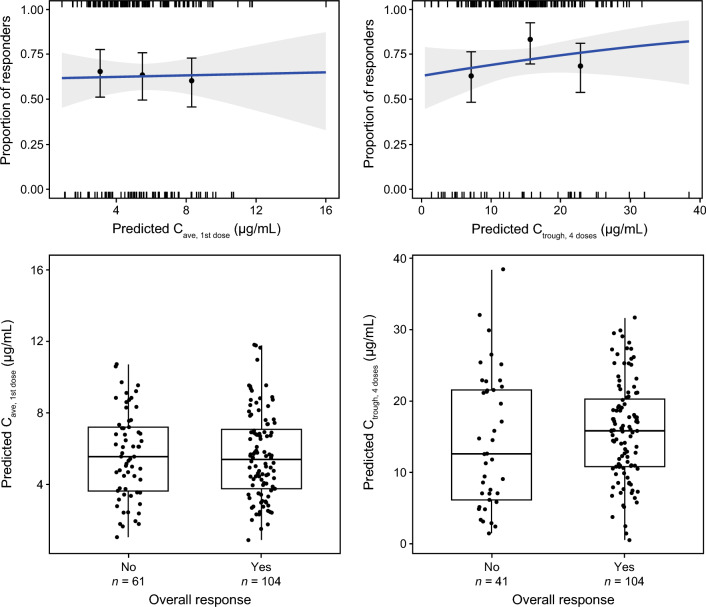
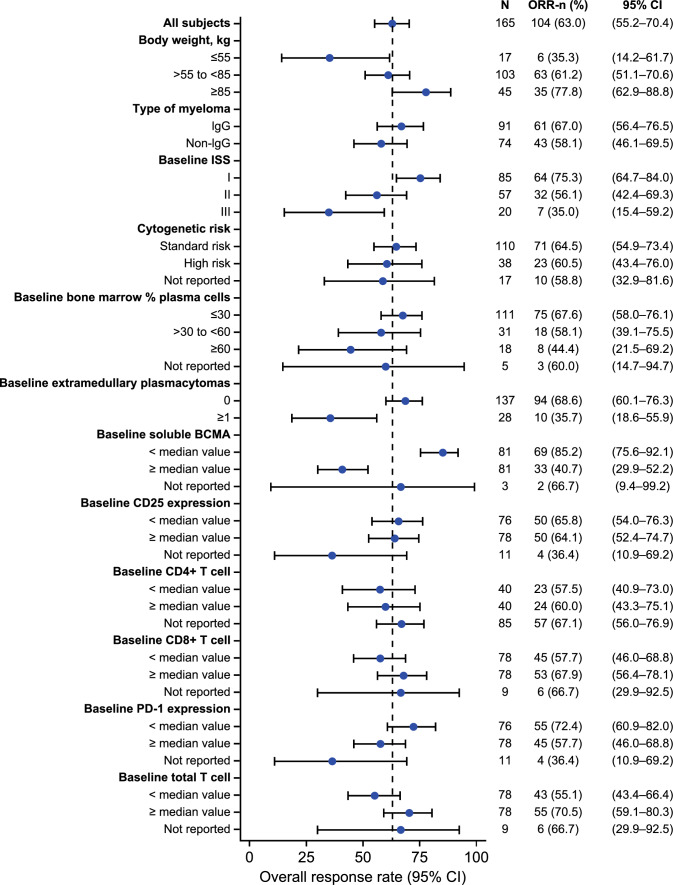
Results: In total, 4840 measurable serum concentration samples from 338 pharmacokinetics-evaluable patients who received teclistamab were analyzed. The typical population value of time-independent and time-dependent clearance were 0.449 L/day and 0.547 L/day, respectively. The time-dependent clearance decreased rapidly to < 10% after 8 weeks of teclistamab treatment. Patients who discontinue teclistamab after the 13th dose are expected to have a 50% reduction from Cmax in teclistamab concentration at a median (5th to 95th percentile) time of 15 days (7-33 days) after Tmax and a 97% reduction from Cmax in teclistamab concentration at a median time of 69 days (32-163 days) after Tmax. Body weight, multiple myeloma type (immunoglobulin G vs non-immunoglobulin G), and International Staging System (ISS) stage (II vs I and III vs I) were statistically significant covariates on teclistamab pharmacokinetics; however, these covariates had no clinically relevant effect on the efficacy of teclistamab at the RP2D. Across all doses, ORR approached a plateau at the concentration range associated with RP2D, and in patients who received the RP2D, a flat exposure-response curve was observed. No apparent relationship was observed between DoR, PFS, OS, and the incidence of grade ≥3 adverse events across the predicted exposure quartiles.

Conclusion: Body weight, myeloma type, and ISS stage impacted systemic teclistamab exposure without any clinically relevant effect on efficacy. The exposure-response analyses for ORR showed a positive trend with increasing teclistamab systemic exposure, with a plateau at the RP2D, and there was no apparent exposure-response trend for safety or other efficacy endpoints. These analyses support the RP2D of teclistamab in patients with RRMM.

Clinical trial registration: NCT03145181 (phase I, 09 May 2017); NCT04557098 (phase II, 21 September 2020).


Conflict of interest statement

Xin Miao, Liviawati S. Wu, Yuki Iwaki, Rachel Kobos, Tara Stephenson, Kristy Kemmerer, Clarissa M. Uhlar, Arnob Banerjee, Danielle Trancucci, Amit Apte, Raluca Verona, Lixia Pei, Rachit Desai, Kathleen Hickey, Yaming Su, Daniele Ouellet, Mahesh Samtani, and Yue Guo are employees of Janssen. Shun Xin Wang Lin is an employee of LinkiDose Medicine Co., Ltd. Yan Xu is an employee of Simcere Pharmaceuticals. Yang Chen is an employee of Daiichi Sankyo. Jenna D. Goldberg is an employee of Vividon and holds stock in Janssen. Alfred L. Garfall is a consultant for Janssen, GSK, and Amgen; has received research funding from Janssen, Novartis, Tmunity, and CRISPR Therapeutics; and is an independent data monitoring committee member for Janssen. Amrita Krishnan is a consultant for Adaptive, Janssen, Sanofi, BMS, Pfizer, and Regneron; is a current equity holder in BMS; has received research funding from Janssen; is a Speakers’ Bureau member for Takeda, GSK, and BMS; and is a member of the Board of Directors or advisory committee for Sutro. Saad Z. Usmani has served in a consulting or advisory role for Celgene, Amgen, Janssen, Takeda, GlaxoSmithKline, Karyopharm Therapeutics, AbbVie, Merck, Genentech, Gilead Sciences, and Bristol-Myers Squibb/Celgene; and has received research funding from Celgene, Array BioPharma, Janssen, Pharmacyclics, Sanofi, Bristol-Myers Squibb, Amgen, Seattle Genetics, Merck, Skyline Diagnostics, and GlaxoSmithKline. Honghui Zhou is an employee of Jazz Pharmaceuticals and owns stocks in Jazz Pharmaceuticals and Johnson & Johnson. Suzette Girgis is an employee of Jazz Pharmaceuticals and holds stocks in JNJ and BMS.

Figures

Fig. 1
Fig. 1
Forest plot of subgroup analyses of the predicted average concentration of the first treatment dose (Cave,1stdose) per the RP2D dose. Solid blue circle represents geometric mean ratio and error bar represents 95% CI. Dashed line represents reference value of 1. The associated values are shown on the right column. The dashed vertical lines refer to 0.8 and 1.25. Analyses assumed that all patients included in the population PK analysis data set received 1.5 mg/kg teclistamab SC administered weekly, with the first treatment dose preceded by step-up doses of 0.06 and 0.3 mg/kg. ECOG Eastern Cooperative Oncology Group, IgG immunoglobulin G, ISS International Staging System, PK pharmacokinetic, RP2D recommended phase II dose (1.5 mg/kg teclistamab SC administered weekly, with the first treatment dose preceded by step-up doses of 0.06 and 0.3 mg/kg), SC subcutaneous
Fig. 2
Fig. 2
Exposure–response relationship of the overall response in the phase I SC patients (phase I ORR; RP2D and non-RP2D) versus the predicted Cave,1stdose and Ctrough,4doses. Top panel: error bars are the 95% CI of ORR in the respective exposure tertile groups. Shaded areas of the logistic regression plots represent the 95% CI of the predicted ORR. Short vertical lines at the lower and upper part of the plotting area represent the exposure metrics in nonresponders and responders, respectively. Cave,1stdose average concentration during the first treatment dose, CI confidence interval, Ctrough,4doses trough concentration after the first four weekly treatment doses (i.e., predose concentration of the fifth weekly treatment dose), ORR overall response rate, RP2D recommended phase II dose (which is 1.5 mg/kg teclistamab SC administered weekly, with the first treatment dose preceded by step-up doses of 0.06 and 0.3 mg/kg), SC subcutaneous
Fig. 3
Fig. 3
Exposureresponse relationship of the overall response in the patients who received the RP2D versus the predicted Cave,1stdose and Ctrough,4doses. Top panel: error bars are the 95% CI of ORR in the respective exposure tertile groups. Shaded areas of the logistic regression plots represent the 95% CI of the predicted ORR. Short vertical lines at the lower and upper part of the plotting area represent the exposure metrics in nonresponders and responders, respectively. Bottom panel: black dots are the individual exposure metrics predicted based on actual dosing and individual population PK model parameter estimates. Cave,1stdose average concentration during the first treatment dose, CI confidence interval, Ctrough,4doses trough concentration after the first 4 weekly treatment doses, ORR overall response rate, PK pharmacokinetic, RP2D recommended phase II dose (which is 1.5 mg/kg teclistamab SC administered weekly, with the first treatment dose preceded by step-up doses of 0.06 and 0.3 mg/kg), SC subcutaneous
Fig. 4
Fig. 4
Subgroup analysis of RP2D ORR based on baseline characteristics. Solid blue circle represents geometric mean ratio, and error bar represents 95% CI. The dashed vertical line shows the overall RP2D ORR of 62%. BCMA B-cell maturation antigen, CD cluster of differentiation, CI confidence interval, IgG immunoglobulin G, ISS International Staging System, ORR overall response rate, PD-1 programmed cell death protein 1, RP2D recommended phase II dose (which is 1.5 mg/kg teclistamab SC administered weekly, with the first treatment dose preceded by step-up doses of 0.06 and 0.3 mg/kg), SC subcutaneous
Fig. 5
Fig. 5
DoR, PFS, and OS stratified by predicted Cave,1stdose and Ctrough,4doses tertiles for RP2D. Numbers below the plots represent the number of patients at risk at each time point. Cave,1stdose average concentration during the first treatment dose, Ctrough,4doses trough concentration after the first four weekly treatment doses (i.e., predose concentration of the fifth weekly treatment dose), DoR duration of response, OS overall survival, PFS progression-free survival, RP2D recommended phase II dose (which is 1.5 mg/kg teclistamab SC administered weekly, with the first treatment dose preceded by step-up doses of 0.06 and 0.3 mg/kg), SC subcutaneous, T1 lowest exposure tertile group, T2 middle exposure tertile group, T3 highest exposure tertile group
Fig. 6
Fig. 6
Comparison of AE occurrence rates by the predicted Cmax,1stdose and Cmax,4doses quartiles. Error bars are the 95% CI of AE occurrence rates in the respective exposure quartile groups. AE adverse event, CI confidence interval, Cmax,1stdose maximum concentration following the first treatment dose, Cmax,4doses maximum concentration following the first four weekly treatment doses, Gr grade, n number of patients
Fig. 6
Fig. 6
Comparison of AE occurrence rates by the predicted Cmax,1stdose and Cmax,4doses quartiles. Error bars are the 95% CI of AE occurrence rates in the respective exposure quartile groups. AE adverse event, CI confidence interval, Cmax,1stdose maximum concentration following the first treatment dose, Cmax,4doses maximum concentration following the first four weekly treatment doses, Gr grade, n number of patients

References

    1. Rajkumar SV. Multiple myeloma: 2020 update on diagnosis, risk-stratification and management. Am J Hematol. 2020;95(5):548–567. doi: 10.1002/ajh.25791. - DOI - PubMed
    1. Dimopoulos MA, Moreau P, Terpos E, et al. Multiple myeloma: EHA-ESMO clinical practice guidelines for diagnosis, treatment and follow-up. Hemasphere. 2021;5(2):e528. - PMC - PubMed
    1. Mateos MV, Weisel K, De Stefano V, et al. LocoMMotion: a prospective, non-interventional, multinational study of real-life current standards of care in patients with relapsed and/or refractory multiple myeloma. Leukemia. 2022;36(5):1371–1376. doi: 10.1038/s41375-022-01531-2. - DOI - PMC - PubMed
    1. EMA summary of product characteristics. Abecma (idecabtagene vicleucel). Vol. 2022.
    1. EMA summary of product characteristics. CARVYKTI (ciltacabtagene autoleucel). Vol. 2022.

Publication types

Substances

Associated data