

Therapeutic Effects of Upadacitinib on Experimental Autoimmune Uveitis: Insights From Single-Cell Analysis
- PMID: 37713206
- PMCID: PMC10506681
- DOI: 10.1167/iovs.64.12.28
Therapeutic Effects of Upadacitinib on Experimental Autoimmune Uveitis: Insights From Single-Cell Analysis
Abstract
Purpose: This study aimed to elucidate the impact of upadacitinib, a Janus kinase 1 (JAK1)-specific inhibitor, on experimental autoimmune uveitis (EAU) and explore its underlying mechanisms.
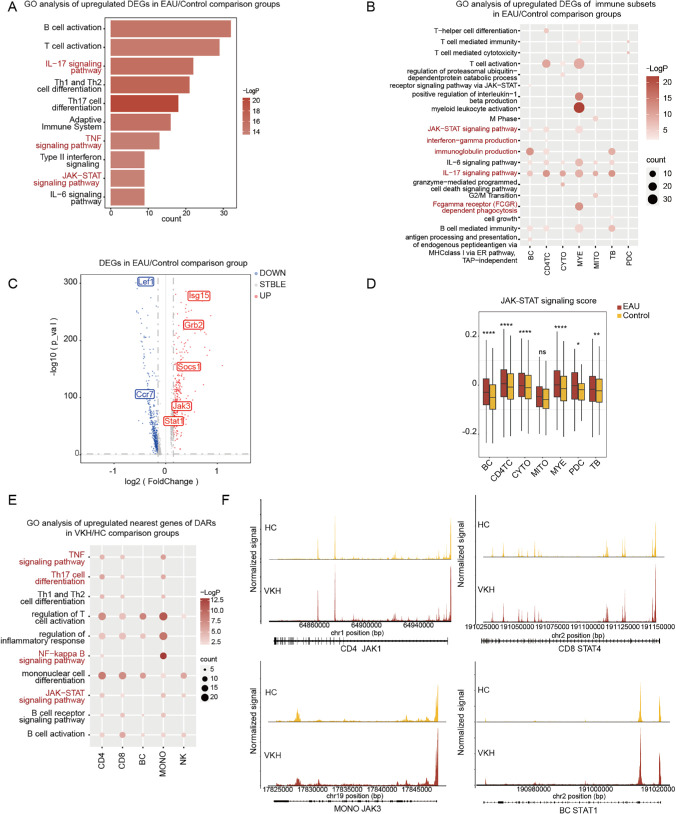
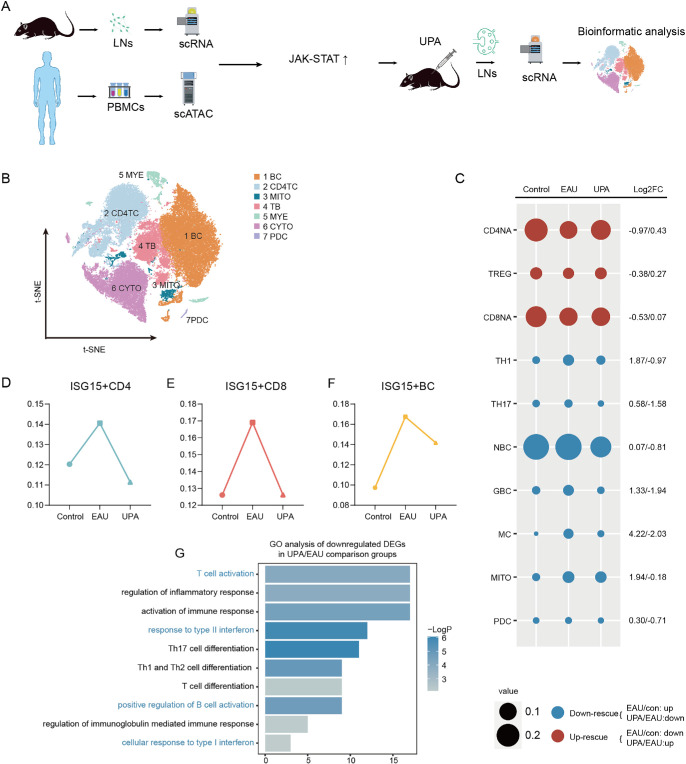
Methods: We utilized single-cell RNA sequencing (scRNA-seq) and single-cell assay for transposase-accessible chromatin sequencing (scATAC-seq) to investigate the JAK/signal transducer and activator of transcription (STAT) pathway in peripheral blood mononuclear cells (PBMCs) of 12 patients with Vogt-Koyanagi-Harada (VKH) disease and cervical draining lymph node (CDLN) cells of EAU. After treating EAU with upadacitinib, we analyzed immune cell gene expression and cell-cell communication by integrating scRNA data. Additionally, we applied flow cytometry and western blot to analyze the CDLN cells.
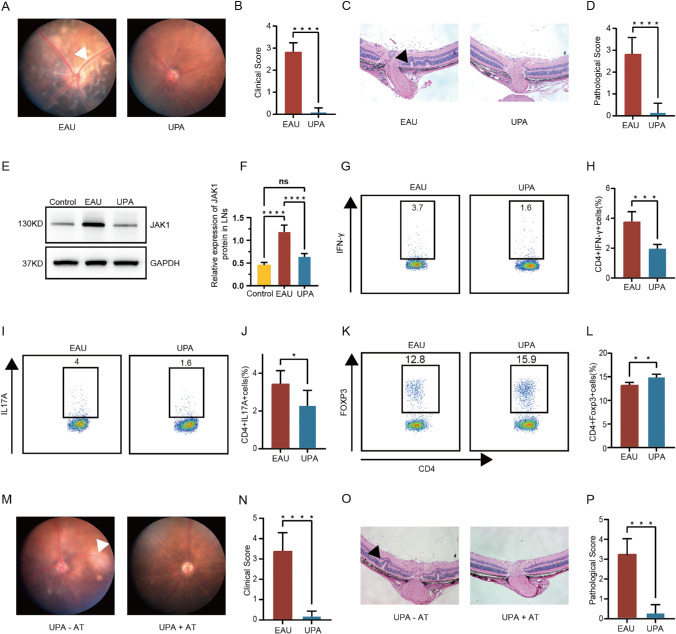
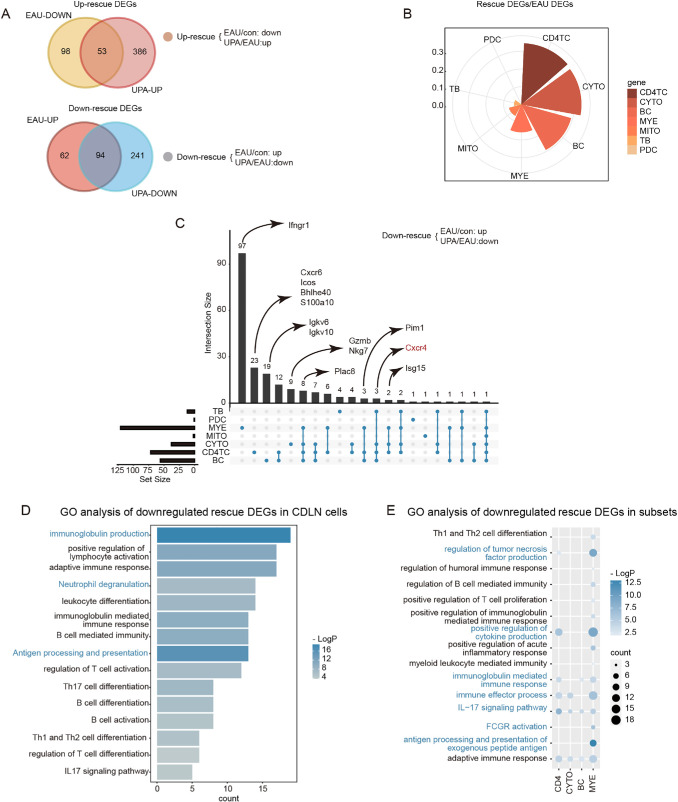
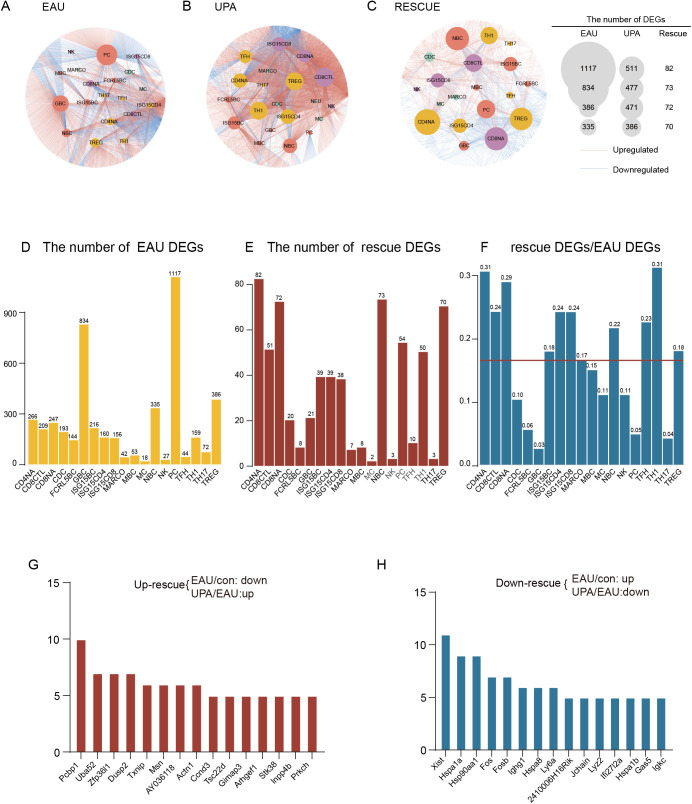
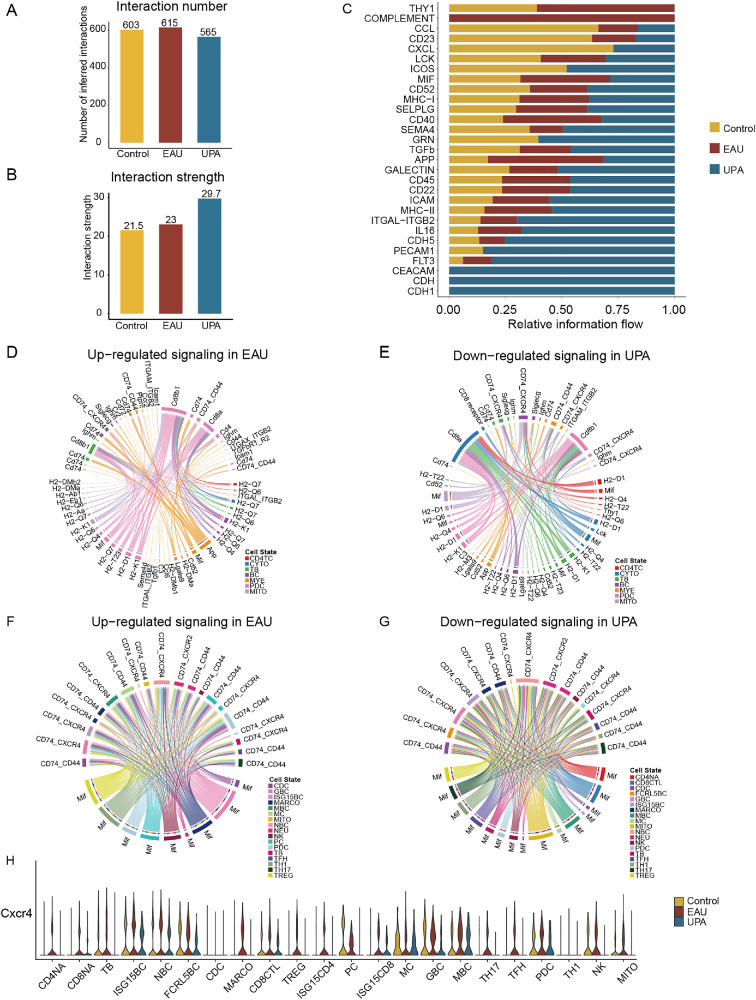
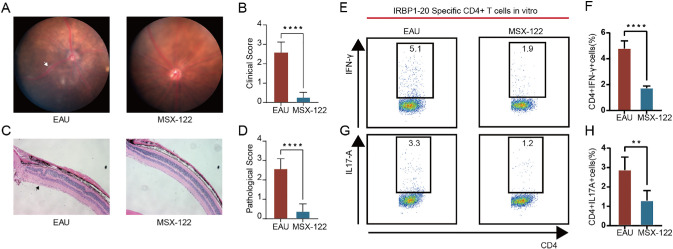
Results: The JAK/STAT pathway was found to be upregulated in patients with VKH disease and EAU. Upadacitinib effectively alleviated EAU symptoms, reduced JAK1 protein expression, and suppressed pathogenic CD4 T cell (CD4TC) proliferation and pathogenicity while promoting Treg proliferation. The inhibition of pathogenic CD4TCs by upadacitinib was observed in both flow cytometry and scRNA data. Additionally, upadacitinib was found to rescue the interferon-stimulated gene 15 (ISG15)+ CD4TCs and CD8 T and B cell ratios and reduce expression of inflammatory-related genes. Upadacitinib demonstrated the ability to inhibit abnormally activated cell-cell communication, particularly the CXCR4-mediated migration pathway, which has been implicated in EAU pathogenesis. CXCR4 inhibitors showed promising therapeutic effects in EAU.
Conclusions: Our findings indicate that the JAK1-mediated signaling pathway is significantly upregulated in uveitis, and upadacitinib exhibits therapeutic efficacy against EAU. Furthermore, targeting the CXCR4-mediated migration pathway could be a promising therapeutic strategy.
Conflict of interest statement
Disclosure:
Figures
Similar articles
-
Beneficial mechanisms of dimethyl fumarate in autoimmune uveitis: insights from single-cell RNA sequencing.J Neuroinflammation. 2024 Apr 29;21(1):112. doi: 10.1186/s12974-024-03096-6. J Neuroinflammation. 2024. PMID: 38684986 Free PMC article.
-
Identification of Hif1α as a Potential Participant in Autoimmune Uveitis Pathogenesis Using Single-Cell Transcriptome Analysis.Invest Ophthalmol Vis Sci. 2023 May 1;64(5):24. doi: 10.1167/iovs.64.5.24. Invest Ophthalmol Vis Sci. 2023. PMID: 37227746 Free PMC article.
-
p38{alpha} MAP kinase controls IL-17 synthesis in vogt-koyanagi-harada syndrome and experimental autoimmune uveitis.Invest Ophthalmol Vis Sci. 2010 Jul;51(7):3567-74. doi: 10.1167/iovs.09-4393. Epub 2010 Feb 17. Invest Ophthalmol Vis Sci. 2010. PMID: 20164464
-
[Intraocular inflammation and homeostasis of the eye].Nippon Ganka Gakkai Zasshi. 2009 Mar;113(3):344-77; discussion 378. Nippon Ganka Gakkai Zasshi. 2009. PMID: 19348183 Review. Japanese.
-
Upadacitinib for the management of bullous pemphigoid coexisting with psoriasis vulgaris: a case report and literature review.J Dermatolog Treat. 2024 Dec;35(1):2302394. doi: 10.1080/09546634.2024.2302394. Epub 2024 Jan 23. J Dermatolog Treat. 2024. PMID: 38263708 Review.
Cited by
-
Successful Use of Upadacitinib, a Selective JAK Inhibitor, in the Treatment of Two Cases of Recalcitrant Chronic Uveitis.J Ophthalmic Vis Res. 2025 May 5;20:10.18502/jovr.v20.14952. doi: 10.18502/jovr.v20.14952. eCollection 2025. J Ophthalmic Vis Res. 2025. PMID: 40689111 Free PMC article.
-
NETs-CD44-IL-17A Feedback Loop Drives Th17-Mediated Inflammation in Behçet's Uveitis.Adv Sci (Weinh). 2025 Apr;12(16):e2411524. doi: 10.1002/advs.202411524. Epub 2025 Feb 27. Adv Sci (Weinh). 2025. PMID: 40013981 Free PMC article.
-
The regulatory functions of G protein-coupled receptors signaling pathways in B cell differentiation and development contributing to autoimmune diseases.Cell Biosci. 2025 Apr 30;15(1):57. doi: 10.1186/s13578-025-01398-7. Cell Biosci. 2025. PMID: 40307944 Free PMC article. Review.
-
Case report: Effectiveness of Janus kinase inhibitors in the management of isolated noninfectious uveitis: a case series.Front Pharmacol. 2025 Mar 6;16:1509404. doi: 10.3389/fphar.2025.1509404. eCollection 2025. Front Pharmacol. 2025. PMID: 40115257 Free PMC article.
-
Rituximab, Apremilast, and Upadacitinib as Selected Biosimilar and Targeted Synthetic Disease-Modifying Antirheumatic Drugs with Diverse Mechanisms of Action: Their Current Use in Slowing Down the Progression of Disease.J Clin Med. 2025 Apr 10;14(8):2605. doi: 10.3390/jcm14082605. J Clin Med. 2025. PMID: 40283434 Free PMC article. Review.
References
-
- Gritz DC, Wong IG.. Incidence and prevalence of uveitis in Northern California; the Northern California Epidemiology of Uveitis Study. Ophthalmology. 2004; 111: 491–500; discussion 500. - PubMed
-
- Burmester GR, Kremer JM, Van den Bosch F, et al. .. Safety and efficacy of upadacitinib in patients with rheumatoid arthritis and inadequate response to conventional synthetic disease-modifying anti-rheumatic drugs (SELECT-NEXT): a randomised, double-blind, placebo-controlled phase 3 trial. Lancet. 2018; 391: 2503–2512. - PubMed
-
- McInnes IB, Anderson JK, Magrey M, et al. .. Trial of upadacitinib and adalimumab for psoriatic arthritis. N Engl J Med. 2021; 384: 1227–1239. - PubMed
-
- Boneschansker L, Ananthakrishnan AN. Comparative effectiveness of upadacitinib and tofacitinib in inducing remission in ulcerative colitis: real-world data. Clin Gastroenterol Hepatol. 2023; 21: 2427–2429.e2421. - PubMed
Publication types
MeSH terms
Substances
LinkOut - more resources
Full Text Sources
Research Materials
Miscellaneous
