. 2024 Jan;70(1):39-49.
doi: 10.1165/rcmb.2023-0010OC.

Mitochondria-derived Vesicle Packaging as a Novel Therapeutic Mechanism in Pulmonary Hypertension

Affiliations

Mitochondria-derived Vesicle Packaging as a Novel Therapeutic Mechanism in Pulmonary Hypertension

Qiang Zhao et al. Am J Respir Cell Mol Biol. 2024 Jan.

Abstract

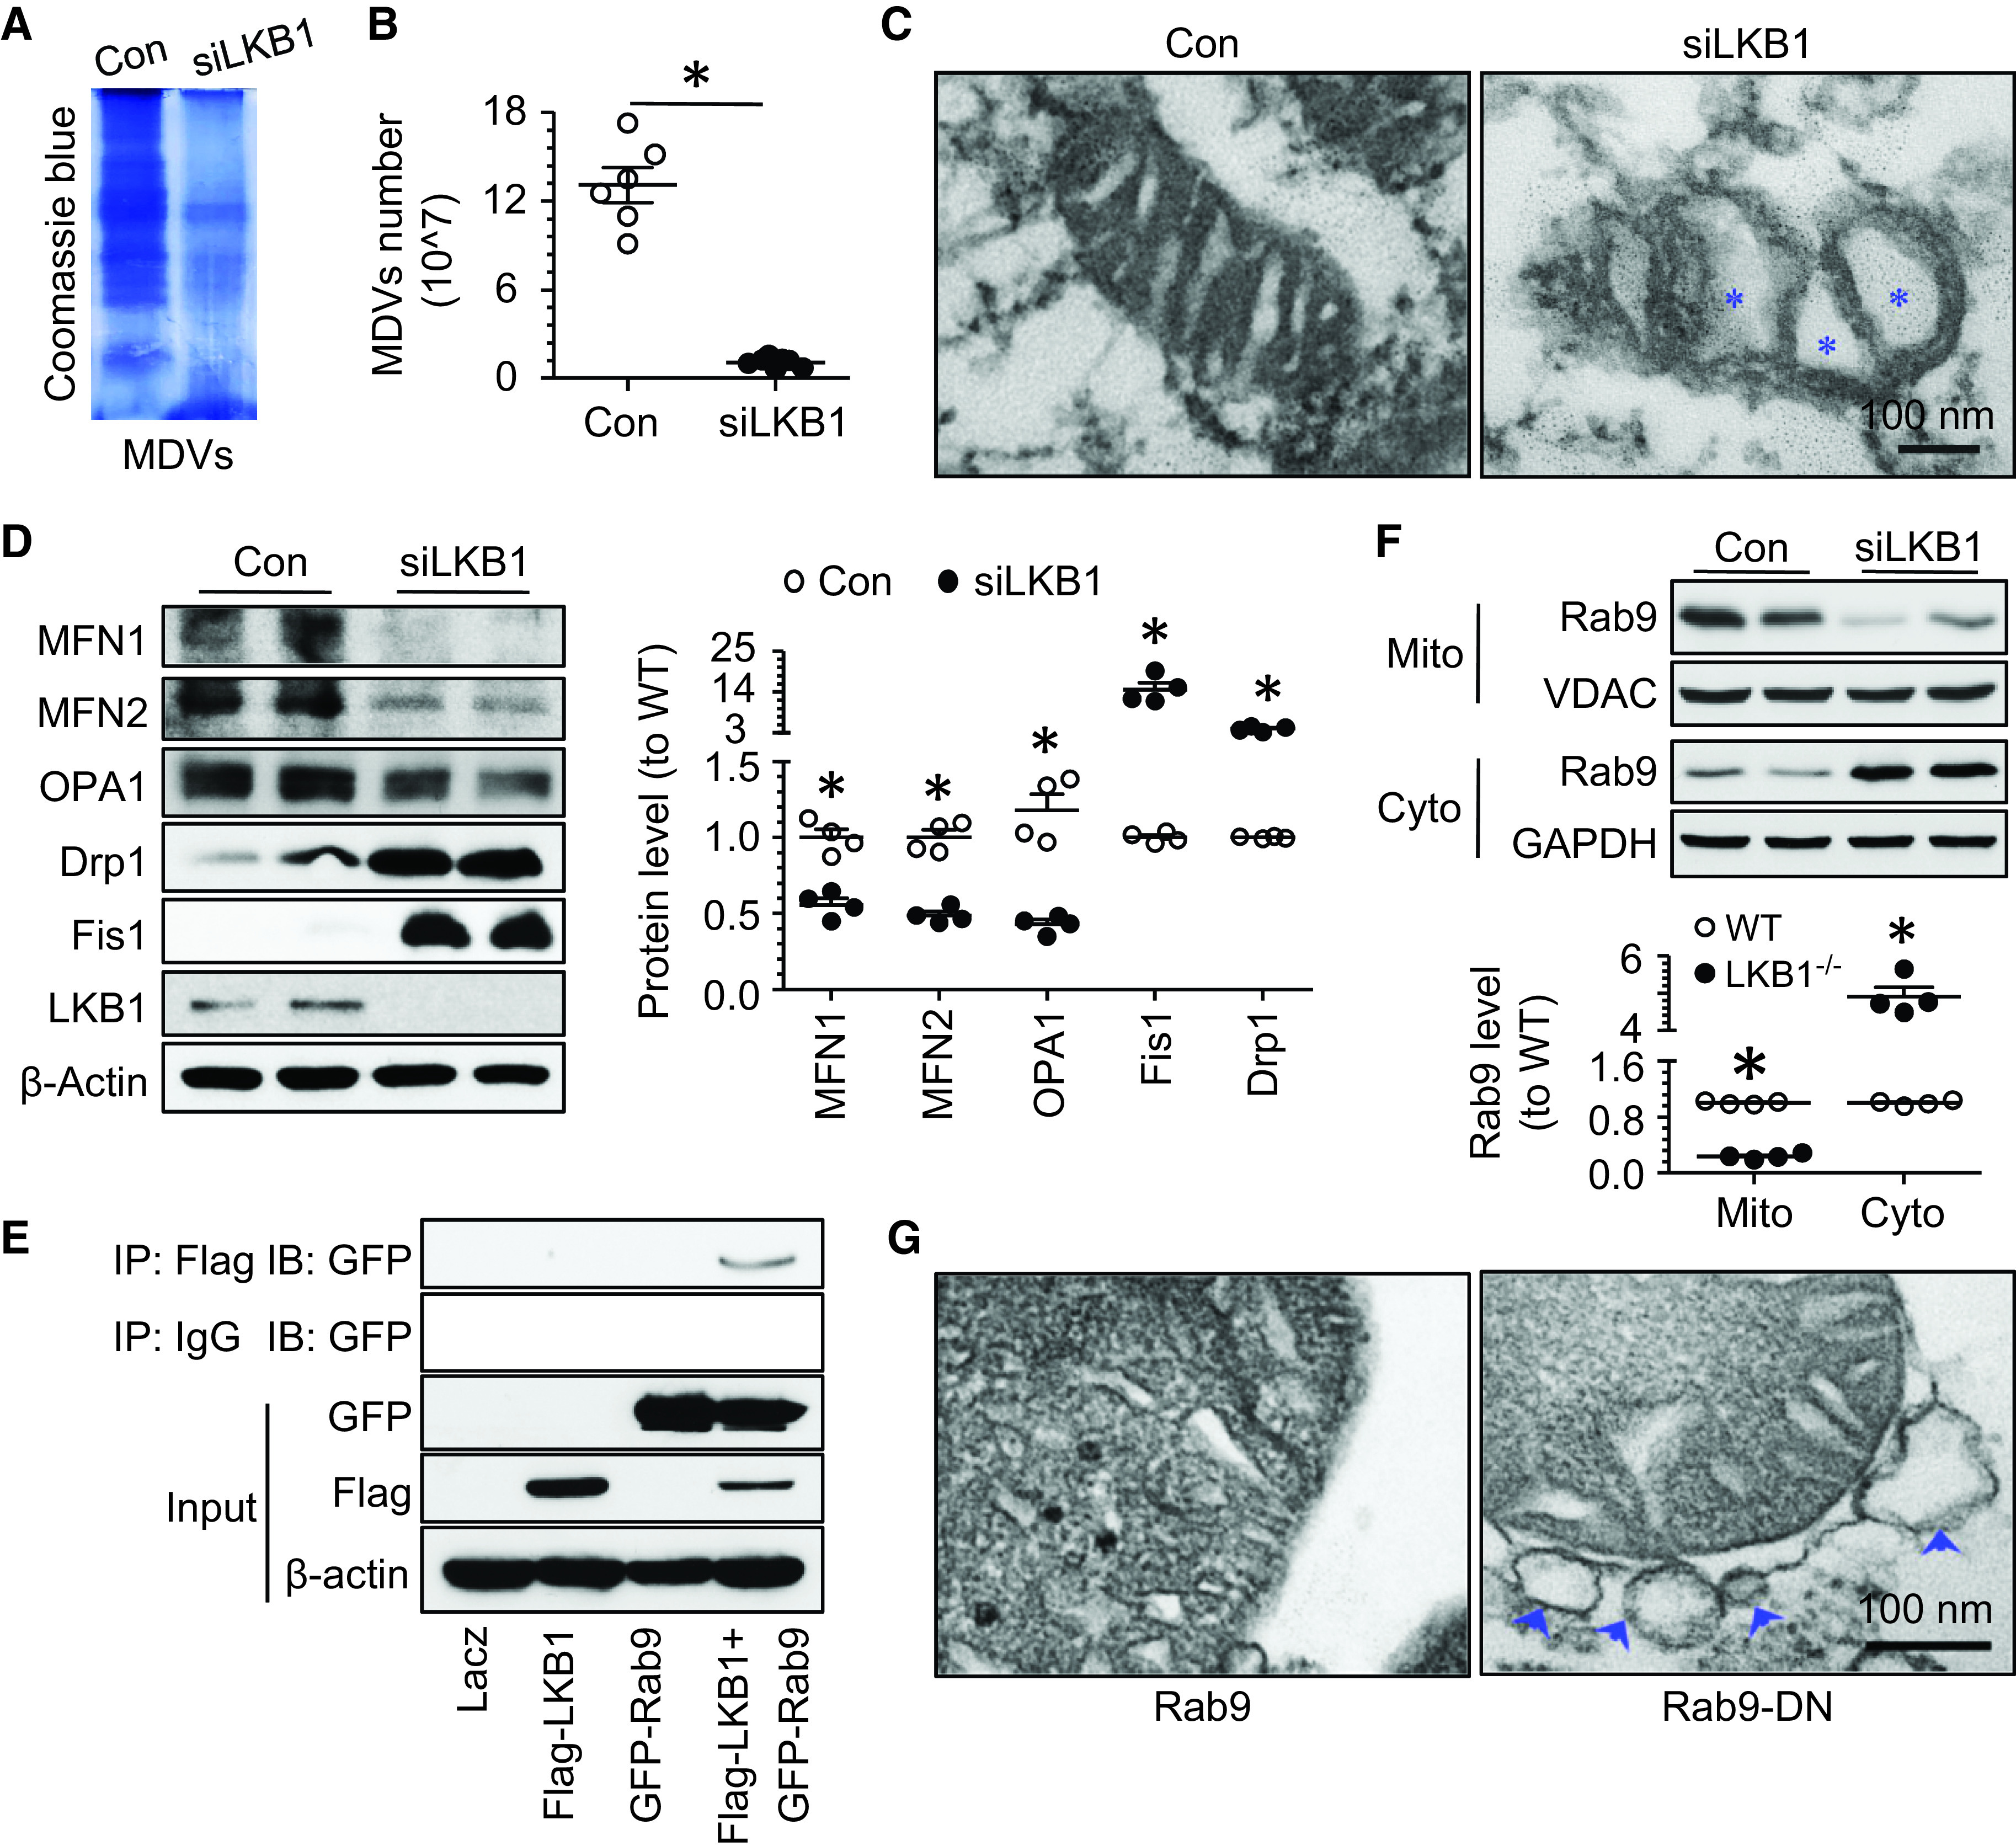
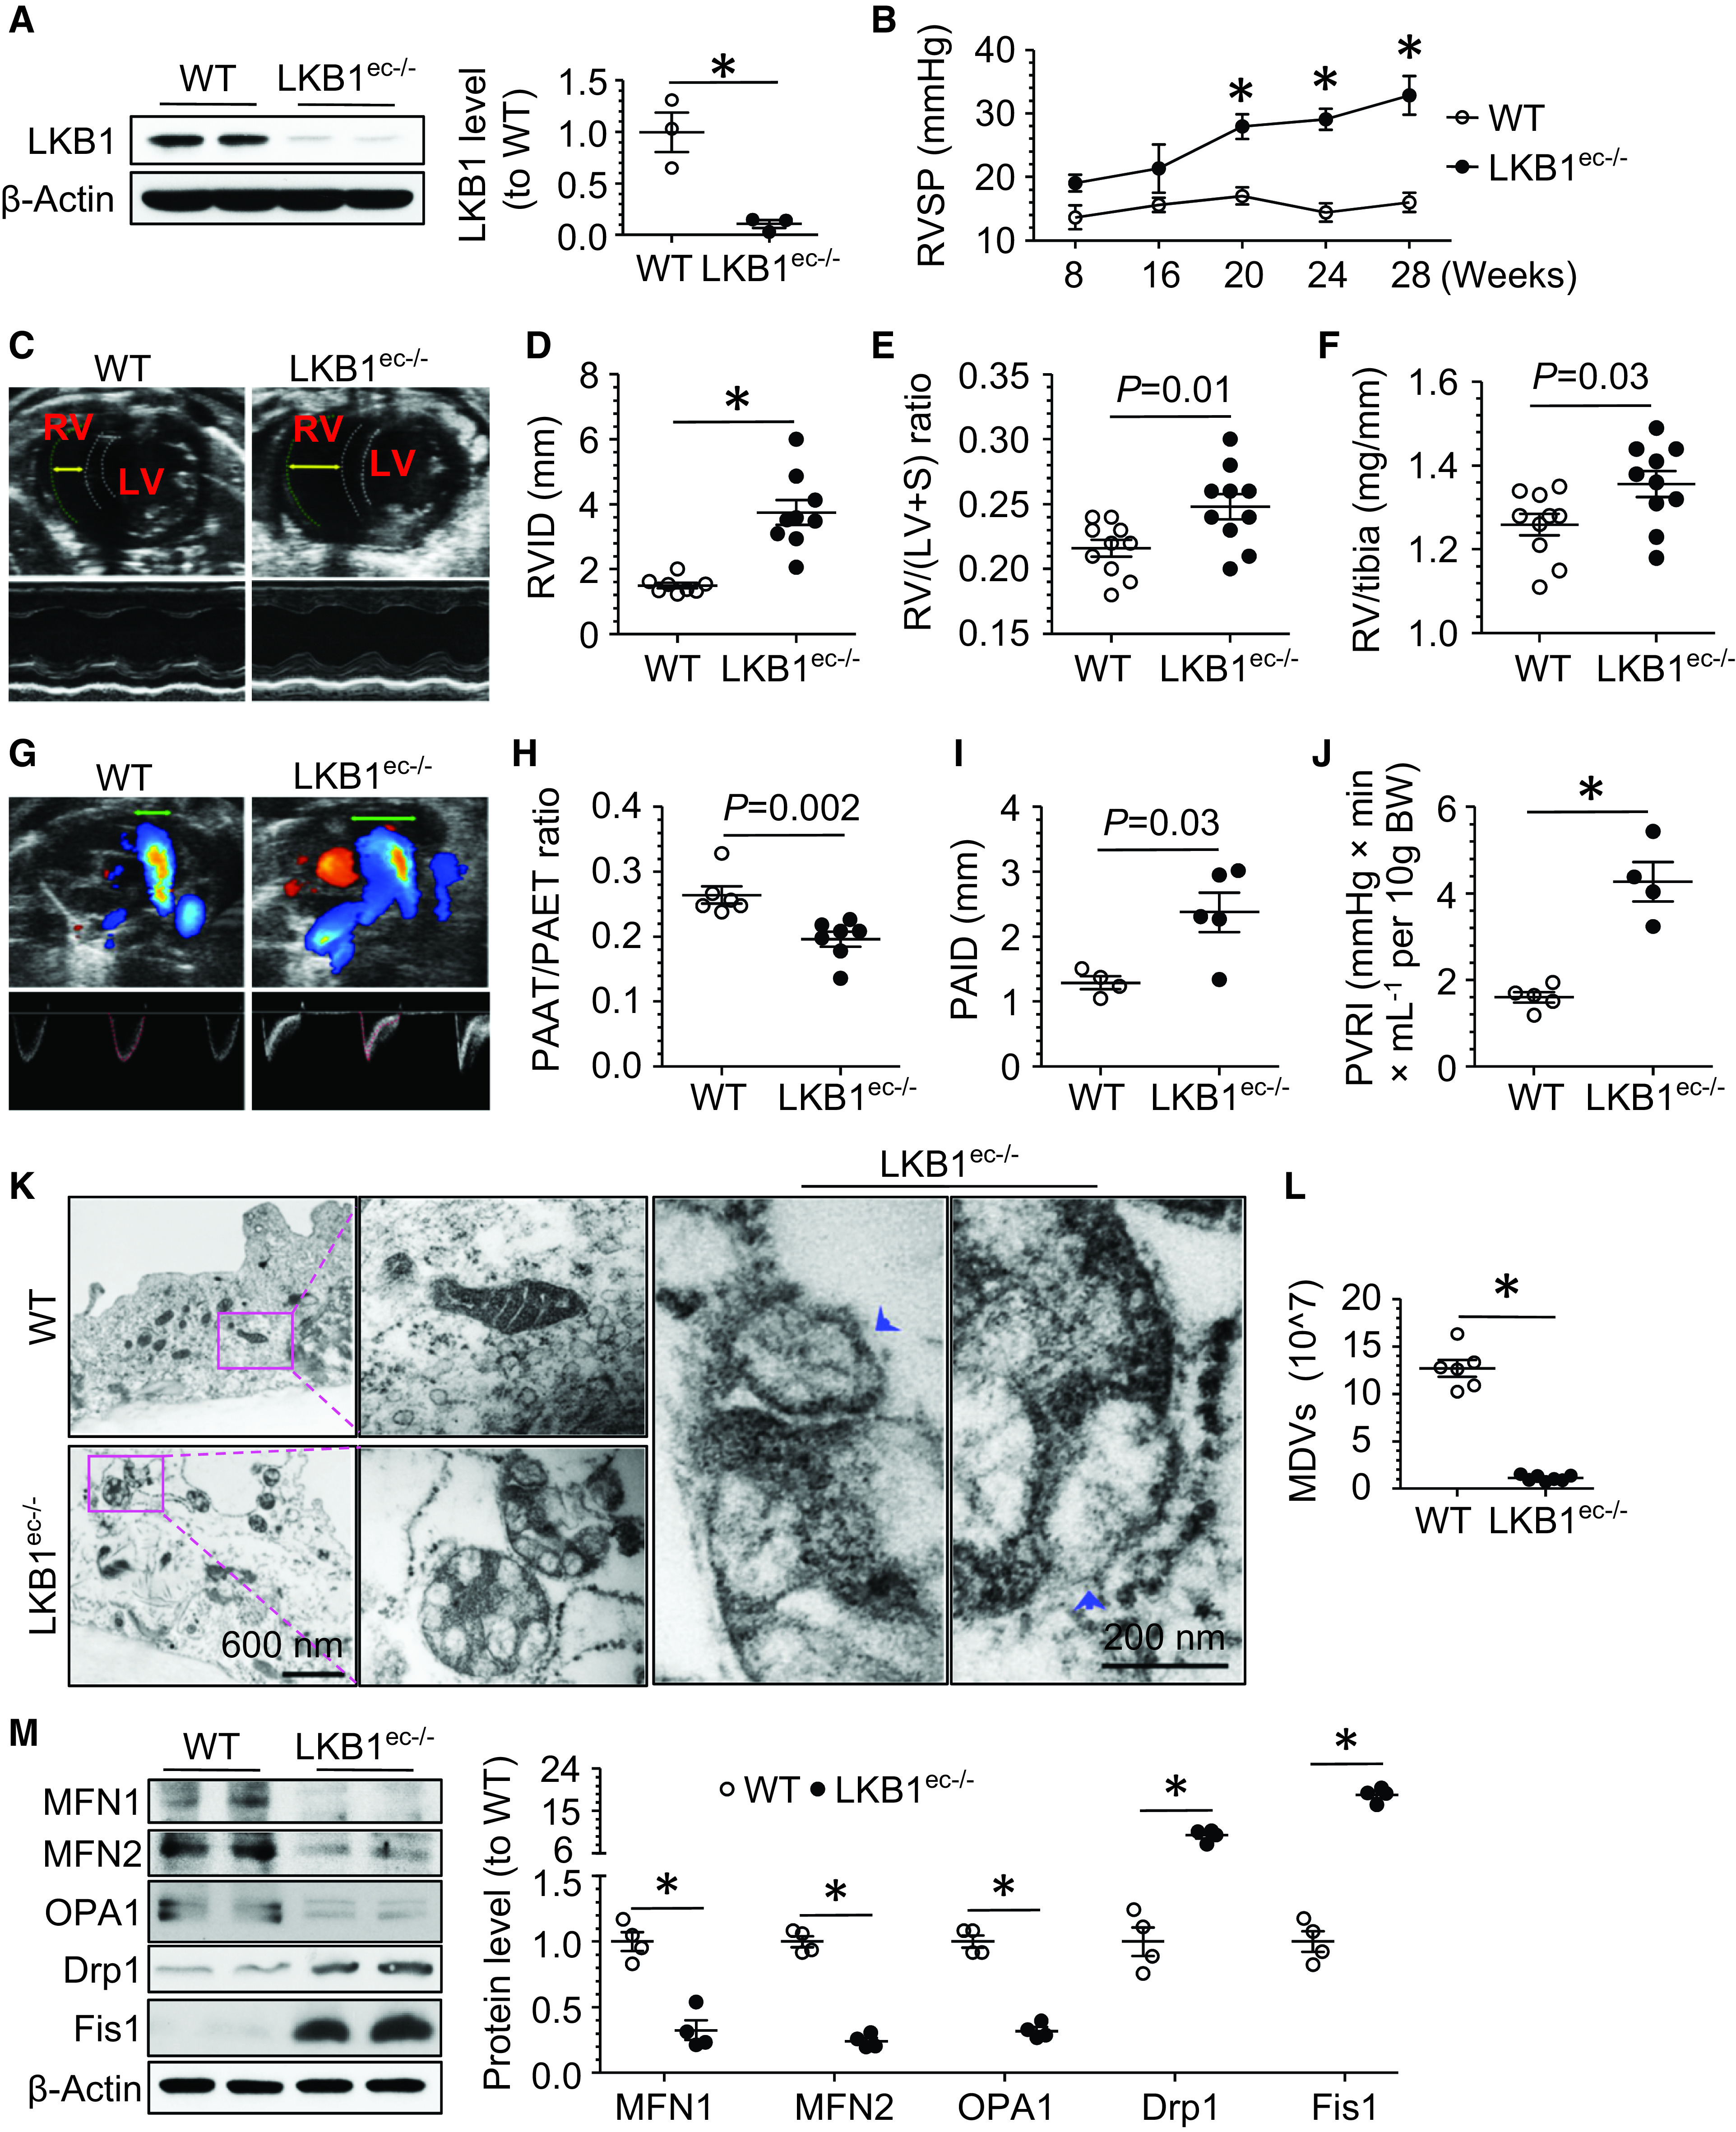
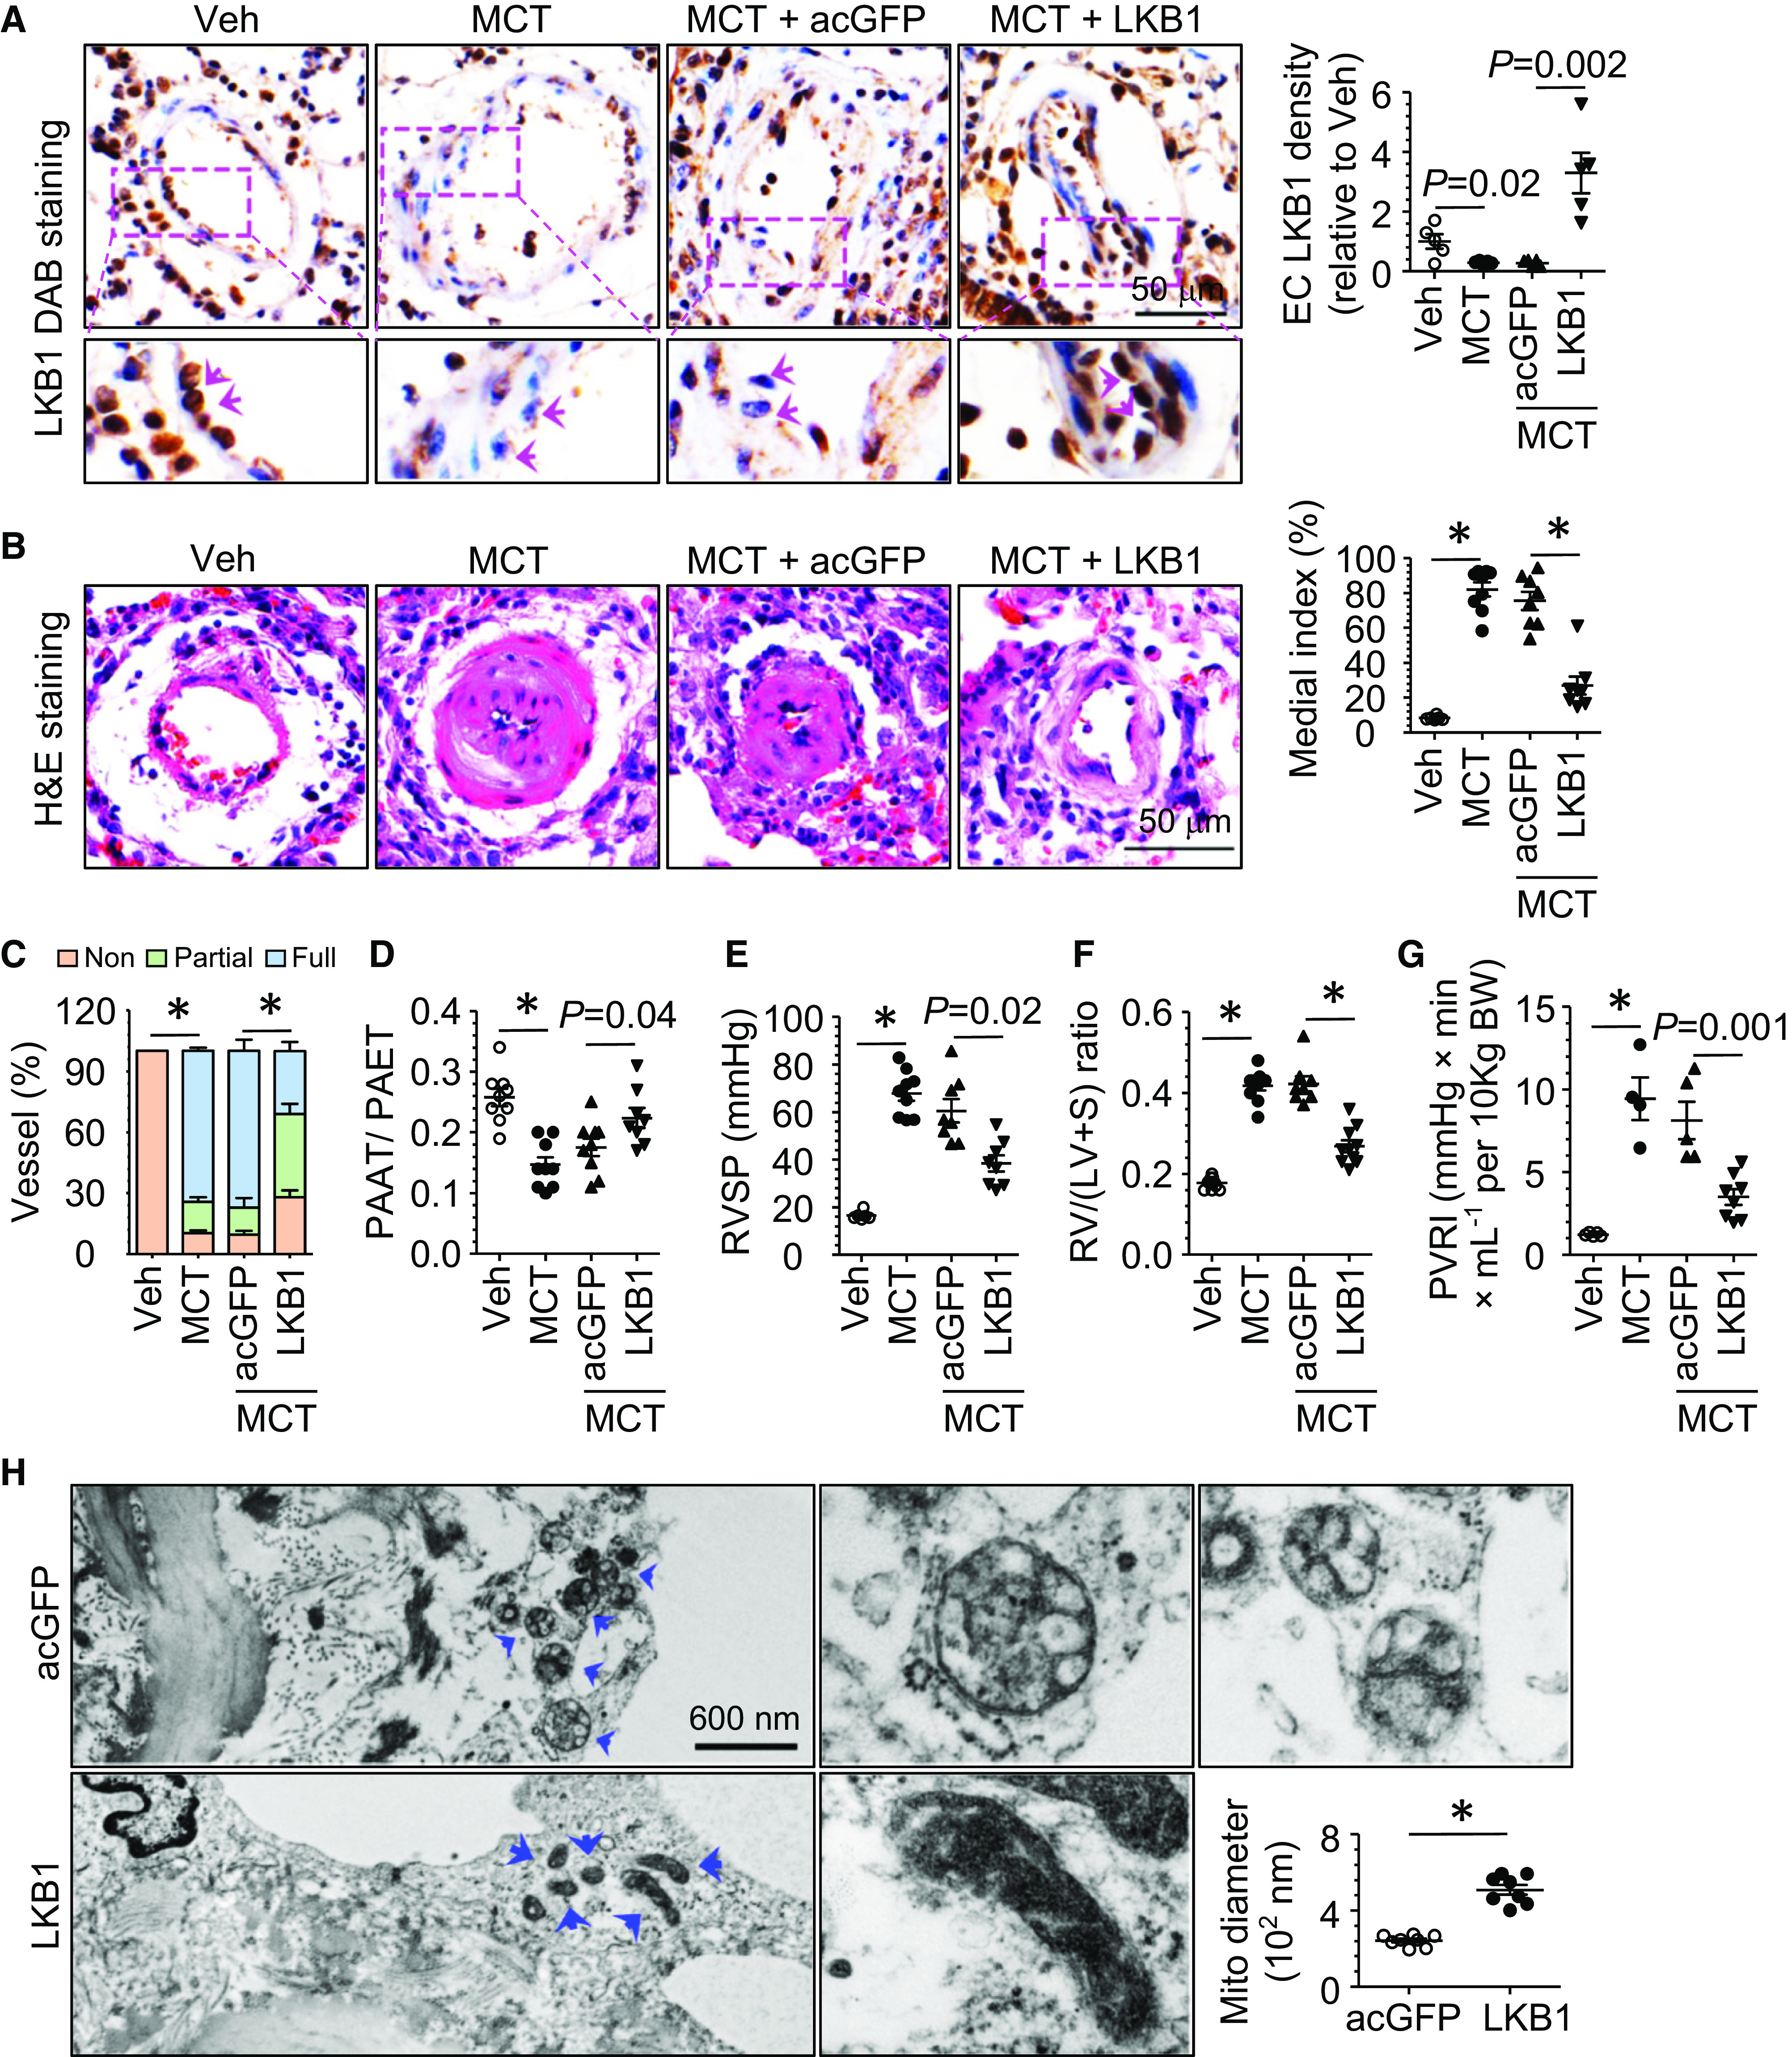
Increasing evidence suggests that mitochondrial dysfunction in pulmonary endothelial cells (ECs) plays a causative role in the initiation and progression of pulmonary hypertension (PH); how mitochondria become dysfunctional in PH remains elusive. Mitochondria-derived vesicles (MDVs) are small subcellular vesicles that excise from mitochondria. Whether MDV deregulation causes mitochondrial dysfunction in PH is unknown. The aim of this study was to determine MDV regulation in ECs and to elucidate how MDV deregulation in ECs leads to PH. MDV formation and mitochondrial morphology/dynamics were examined in ECs of EC-specific liver kinase B1 (LKB1) knockout mice (LKB1ec-/-), in monocrotaline-induced PH rats, and in lungs of patients with PH. Pulmonary ECs of patients with PH and hypoxia-treated pulmonary ECs exhibited increased mitochondrial fragmentation and disorganized mitochondrial ultrastructure characterized by electron lucent-swelling matrix compartments and concentric layering of the cristae network, together with defective MDV shedding. MDVs actively regulated mitochondrial membrane dynamics and mitochondrial ultrastructure via removing mitofission-related cargoes. The shedding of MDVs from parental mitochondria required LKB1-mediated mitochondrial recruitment of Rab9 GTPase. LKB1ec-/- mice spontaneously developed PH with decreased mitochondrial pools of Rab9 GTPase, defective MDV shedding, and disequilibrium of the mitochondrial fusion-fission cycle in pulmonary ECs. Aerosol intratracheal delivery of adeno-associated virus LKB1 reversed PH, together with improved MDV shedding and mitochondrial function in rats in vivo. We conclude that LKB1 regulates MDV shedding and mitochondrial dynamics in pulmonary ECs by enhancing mitochondrial recruitment of Rab9 GTPase. Defects of LKB1-mediated MDV shedding from parental mitochondria instigate EC dysfunction and PH.

Keywords: endothelial cell dysfunction; liver kinase B1; mitochondria-derived vesicles; pulmonary hypertension.


Figures

Figure 1.
Figure 1.
Disorganized mitochondrial ultrastructure and impaired mitochondria-derived vesicle (MDV) shedding with reduced liver kinase B1 (LKB1) expression in pulmonary endothelial cells (ECs) of pulmonary hypertension (PH). (A) Representative electron microscopy (EM) images of mitochondria and quantification of mitochondria (Mito) diameter in pulmonary ECs of monocrotaline (MCT)-induced PH rats and control rats (n = 8 each group). Blue arrows mark mitochondria. Pink arrow marks ongoing mitochondria budding events. Scale bar, 200 nm. (B) Flow cytometric analysis of mitochondrial size in pulmonary ECs from MCT-induced PH rats and control rats (n = 8 each group). (C) Representative fluorescence images and quantification of pulmonary artery Fis1/Drp1/LKB1 expression in ECs (pink arrows) from the lungs of patients with idiopathic pulmonary artery hypertension (n = 6) or donor controls (n = 4). Lung tissues were costained with anti-Fis1/Drp1/LKB1 (green), anti–von Willebrand factor (red) antibodies, and DAPI (blue). Scale bars, 50 μm. (D) Representative EM images of mitochondria from pulmonary ECs of MCT-induced PH rats or control rats. Arrow marks mitochondria budding events. Scale bar, 100 nm. (E) Representative EM images and quantification of MDVs from pulmonary ECs of MCT-induced PH rats or control rats (n = 8 each group). Scale bar, 100 nm. Data are presented as the mean ± SEM. Exact significance values were displayed when P ⩾ 0.001, and denoting significance with *P < 0.001. Veh = vehicle.
Figure 2.
Figure 2.
Hypoxia inhibits MDV shedding and reduces mitochondrial size and LKB1 expression. (A) Time lapse of mitochondrial morphology in normoxia-treated (21% O2, 24 h) or hypoxia-treated (1% O2, 24 h) human pulmonary ECs. Images were collected at 3–4 minute intervals for 10 minutes. Quantification of the ratio of mitochondrial fission and fission-plus-fusion events in cells (n = 8 per group). (B) Representative EM images of mitochondria and MDVs from human pulmonary ECs treated with normoxia or hypoxia for 24 hours. Pink asterisks mark the mitochondria budding events in different stages. Scale bars, 200 nm. (C) MDV quantification in human pulmonary ECs treated with normoxia or hypoxia for 24 hours (n = 8–10 per group). (D) Western blot analysis of MFN1, MFN2, OPA1, Drp1, Fis1, LKB1, and β-actin in human pulmonary ECs treated with normoxia or hypoxia for 24 hours. Representative blots from four independent experiments are presented. Data are presented as the mean ± SEM. Exact significance values were displayed when P ⩾ 0.001, and denoting significance with *P < 0.001.
Figure 3.
Figure 3.
MDV shedding is controlled by LKB1/Rab9. (A) Representative Coomassie blue staining of gels loaded with MDVs isolated from control siRNA or LKB1 siRNA-treated human pulmonary ECs. (B) MDV quantification in control siRNA or LKB1 siRNA-treated human pulmonary ECs (n = 6–7 per group). (C) Representative EM images of mitochondria in control siRNA or LKB1 siRNA-treated human pulmonary ECs. The electron-lucent swelling matrix compartments associated with disarrangement and distortion of the cristae network in LKB1 siRNA-treated human pulmonary ECs are marked with asterisks. (D) Western blot analysis of MFN1, MFN2, OPA1, Drp1, Fis1, LKB1, and β-actin in control siRNA or LKB1 siRNA-treated human pulmonary ECs. (E) Lacz/Flag-LKB1/GFP-Rab9 constructs were overexpressed in bovine aortic ECs (BAECs) for 48 hours before Flag pulldown and immunoblotting with GFP, Flag, or β-actin. (F) Representative Western blot and quantification of Rab9, voltage-dependent anion channel, and GAPDH in mitochondrial fractions or cytosol fractions isolated from control siRNA or LKB1 siRNA-treated human pulmonary ECs. (G) EM images of mitochondria isolated from Rab9-DN or Rab9 GTPase overexpressed LKB1−/− ECs. Arrows mark mitochondria budding events in different stages. Scale bars, 100 nm. Representative blots from four independent experiments are presented. Data are presented as the mean ± SEM. *P < 0.05.
Figure 4.
Figure 4.
Mice with the EC-specific deletion of LKB1 display PH features with impaired MDV shedding in vivo. (A) Western blot analysis and the corresponding quantification of LKB1 expression in isolated pulmonary ECs from LKB1ec−/− and wild-type (WT) mice. (B) Right ventricular pressure in LKB1ec−/− and WT mice (n = 6 or 7 mice per group). (C) Representative heart echocardiograms of LKB1ec−/− and WT mice. The green dotted line indicates the right ventricular free wall, and the white dotted line indicates the interventricular septum. The yellow arrows indicate the right ventricular internal diameter (RVID). Echocardiography followed by physiological measurements were performed on LKB1ec−/− and WT mice to determine (D) RVID (n = 8 or 9 per group), (E) right ventricle divided by the sum of left ventricle and septum (RV/[LV + S]) (n = 10 per group), and (F) RV/tibia length (mg/mm) (n = 10 per group). (G) Representative pulmonary artery Doppler ultrasound of LKB1ec−/− and WT mice. The green arrow indicates the pulmonary artery internal diameter (PAID). Echocardiography followed by physiological measurements were performed on LKB1ec−/− mice and WT mice to determine the (H) pulmonary artery acceleration time (PAAT) to pulmonary artery ejection time (PAET) ratio (n = 6 or 7 per group), (I) PAID (n = 4 or 5 per group), and (J) pulmonary vascular resistance index (PVRI) (n = 4 or 5 per group). (K) Representative EM images of mitochondria in ECs of the lungs from WT and LKB1ec−/− mice. Blue arrows marks unshedding MDVs. Scale bars, 600 nm in left panel; 200 nm in right panel. (L) MDV quantification in pulmonary ECs isolated from LKB1ec−/− and WT mice (n = 6 or 7 per group). (M) Western blot analysis of MFN1, MFN2, OPA1, Drp1, Fis1, and β-actin in pulmonary ECs from LKB1ec−/− and WT mice. Representative blots from four independent experiments are presented. Data are presented as the mean ± SEM. Exact significance values were displayed when P ⩾ 0.001, and denoting significance with *P < 0.001.
Figure 5.
Figure 5.
Intratracheal delivery of LKB1 ameliorates PH and restores mitochondrial morphology and MDV shedding in vivo. (A) Representative immunohistochemical staining of LKB1 (3,3′-diaminobenzidine [DAB] staining, brown) in pulmonary arteries (pink arrows; n = 5 per group). The nucleus was visualized with hematoxylin (blue). Scale bar, 50 μm. (B) Representative hematoxylin and eosin staining of lung sections and quantification of the medial index (n = 6–9 per group) from vehicle or treated rats. Scale bar, 50 μm. (C) Quantification of nonmuscularized (medial index, <25%), partially muscularized (25% ⩽ medial index ⩽ 75%), and fully muscularized (medial index, >75%) arteries as a percentage of the total alveolar wall and duct arteries from vehicle or treated rats. Quantification of (D) PAAT/PAET ratio (n = 8 or 9 per group), (E) RVSP (n = 6–9 per group), (F) RV/(LV + S) (n = 8–10 per group), and (G) PVRI (n = 5–10 per group) from vehicle or treated rats. (H) Representative EM images of mitochondria and quantification of mitochondrial diameter in pulmonary ECs of vehicle or treated rats (n = 8 independent experiments). Blue arrows mark mitochondria. Scale bar, 600 nm. Data are presented as the mean ± SEM. Exact significance values were displayed when P ⩾ 0.001, and denoting significance with *P < 0.001. H&E = hematoxylin and eosin.

Comment in

Similar articles

Cited by

References

    1. Maron BA, Abman SH, Elliott CG, Frantz RP, Hopper RK, Horn EM, et al. Pulmonary arterial hypertension: diagnosis, treatment, and novel advances. Am J Respir Crit Care Med . 2021;203:1472–1487. - PMC - PubMed
    1. George MP, Gladwin MT, Graham BB. Exploring new therapeutic pathways in pulmonary hypertension. Metabolism, proliferation, and personalized medicine. Am J Respir Cell Mol Biol . 2020;63:279–292. - PMC - PubMed
    1. Dhanasekaran A, Kotamraju S, Kalivendi SV, Matsunaga T, Shang T, Keszler A, et al. Supplementation of endothelial cells with mitochondria-targeted antioxidants inhibit peroxide-induced mitochondrial iron uptake, oxidative damage, and apoptosis. J Biol Chem . 2004;279:37575–37587. - PubMed
    1. Diebold I, Hennigs JK, Miyagawa K, Li CG, Nickel NP, Kaschwich M, et al. BMPR2 preserves mitochondrial function and DNA during reoxygenation to promote endothelial cell survival and reverse pulmonary hypertension. Cell Metab . 2015;21:596–608. - PMC - PubMed
    1. Suresh K, Servinsky L, Jiang H, Bigham Z, Zaldumbide J, Huetsch JC, et al. Regulation of mitochondrial fragmentation in microvascular endothelial cells isolated from the SU5416/hypoxia model of pulmonary arterial hypertension. Am J Physiol Lung Cell Mol Physiol . 2019;317:L639–L652. - PMC - PubMed

Substances