. 2023 Sep 26;42(9):113105.
doi: 10.1016/j.celrep.2023.113105. Epub 2023 Sep 19.

Laboratory evolution, transcriptomics, and modeling reveal mechanisms of paraquat tolerance

Affiliations

Laboratory evolution, transcriptomics, and modeling reveal mechanisms of paraquat tolerance

Kevin Rychel et al. Cell Rep. .

Abstract

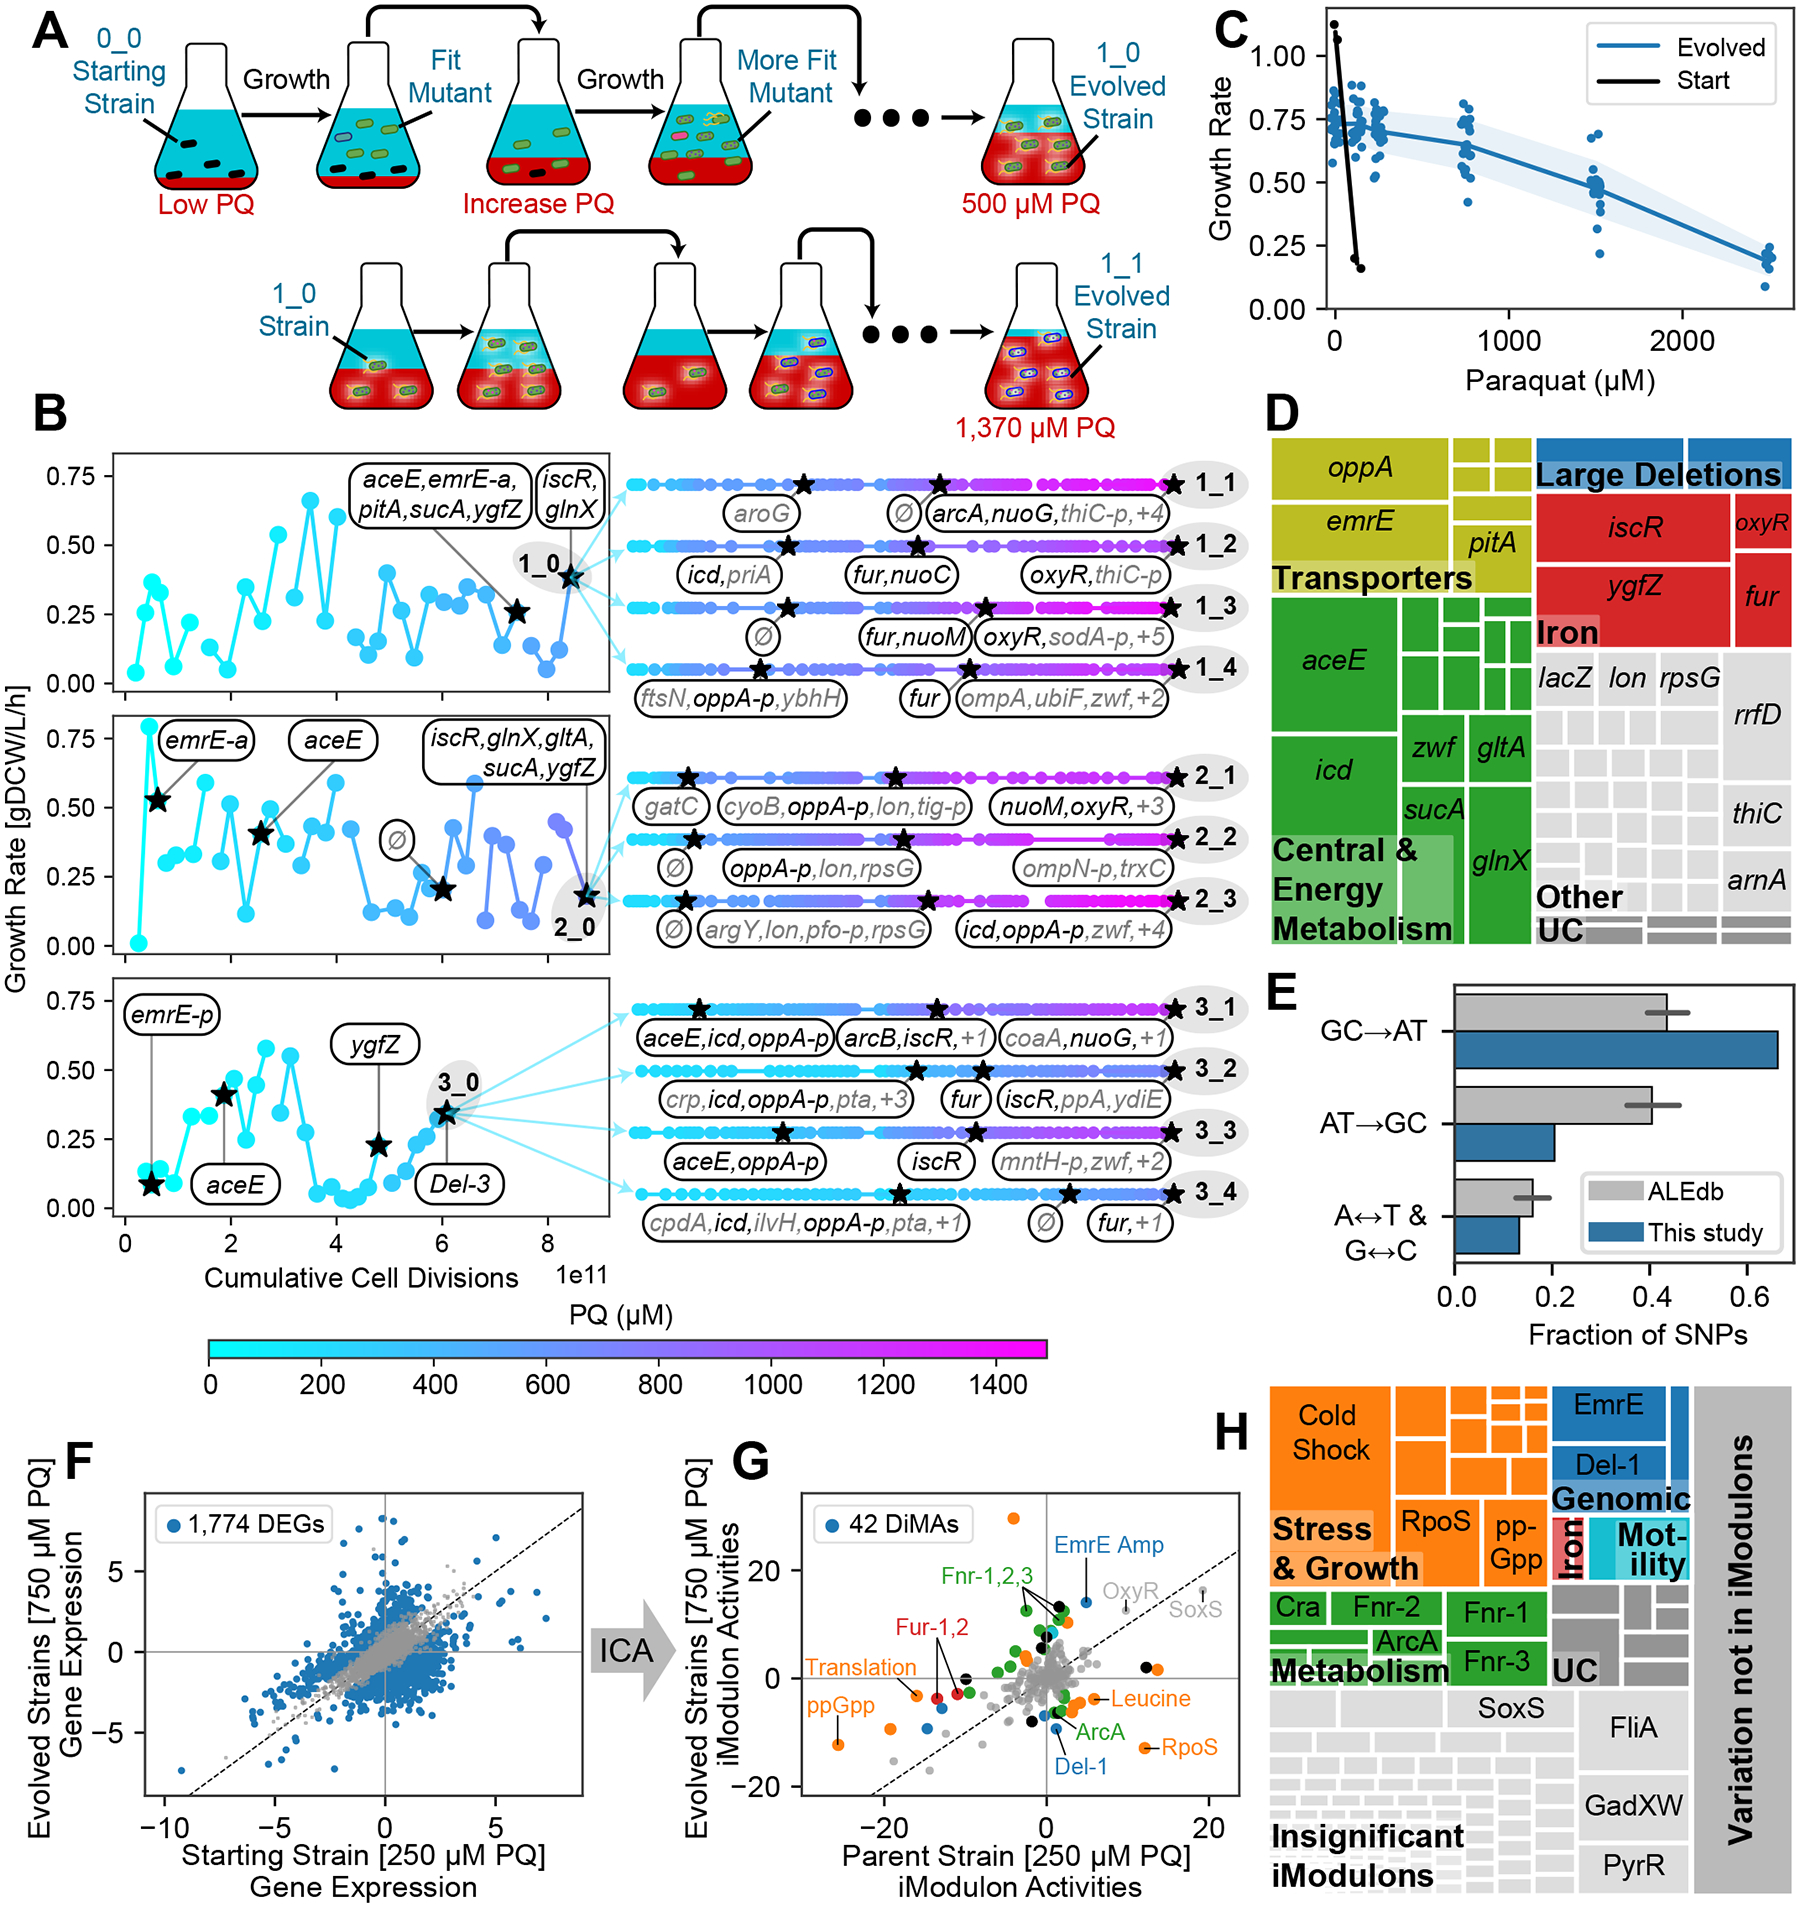
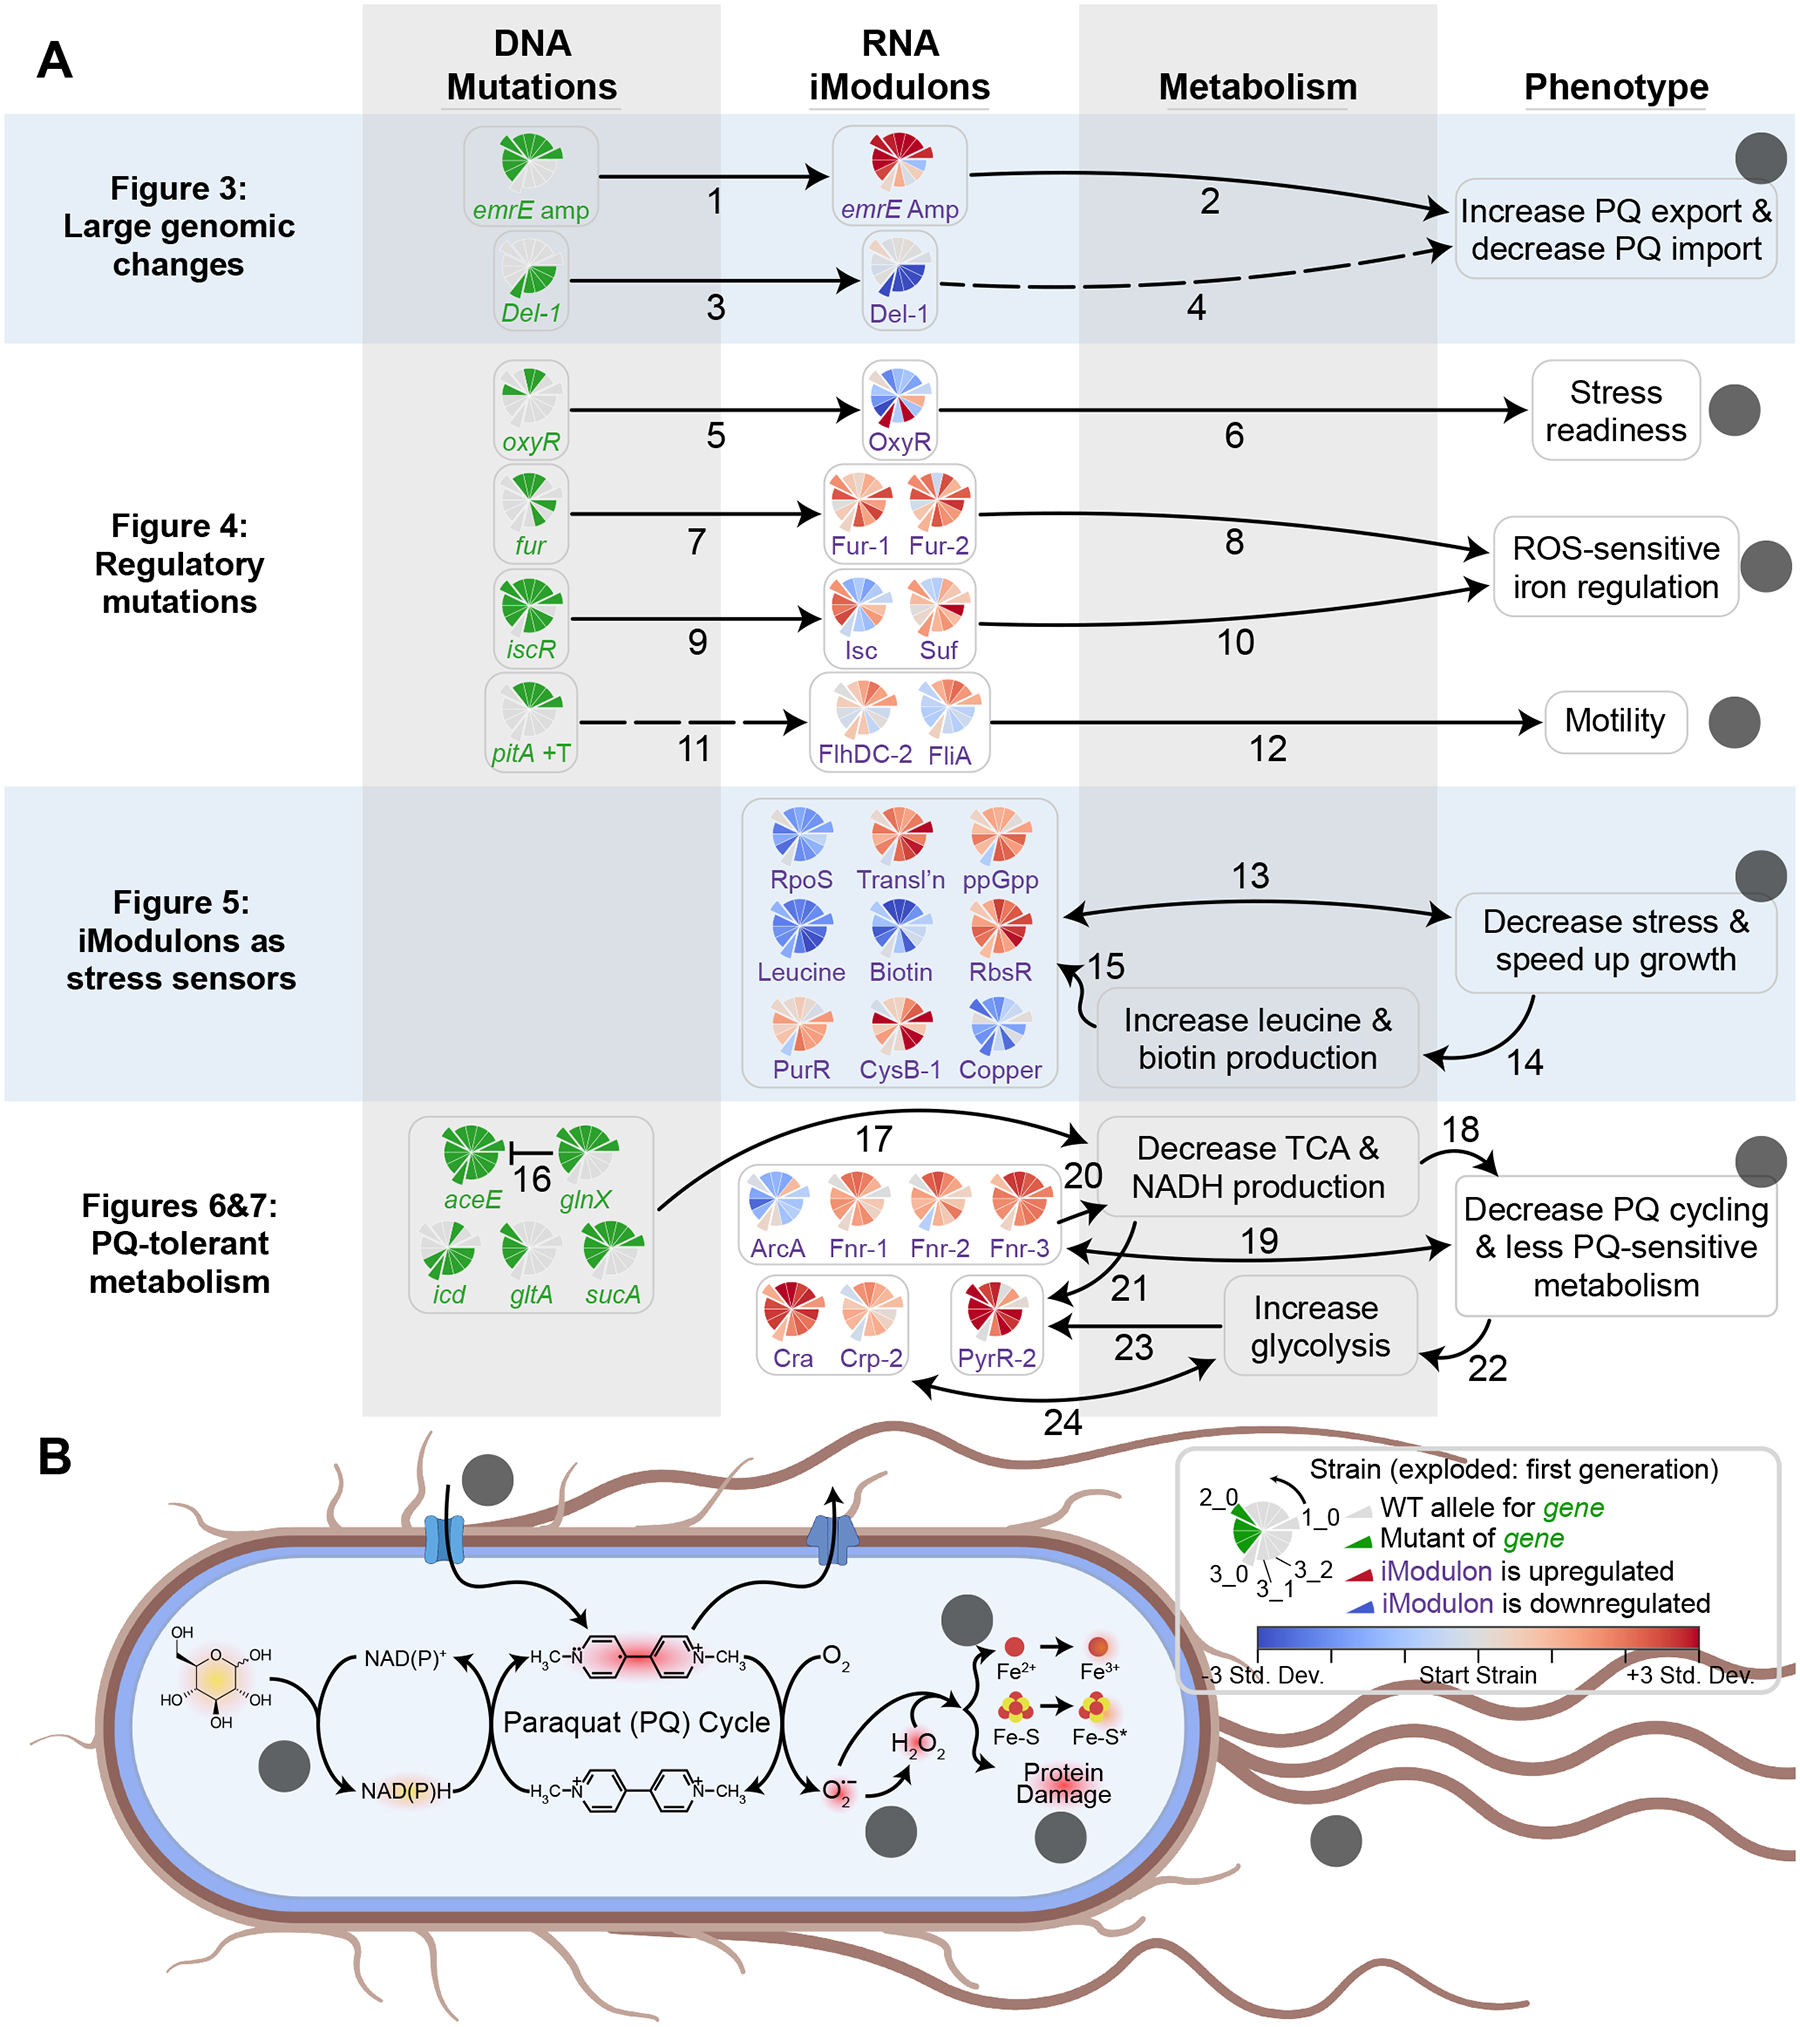
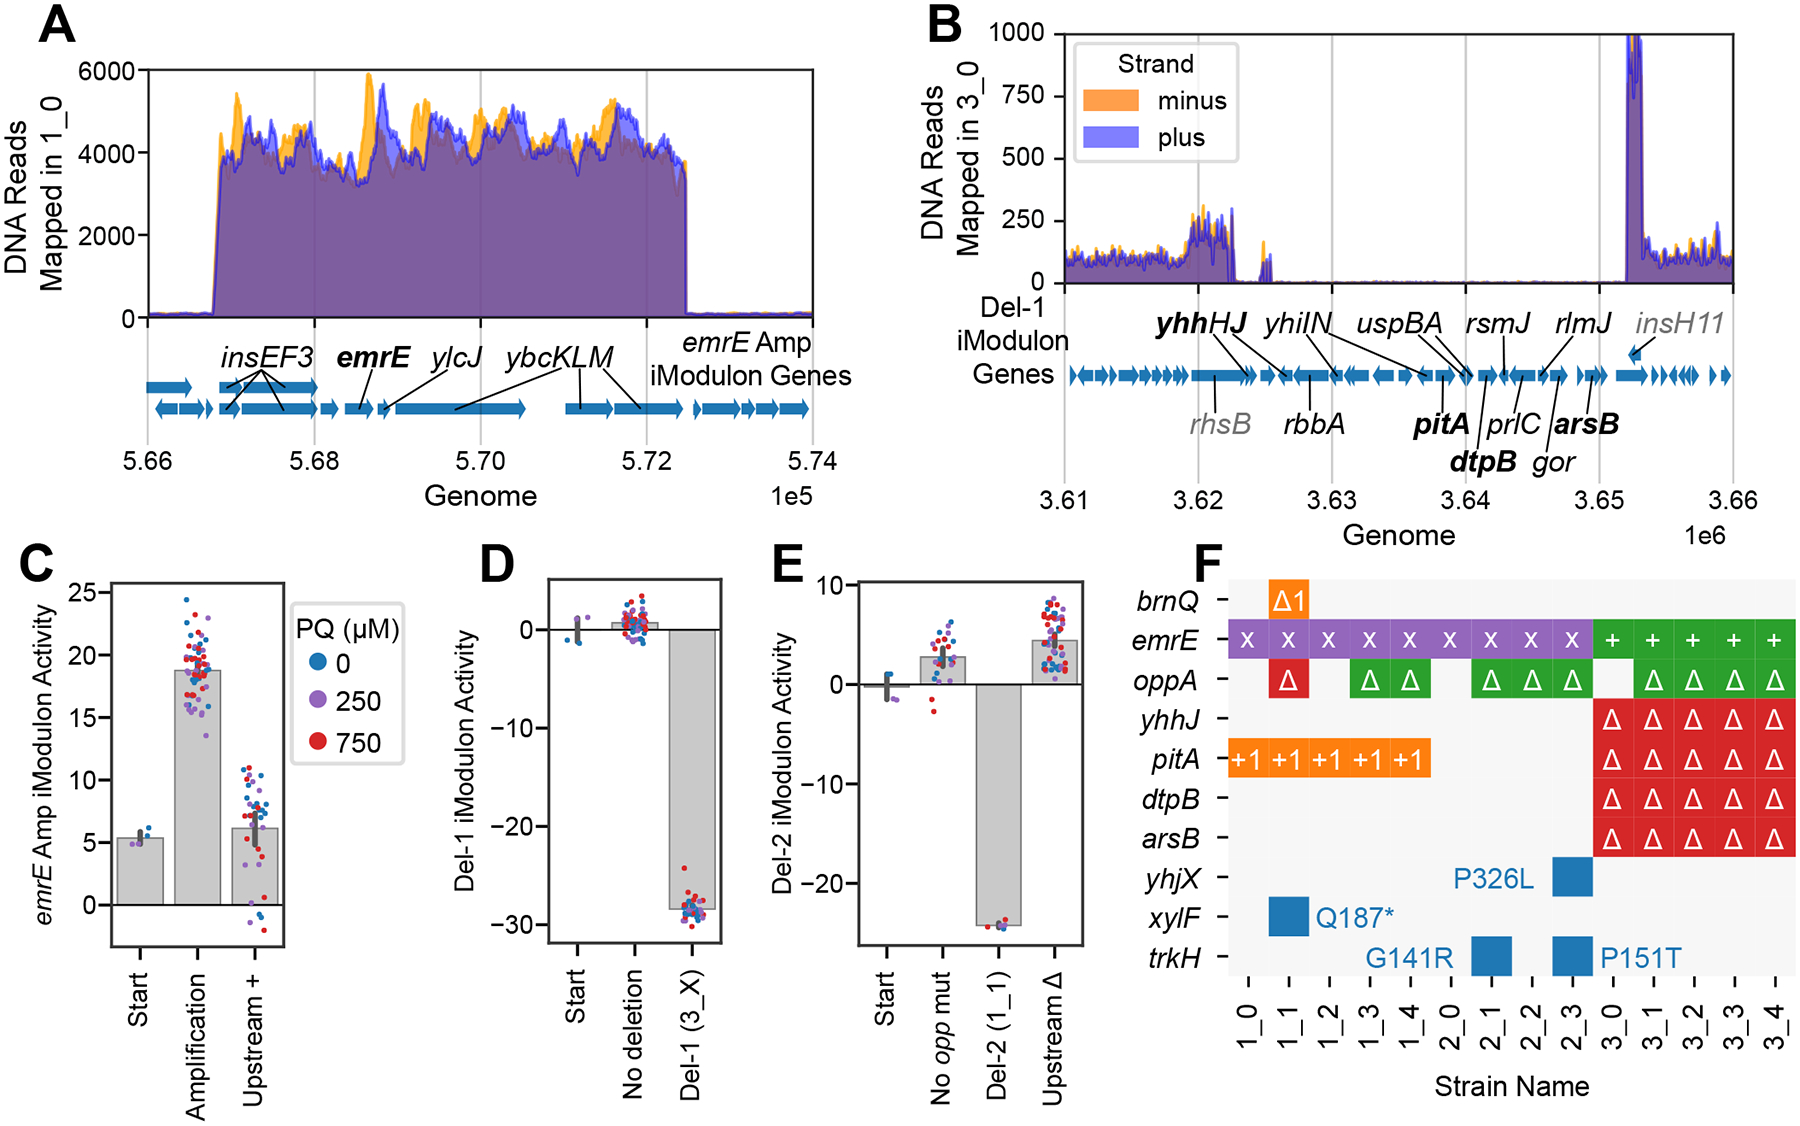
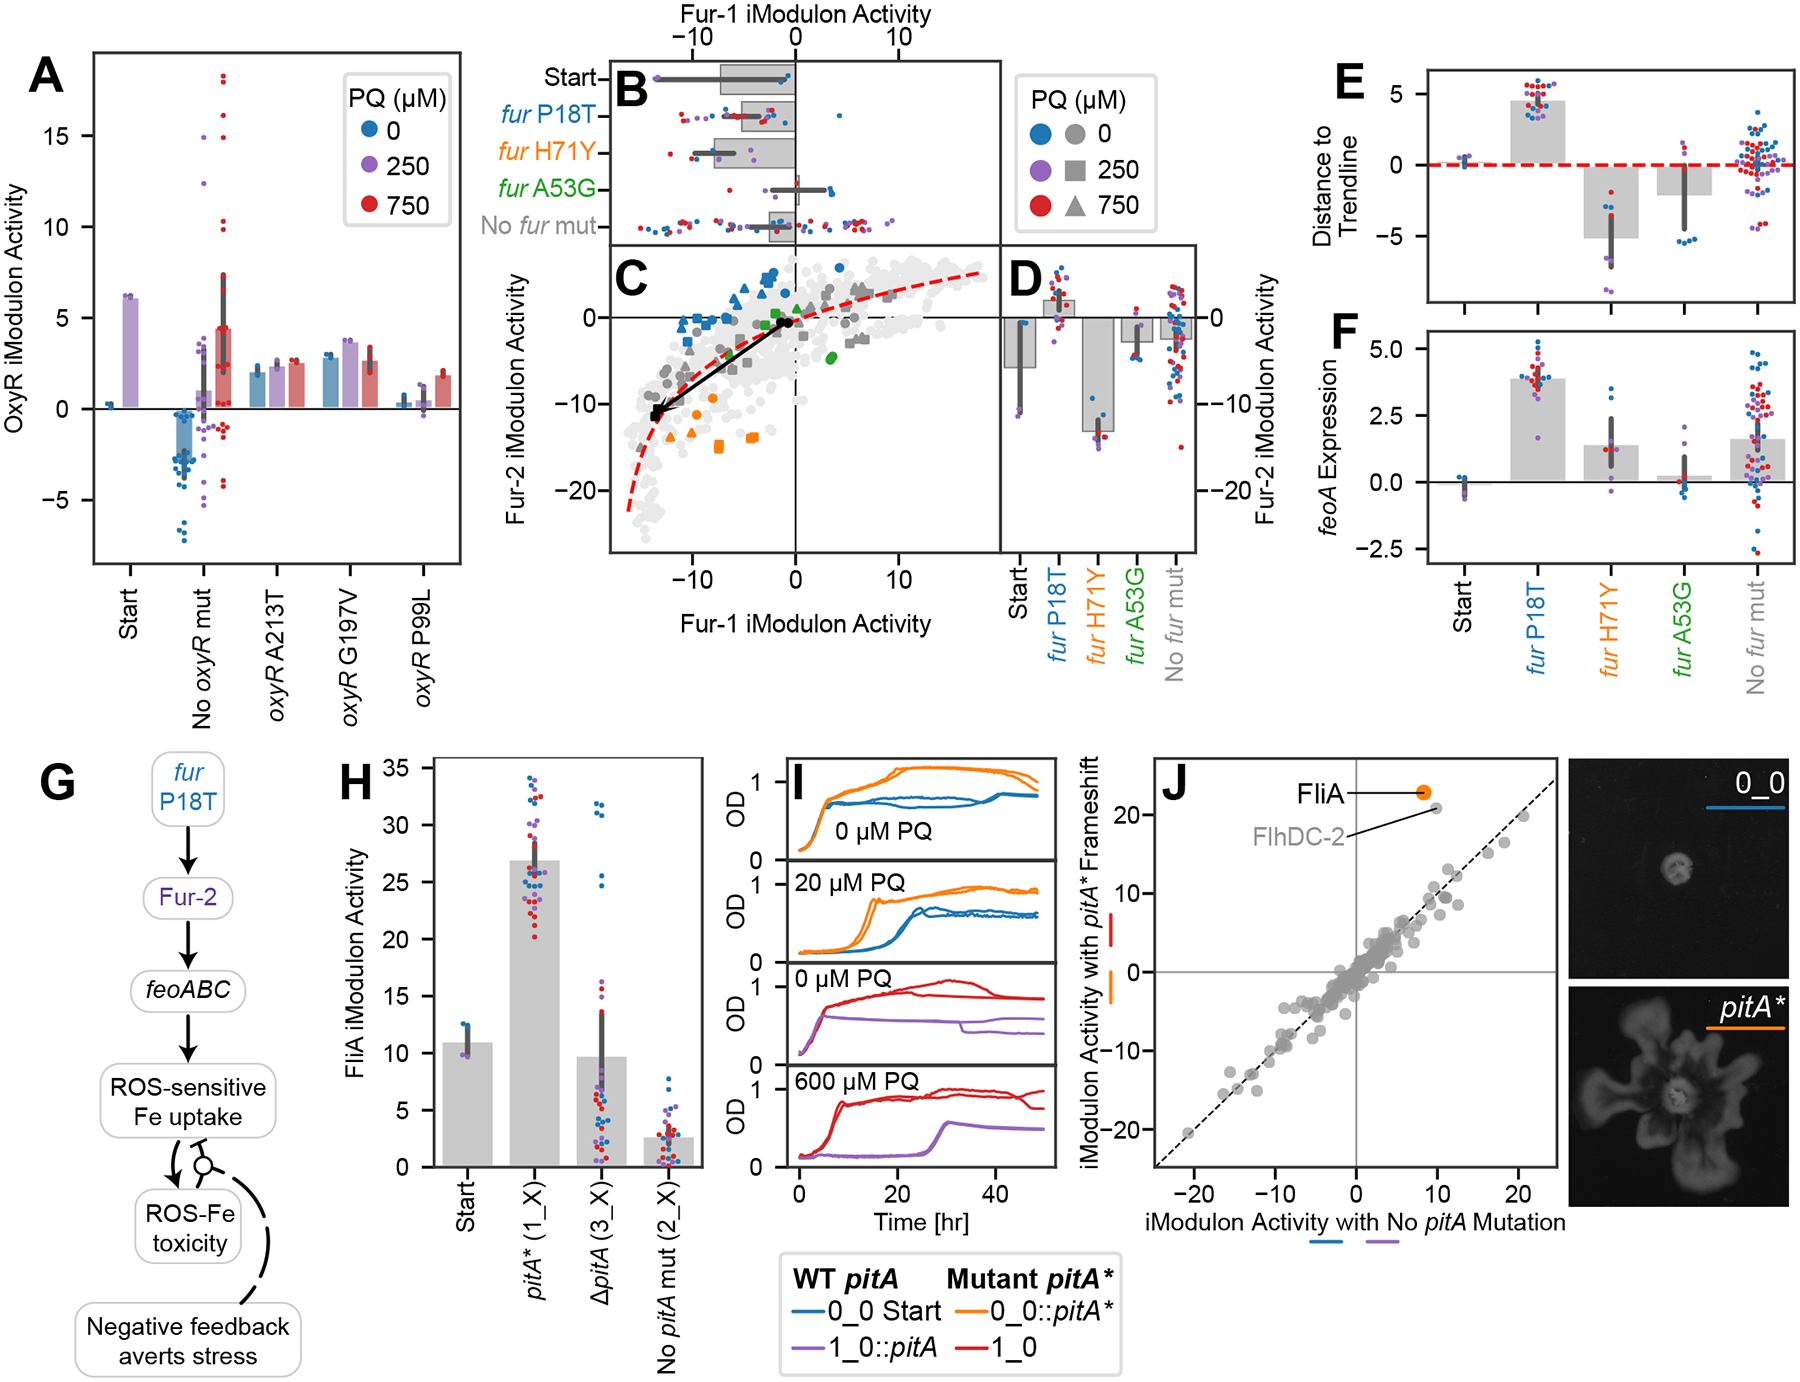
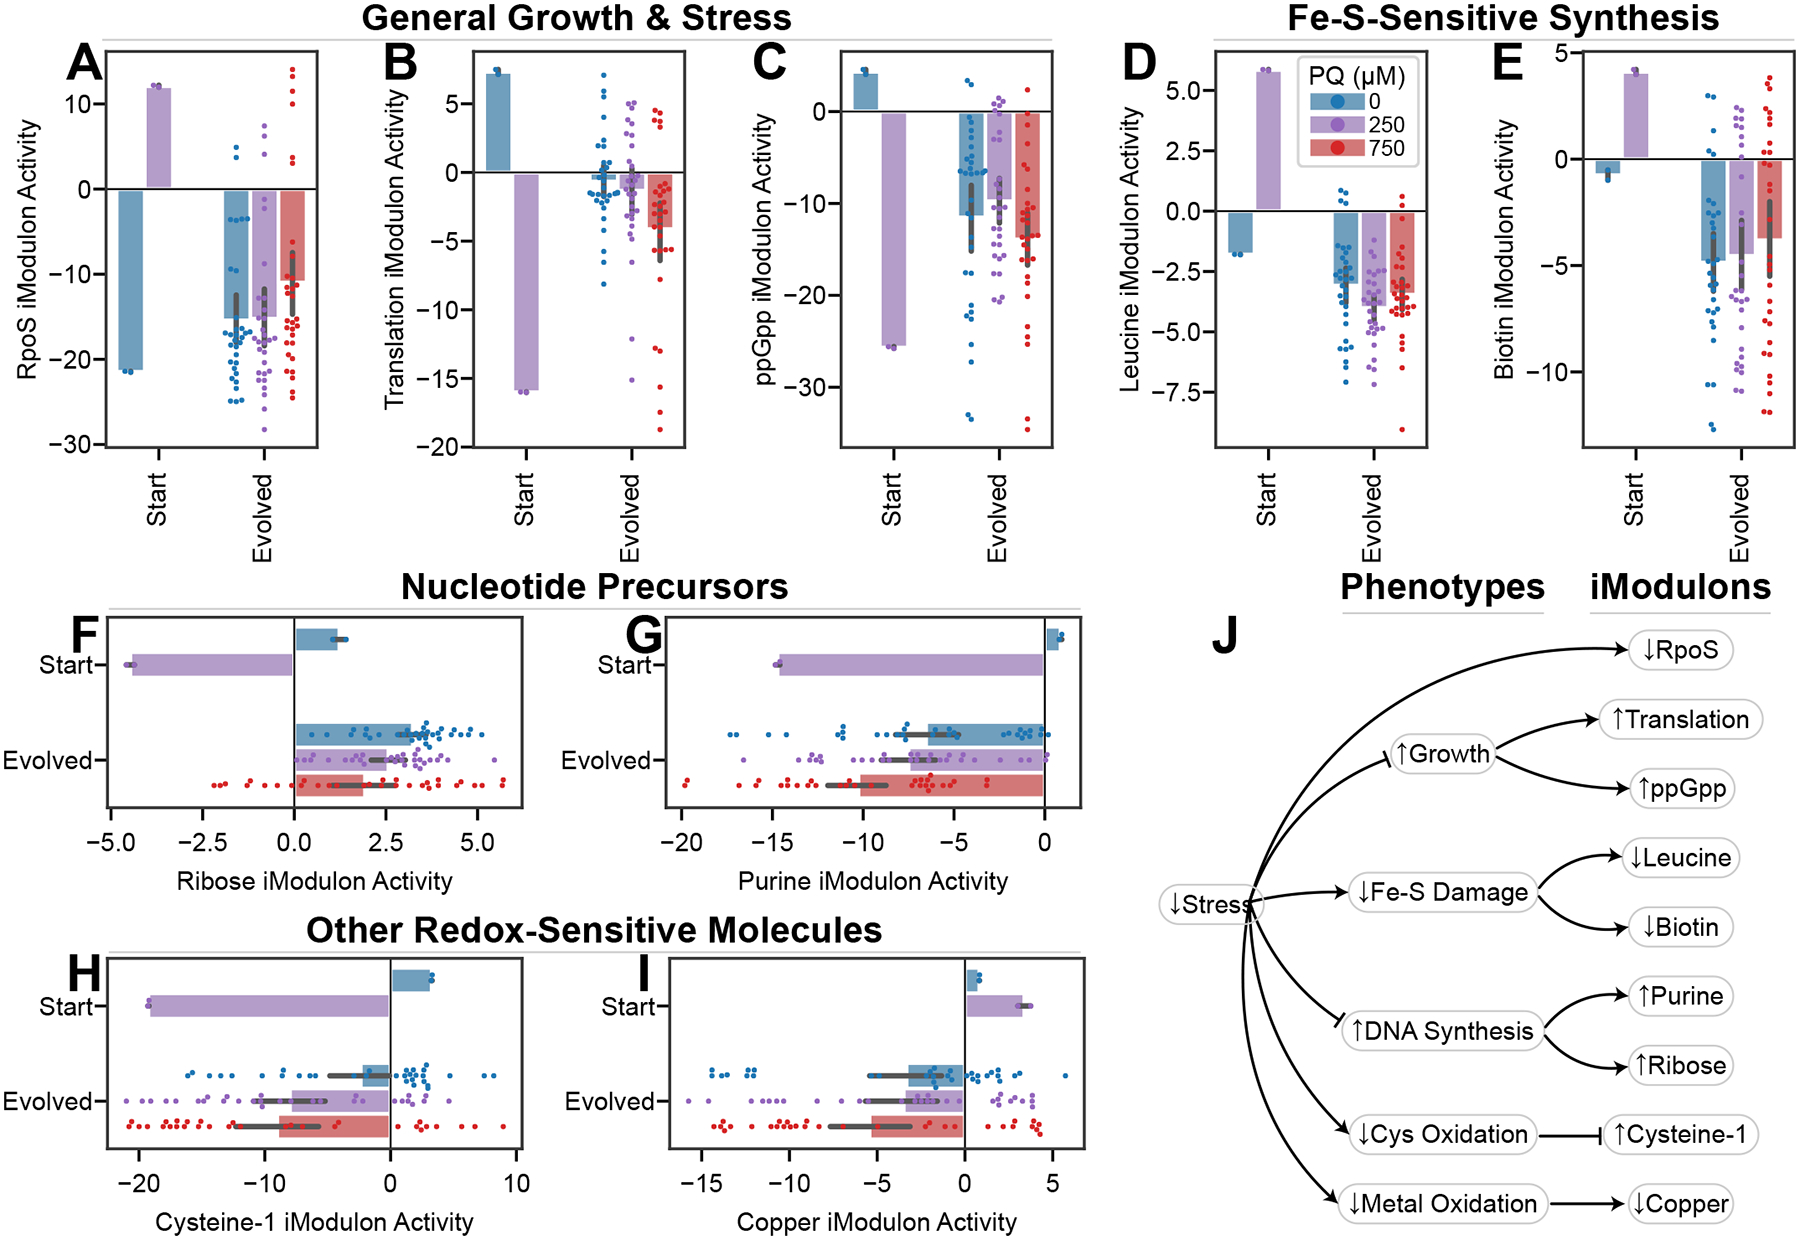
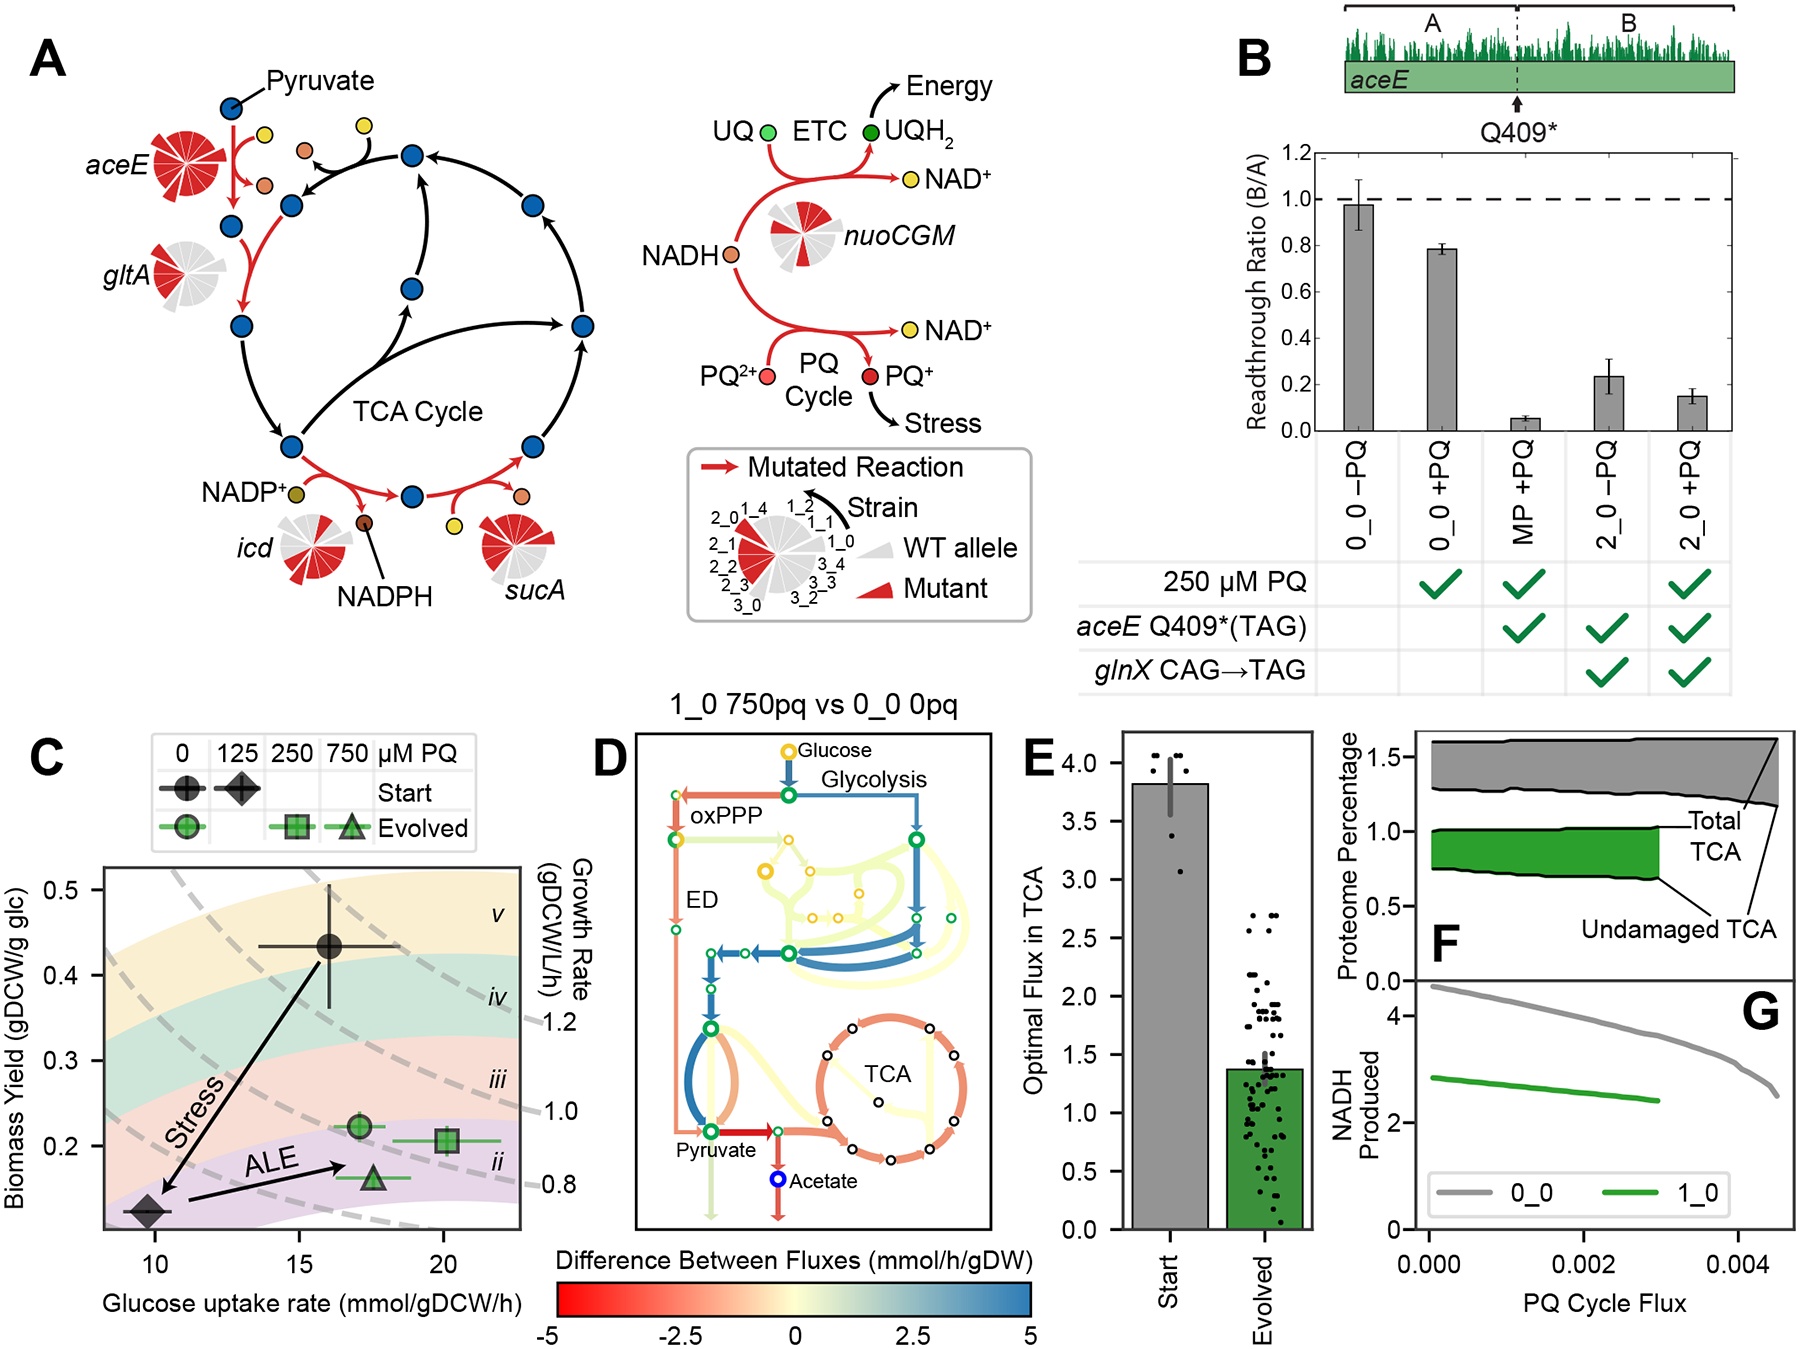
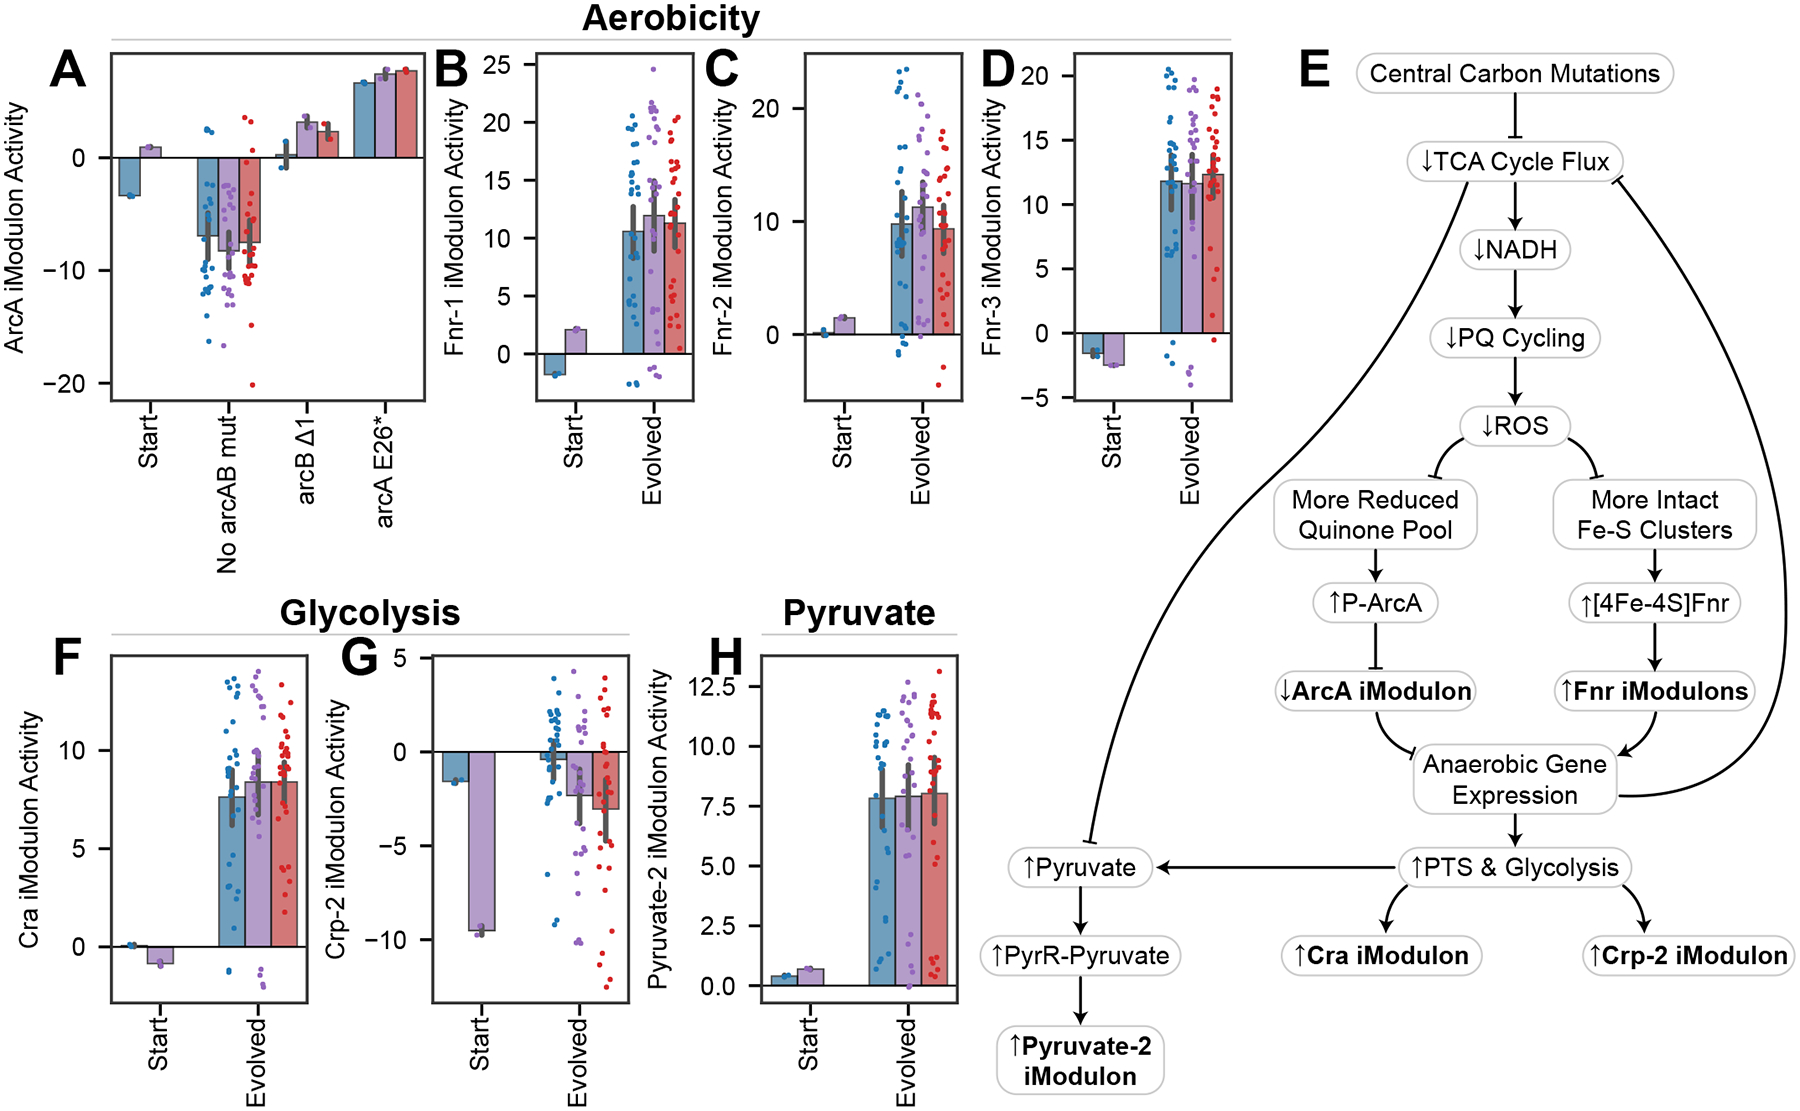
Relationships between the genome, transcriptome, and metabolome underlie all evolved phenotypes. However, it has proved difficult to elucidate these relationships because of the high number of variables measured. A recently developed data analytic method for characterizing the transcriptome can simplify interpretation by grouping genes into independently modulated sets (iModulons). Here, we demonstrate how iModulons reveal deep understanding of the effects of causal mutations and metabolic rewiring. We use adaptive laboratory evolution to generate E. coli strains that tolerate high levels of the redox cycling compound paraquat, which produces reactive oxygen species (ROS). We combine resequencing, iModulons, and metabolic models to elucidate six interacting stress-tolerance mechanisms: (1) modification of transport, (2) activation of ROS stress responses, (3) use of ROS-sensitive iron regulation, (4) motility, (5) broad transcriptional reallocation toward growth, and (6) metabolic rewiring to decrease NADH production. This work thus demonstrates the power of iModulon knowledge mapping for evolution analysis.

Keywords: CP: Microbiology; adaptive laboratory evolution; big data analytics; computational biology; oxidative stress; paraquat; systems biology; transcriptional regulatory networks; transcriptomics.


Conflict of interest statement

Declaration of interests The authors declare no competing interests.

Figures

Figure 1.
Figure 1.. ALE increases PQ tolerance via changes to the genome and transcriptome.
(A) Tolerization ALE process, showing mutant strains (cells with various appearances) in media with increasing stress concentrations (red). Example replicates are shown: 1_0 in the first generation and 1_1 in the second generation. (B) Points represent ALE flasks colored by PQ concentration. The first generation of ALEs (strains 1_0, 2_0, and 3_0) are shown with each flask’s growth rate in grams dry cell weight per liter per hour (gDCW/L/h). ‘Cumulative cell divisions’ are estimated from the growth rate and time elapsed. Stars represent flasks that underwent DNA sequencing, and newly mutated genes are shown. Black colored genes are discussed in detail. (C) Growth rate for each strain at each PQ concentration. The starting strain cannot grow at 250 μM PQ, whereas some evolved strains reach up to 2500 μM PQ. Evolved strains grow slower than the starting strain in the absence of PQ. (D) Treemap of mutations in all strains, grouped by gene with intergenic mutations assigned to nearest genes. UC: Uncharacterized. See Table S2, Methods. (E) Fraction of SNP types in this study compared with all public ALE studies on ALEdb (aledb.org; mean ± 95% confidence interval, n = 54). Each label corresponds to four of the twelve possible substitutions; for instance, “GC→AT” includes “G→A”, “G→T”, “C→A” and “C→T” substitutions. This study is enriched for mutations which decrease the GC content of the genome. (F-G) Comparison between the mean transcriptomes of the parent strain at 250 μM PQ vs. all evolved strains at 250 and 750 μM PQ. (F) DEG analysis with FDR = 0.1 and a minimum fold change of 0.78 (Methods), showing an intractably large number of DEGs. (G) Differential iModulon activity (DiMA) analysis, which compresses the differential transcriptomic changes into 42 DiMAs. DiMAs are colored by their category from panel (H). For more information about each iModulon, explore the PRECISE-1K E. coli dataset at iModulonDB.org and see Table S2. (H) Treemap of the explained variance of each iModulon in the transcriptome of the evolved strains (see Methods). The map is first broken into three parts: the colorful region, composed of iModulons that are differentially activated after the evolution and categorized, the light gray region composed of iModulons that do not show a significant trend with evolution, and the dark gray region, representing the error in the iModulon decomposition.
Figure 2.
Figure 2.. Multilevel approach reveals mechanisms of PQ tolerance.
(A) Knowledge graph summarizing multilevel relationships between mutations, iModulons, metabolism, and phenotypes. Pie charts appearing in the two left columns indicate prevalence of given changes to the genome and transcriptome (legend in panel B), where wedges indicate strains. The protruding wedges correspond to the first generation of ALEs, with the wedges counterclockwise to them being their second generation descendants. For genes, green indicates the strain has mutations affecting it or its promoter. For iModulons, colors indicate the difference between the iModulon activity in the strain at 750 μM PQ and the starting strain at 250 μM PQ, normalized to the standard deviation of the iModulon activity across all of PRECISE-1K. Solid arrows represent hypothetical relationships with extensive experimental evidence, whereas dashed lines represent relationships for which there is little existing literature. Each arrow is labeled with a numeral corresponding to a row in Table S4 that describes the meaning, data evidence, literature evidence, and novelty of the corresponding relationship. (B) Phenotypic changes target specific processes involved in PQ and ROS stress. Lowercase letters indicate elements from the rightmost column of (A). Entities which glow are reduced, and red indicates stress-related molecules.
Figure 3.
Figure 3.. Consequences of deletions and amplifications affecting membrane transport are found in both genomes and transcriptomes.
(A) Number of reads mapped to the region around emrE in strain 1_0, which is representative of strains containing the emrE amplification. Genes in the iModulon are labeled. (B) Number of reads from strain 3_0 mapped in the region of Del-1. Del-1 iModulon genes are shown in black, with flanking non-deleted, non-iModulon genes in gray, and transporters in bold. (C-E) iModulon activities for selected genomic iModulons. Bars indicate mean ± 95% confidence interval. Individual samples are color-coded by PQ concentration. Upstream + and Δ indicate insertions and deletions, respectively. (F) Color-coded table showing all observed mutations related to transporter genes. Purple x: amplification; green: upstream insertion (+) or deletion (Δ); blue: indicated SNP; orange: frameshift mutation within gene; red delta: complete gene deletion (See Table S2 for more details on each mutation).
Figure 4.
Figure 4.. Mutations regulate stress response, iron metabolism, and motility iModulons in novel ways.
Bars indicate mean ± 95% confidence interval. (A) OxyR iModulon activity is correlated with PQ in starting and evolved strains (Pearson R = 0.47, p = 6.2*1−5), except for the three strains which mutated oxyR. PQ colors in the legend also apply to panels (B, D, E-F, H). (B-D) Scatter plot of Fur-1 and Fur-2 iModulon activities with bar plots sharing axes. Light gray dots indicate other samples from PRECISE-1K. In (C), samples are colored by relevant mutations, and shapes indicate PQ concentrations according to the legends. A black arrow connects the starting strain samples between 0 and 250 μM PQ. In bar plots, point colors indicate PQ concentrations and label colors match with the scatter plots. The red trend line is a logarithmic curve fit to all samples in PRECISE-1K. Samples with the P18T mutation are above the trend line, indicating a preference for Fur-2. (E) Distances from each sample in this study to the trend line in (B), more clearly showing the preference for Fur-2 induced by P18T. (F) feoA expression, which is representative of the feoABC operon. Genes are upregulated by the fur P18T mutation. (G) Knowledge graph linking fur mutation to negative feedback which averts stress. (H) FliA iModulon activities by pitA mutation, showing an upregulation in the case of the frameshift pitA*, but not in the case of pitA deletion. (I) Growth curves for strains with and without the pitA* mutation as the only difference. The mutation contributes to higher final ODs under no stress, and shorter lag and faster growth under stress. (J) DiMA for strains 0_0 and 1_0 with and without the pitA frameshift mutation under PQ stress. Points indicate the mean of all relevant samples (individual conditions in duplicate; n=6 per axis). The strains with the mutation significantly activate FliA, one of the motility iModulons. The point near FliA is FlhDC-2, the other major motility iModulon. (K) Representative images of swarming in the 0_0 strain with (bottom) and without (top) the pitA* frameshift. Scale bars: 1 cm. Additional plots: Figure S1; Images for all swarming experiments: Figure S2.
Figure 5.
Figure 5.. Changes to stress and growth explain the changes to activity in several iModulons.
Mean iModulon activities ± 95% confidence interval; all plots use the legend in (D). P-values are false discovery rate corrected p-values from a DiMA comparison of stressed transcriptomes (250 and/or 750 μM PQ) between 0_0 and evolved strains. (A) RpoS activity, the general stress response, is downregulated (p = 0.017). (B) The Translation iModulon, ribosomes and translation machinery, is upregulated (p = 0.023). (C) The ppGpp iModulon, with many growth-related functions, follows a similar pattern to the Translation iModulon (p = 0.027). (D) The Leucine iModulon, which responds to leucine concentrations downstream of an Fe-S-dependent synthesis pathway, is downregulated after evolution, suggesting improved Fe-S metabolism (p = 0.0017). (E) The Biotin iModulon is downregulated after evolution. Biotin also depends on Fe-S-dependent synthesis (q = 0.017). (F-I) Ribose (p = 0.011), Purine (p = 0.036), Cysteine-1 (p = 0.025), and Copper (p = 0.034) iModulon activities behave differently in starting and evolved strains (Supplementary Data S1 – Note S5). (L) Knowledge graph connecting decreased oxidative stress to each of the iModulon changes shown.
Figure 6.
Figure 6.. Mutations drive metabolic rerouting toward fermentation to avoid PQ cycling by decreasing NADH availability.
(A) Simplified metabolic map of the TCA cycle and fate of NADH. Reactions catalyzed by mutated enzymes are shown in red and labeled with a pie chart indicating which strains have a wild-type (WT) or mutant allele. First generation strains in the pie chart protrude, with their descendants following them counter-clockwise. (B) Ribosome readthrough ratio in aceE from ribosome profiling, means ± standard deviation, n = 3. The ratio B/A is the fraction of ribosomes bound downstream (B) vs. upstream (A) of the early amber stop codon (TAG) in aceE. The midpoint (MP) strain has aceE Q409* with WT glnX, whereas the 2_0 strain has both aceE Q409* and the glnX anticodon mutation that enables ribosomes to read through the amber stop codon. In evolved strains such as 2_0, PDH levels are decreased but not zero. (C) Aero-type plot computed from measured growth rates and glucose uptake rates, where points represent means ± SEM (strains in duplicate; black n = 2, green n = 26), with constant growth rate isoclines. Colored regions labeled with roman numerals are aero-type regions as defined previously. Cells switch to a lower aero-type with PQ and increase their glucose uptake after evolution. (D) Flux differences from the OxidizeME model, comparing the starting strain with no PQ and a representative evolved strain at high PQ. Model was constrained by growth rate, glucose uptake rate, and RNAseq data (Figure S4). (E) Each point represents a TCA cycle reaction in the constrained OxidizeME models; models of evolved strains predict lower TCA cycle fluxes. (F-G) OxidizeME model results in mmol/gDCW/h for 0_0 and 1_0, constrained by growth rate, glucose uptake rate, and RNA expression. (F) As PQ cycle flux increases, the damaged fraction (filled in) of the TCA cycle increases. (G) NADH production decreases with PQ, but is more sensitive in 0_0. 0_0 can also carry more PQ cycle flux.
Figure 7.
Figure 7.. Mutations and iModulon reallocation drive metabolic rerouting toward fermentation to avoid PQ cycling.
Bars indicate mean iModulon activities ±95% confidence interval. P-values are false discovery rate corrected p-values from a DiMA comparison of stressed transcriptomes (250 and/or 750 μM PQ) between 0_0 and evolved strains. (A) ArcA iModulon activities are mostly decreased after evolution, except in the case of mutations to arcAB (p = 0.035). ArcA contains aerobic metabolism genes. (B-D) Fnr controls three iModulons with anaerobic metabolism genes, all of which are upregulated (p = 0.034, 0.030, 0.023). (E) Knowledge graph describing changes in the evolved strains connecting central carbon mutations to anaerobic and glycolytic gene expression, which decreases TCA cycle flux and ROS generation. (F) The Cra iModulon, which contains glycolytic genes that are repressed by Cra, is upregulated (p = 0.017). (G) The Crp-2 iModulon, which controls phosphotransferase systems, is upregulated (p = 0.022). (H) The Pyruvate-2 iModulon is upregulated (p = 0.012).

Similar articles

Cited by

References

    1. Muir P, Li S, Lou S, Wang D, Spakowicz DJ, Salichos L, Zhang J, Weinstock GM, Isaacs F, Rozowsky J, et al. (2016). The real cost of sequencing: scaling computation to keep pace with data generation. Genome Biol. 17, 53. 10.1186/s13059-016-0917-0. - DOI - PMC - PubMed
    1. Seif Y, and Palsson BØ (2021). Path to improving the life cycle and quality of genome-scale models of metabolism. Cell Syst. 12, 842–859. 10.1016/j.cels.2021.06.005. - DOI - PMC - PubMed
    1. Yang L, Mih N, Anand A, Park JH, Tan J, Yurkovich JT, Monk JM, Lloyd CJ, Sandberg TE, Seo SW, et al. (2019). Cellular responses to reactive oxygen species are predicted from molecular mechanisms. Proc. Natl. Acad. Sci. U. S. A 116, 14368–14373. 10.1073/pnas.1905039116. - DOI - PMC - PubMed
    1. Yang JH, Wright SN, Hamblin M, McCloskey D, Alcantar MA, Schrübbers L, Lopatkin AJ, Satish S, Nili A, Palsson BO, et al. (2019). A White-Box Machine Learning Approach for Revealing Antibiotic Mechanisms of Action. Cell 177, 1649–1661.e9. 10.1016/j.cell.2019.04.016. - DOI - PMC - PubMed
    1. Subramanian I, Verma S, Kumar S, Jere A, and Anamika K (2020). Multi-omics Data Integration, Interpretation, and Its Application. Bioinforma. Biol. Insights 14, 1177932219899051. 10.1177/1177932219899051. - DOI - PMC - PubMed

Publication types

MeSH terms