. 2023 Sep 15;18(9):e0289492.
doi: 10.1371/journal.pone.0289492. eCollection 2023.

New insights in photodynamic inactivation of Leishmania amazonensis: A focus on lipidomics and resistance

Affiliations

New insights in photodynamic inactivation of Leishmania amazonensis: A focus on lipidomics and resistance

Fernanda V Cabral et al. PLoS One. .

Abstract

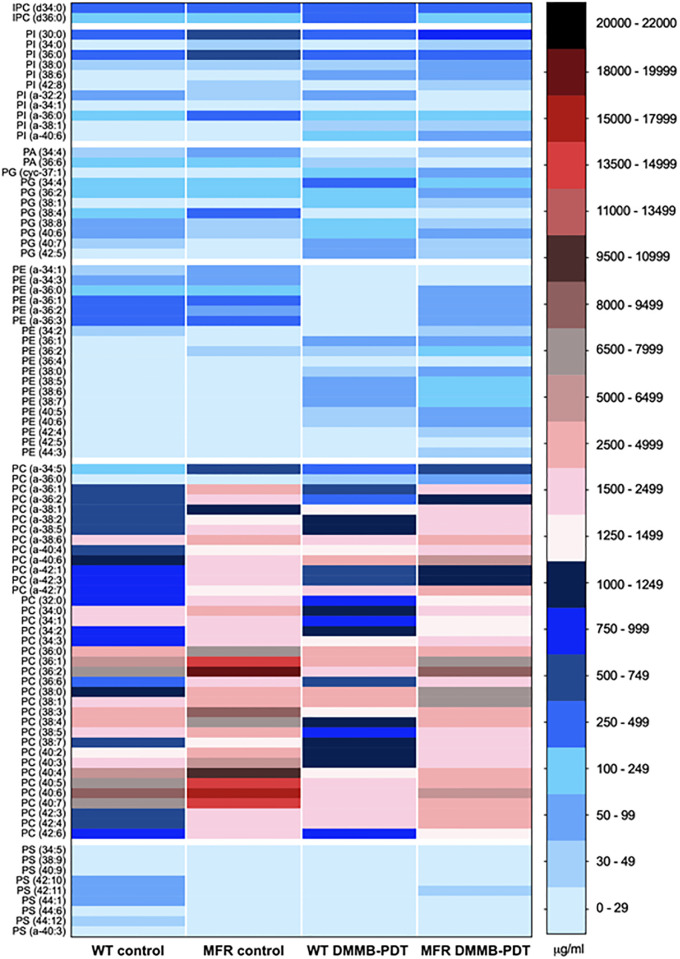
The emergence of drug resistance in cutaneous leishmaniasis (CL) has become a major problem over the past decades. The spread of resistant phenotypes has been attributed to the wide misuse of current antileishmanial chemotherapy, which is a serious threat to global health. Photodynamic therapy (PDT) has been shown to be effective against a wide spectrum of drug-resistant pathogens. Due to its multi-target approach and immediate effects, it may be an attractive strategy for treatment of drug-resistant Leishmania species. In this study, we sought to evaluate the activity of PDT in vitro using the photosensitizer 1,9-dimethyl methylene blue (DMMB), against promastigotes of two Leishmania amazonensis strains: the wild-type (WT) and a lab induced miltefosine-resistant (MFR) strain. The underlying mechanisms of DMMB-PDT action upon the parasites was focused on the changes in the lipid metabolism of both strains, which was conducted by a quantitative lipidomics analysis. We also assessed the production of ROS, mitochondrial labeling and lipid droplets accumulation after DMMB-PDT. Our results show that DMMB-PDT produced high levels of ROS, promoting mitochondrial membrane depolarization due to the loss of membrane potential. In addition, both untreated strains revealed some differences in the lipid content, in which MFR parasites showed increased levels of phosphatidylcholine, hence suggesting this could also be related to their mechanism of resistance to miltefosine. Moreover, the oxidative stress and consequent lipid peroxidation led to significant phospholipid alterations, thereby resulting in cellular dysfunction and parasite death. Thus, our results demonstrated that DMMB-mediated PDT is effective to kill L. amazonensis MFR strain and should be further studied as a potential strategy to overcome antileishmanial drug resistance.


Conflict of interest statement

The authors have declared that no competing interests exist.

Figures

Fig 1
Fig 1. DMMB absorption spectra.
Fig 2
Fig 2. Susceptibility of WT and MFR L. amazonensis promastigotes to (A) miltefosine at increasing concentrations (0–500 μM) and (B) DMMB-PDT.
Parasites were exposed to PDT at 50 J/cm2 and different concentrations of DMMB (0–3000 nM). Values represent mean ± SD.
Fig 3
Fig 3. Total ROS production using the fluorescent probe H2DCFDA in WT and MFR L. amazonensis promastigotes.
Parasites were treated with DMMB-PDT at 50 J/cm2 and DMMB at 750 nM. Untreated parasites were used as a negative control and H2O2 at 25 μM as a positive control. The levels of ROS produced only by DMMB at 750 nM was also assessed. ROS production was analyzed by two-way analysis of variance (ANOVA) followed by the Bonferroni post-test. The values shown represent the mean ± SD. * denotes statistically significant differences between strains when p < 0.05.
Fig 4
Fig 4. Differential interference contrast (DIC) and immunofluorescence staining images of WT and MFR L. amazonensis promastigotes treated with DMMB-PDT at 8 J/cm2 in the presence of 750 nM of DMMB.
A) Refers to WT untreated control stained directly after DMMB-PDT (WT control D). B) Refers to WT exposed to treatment and stained directly after DMMB-PDT (WT DMMB-PDT D). C) Refers to WT untreated control stained 1h after DMMB-PDT (WT control 1h). D) Refers to WT exposed to treatment and stained 1h after DMMB-PDT (WT DMMB-PDT 1h). E) Refers to MFR untreated control stained directly after DMMB-PDT (MFR control D). F) Refers to MFR exposed to treatment and stained directly after DMMB-PDT (MFR DMMB-PDT D). G) Refers to MFR untreated control stained 1h after DMMB-PDT (MFR control 1h). H) Refers to MFR exposed to treatment and stained 1h after DMMB-PDT (MFR DMMB-PDT 1h). Nuclei were stained with DAPI (blue fluorescence) and mitochondria were stained with Mito tracker red (red fluorescence) directly after PDT. N = Nuclei; k = Kinetoplast; M = Mitochondrion. Scale bar = 5 μm.
Fig 5
Fig 5. Differential interference contrast (DIC) and Nile Red and DAPI immunofluorescence staining, representative images of WT and MFR L. amazonensis promastigotes treated with PDT at 8 J/cm2 in the presence of 750 nM of DMMB.
A) Refers to WT untreated control stained directly after DMMB-PDT (WT control D). B) Refers to WT exposed to treatment and stained directly after DMMB-PDT (WT DMMB-PDT D). C) Refers to WT untreated control stained 1h after DMMB-PDT (WT control 1h). D) Refers to WT exposed to treatment and stained 1h after DMMB-PDT (WT DMMB-PDT 1h). E) Refers to MFR untreated control stained directly after DMMB-PDT (MFR control D). F) Refers to MFR exposed to treatment and stained directly after DMMB-PDT (MFR DMMB-PDT D). G) Refers to MFR untreated control stained 1h after DMMB-PDT (MFR control 1h). H) Refers to MFR exposed to treatment and stained 1h after DMMB-PDT (MFR DMMB-PDT 1h). Nuclei were stained with DAPI (blue fluorescence) and lipid droplets were stained with Nile red (red fluorescence) directly after PDT. LD = Lipid droplet. Scale bar = 5 μm.
Fig 6
Fig 6. Phospholipid analysis of WT and MFR L. amazonensis promastigotes treated with PDT at 8 J/cm2 in the presence of 750 nM of DMMB.
A-T represent the concentrations of some molecular species of the corresponding untreated and treated WT and MFR strains. PL class (IPC, PI, PA, PG, PE, PC and PS) was analyzed and quantified according to its corresponding internal “SPLASH” standard. “a” denotes statistically significant differences of PLs species compared to WT control. “b” denotes statistically significant differences of PLs species compared to MFR control. “c” denotes statistically significant differences of PLs species between WT DMMB- PDT and MFR DMMB-PDT.
Fig 7
Fig 7. Phospholipid analysis of WT and MFR L. amazonensis promastigotes treated with DMMB-PDT at 8 J/cm2 in the presence of 750 nM of DMMB.
Bar on the right side refers to a color scale of the concentration (μg/ml) of each molecular species related to the corresponding PL class (IPC, PI, PA, PG, PE, PC and PS). Each PL class was analyzed and quantified according to its corresponding internal “SPLASH” standard.

References

    1. Burza S, Croft SL, Boelaert M. Leishmaniasis. Lancet (London, England) 2018; 392(10151). - PubMed
    1. WHO. World Health Organization. Global Health Observatory (GHO). 2020. https://www.who.int/gho/neglected_diseases/leishmaniasis/en/.
    1. Reithinger R, Dujardin J-C, Louzir H, Pirmez C, Alexander B, Brooker S. Cutaneous leishmaniasis. The Lancet Infectious diseases 2007; 7(9). - PubMed
    1. Bailey F, Mondragon-Shem K, Haines LR, et al.. Cutaneous leishmaniasis and co-morbid major depressive disorder: A systematic review with burden estimates. PLoS Negl Trop Dis 2019; 13(2): e0007092. doi: 10.1371/journal.pntd.0007092 - DOI - PMC - PubMed
    1. Yanik M, Gurel MS, Simsek Z, Kati M. The psychological impact of cutaneous leishmaniasis. Clin Exp Dermatol 2004; 29(5): 464–7. doi: 10.1111/j.1365-2230.2004.01605.x - DOI - PubMed

Publication types