. 2023 Sep 15;18(9):e0285906.
doi: 10.1371/journal.pone.0285906. eCollection 2023.

The image-based ultrasonic cell shaking test

Affiliations

The image-based ultrasonic cell shaking test

Miranda Ballard et al. PLoS One. .

Abstract

Mechanical signals play a vital role in cell biology and is a vast area of research. Thus, there is motivation to understand cell deformation and mechanobiological responses. However, the ability to controllably deform cells in the ultrasonic regime and test their response is a noted challenge throughout the literature. Quantifying and eliciting an appropriate stimulus has proven to be difficult, resulting in methods that are either too aggressive or oversimplified. Furthermore, the ability to gain a real-time insight into cell deformation and link this with the biological response is yet to be achieved. One application of this understanding is in ultrasonic surgical cutting, which is a promising alternative to traditional methods, but with little understanding of its effect on cells. Here we present the image based ultrasonic cell shaking test, a novel method that enables controllable loading of cells and quantification of their response to ultrasonic vibrations. Practically, this involves seeding cells on a substrate that resonates at ultrasonic frequencies and transfers the deformation to the cells. This is then incorporated into microscopic imaging techniques to obtain high-speed images of ultrasonic cell deformation that can be analysed using digital image correlation techniques. Cells can then be extracted after excitation to undergo analysis to understand the biological response to the deformation. This method could aid in understanding the effects of ultrasonic stimulation on cells and how activated mechanobiological pathways result in physical and biochemical responses.


Conflict of interest statement

The authors have declared that no competing interests exist.

Figures

Fig 1
Fig 1. Schematic demonstrating the strain and displacement profile of a sample during ultrasonic excitation using the IBUS test.
Fig 2
Fig 2. Custom cell containment PMMA/PDMS devices.
(a) Assembled PMMA/PDMS custom device used as a vessel for cell culture. (b) Device prepared for calibration with DIC pattern.
Fig 3
Fig 3. PMMA calibration experimental setup using the IBUS test.
Fig 4
Fig 4. Common examples of image distortions.
(a) Regular grid. (b) Pincushion distortion. (c) Barrel distortion.
Fig 5
Fig 5. Images obtained of grids using the IBUCS imaging protocol with their accompanying histograms to show the difference in light.
(a) Grid imaged with phase contrast attachment. (b) Grid imaged without phase contrast attachment. (c) Histogram of grid imaged with phase contrast. (d) Histogram of grid imaged without phase contrast.
Fig 6
Fig 6. Phase maps produced from grids imaged using the IBUCS protocol to check for distortions.
Fig 7
Fig 7. Phase derivative maps of the grid images taken without phase contrast.
Fig 8
Fig 8. Phase derivative maps of the phase contrast grid images.
Fig 9
Fig 9. Schematics of substrate samples prepared to validate test assumptions.
(a) Phase map in x direction of grid imaged with phase contrast. (b) Phase map in y direction of grid imaged with phase contrast. (c) Phase map in x direction of grid imaged without phase contrast. (d) Phase map in y direction of grid imaged without phase contrast.
Fig 10
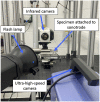
Fig 10. Images of IBUCS test setup adapted to image live cell deformation under microscopic conditions.
(a) Images of IBUCS test setup. (b) Close up of custom device under microscope.
Fig 11
Fig 11. PrestoBlue cell viability assay in the IBUCS Device compared with a cell culture flask.
Fig 12
Fig 12. Images of cells stained with Calcein AM after 12 (A), 24 (B) and 48 (C) hours.
Fig 13
Fig 13
Full-field maps of strain (a), displacement (b) and temperature increase (c) of PMMA during excitation. Strain amplitude of the sample over time can also be seen in d. Strain and displacement fields are plotted at the time when the specimen experiences the largest stretching at maximum amplitude, while the temperature represents the change after 1 s of excitation. This data was taken from calibration data using 20% sonotrode power. (a) Horizontal strain across PMMA during peak excitation. (b) Horizontal displacement across PMMA during peak excitation. (c) Temperature increase across PMMA during peak excitation. (d) Strain amplitude at central node over time.
Fig 14
Fig 14. Strain and temperature results from the PMMA calibration.
(a) Calibration of PMMA substrate to relate strain amplitude to sonotrode power. (b) Temperature increase at node during calibration over 1 second of excitation.
Fig 15
Fig 15. Image of cross-scratch specimen obtained using the IBUCS test.
Fig 16
Fig 16. Comparison of strain amplitude data obtained from scratch images compared with the PMMA calibration plotted with standard error measurements.
Fig 17
Fig 17. Labelled image of cells next to a scratch made in the substrate taken with IBUCS setup.
The video of this image can be found as S1 Video.
Fig 18
Fig 18. Displacement of cells adhered to the PMMA compared with the substrate scratch over time.
Fig 19
Fig 19. Static images extracted from videos of cell deformation obtained using the IBUCS protocol.
Videos can be found in supporting information.

References

    1. Mammoto T, Ingber DE, Mechanical control of tissue and organ development Development. 2010. May;137(9):1407–1420. doi: 10.1242/dev.024166 - DOI - PMC - PubMed
    1. Bader DL, Knight M M, Biomechanical analysis of structural deformation in living cells Medical & Biological Engineering & Computing. 2008. Aug;46:951–963. doi: 10.1007/s11517-008-0381-4 - DOI - PubMed
    1. Merkel M, Manning ML, Using cell deformation and motion to predict forces and collective behavior in morphogenesis Seminars in cell & development biology. 2017. Aug;67:161–169. doi: 10.1016/j.semcdb.2016.07.029 - DOI - PMC - PubMed
    1. O’Daly BJ, Morris E, Gavin GP, O’Byrne JM, McGuinness GB, High-power low-frequency ultrasound: A review of tissue dissection and ablation in medicine and surgery Journal of Materials Processing Technology. 2008. May;200:38–58. doi: 10.1016/j.jmatprotec.2007.11.041 - DOI
    1. Azuma Y, Ito M, Harada Y, Takagi H, Ohta T, Jingushi S, Low-intensity pulsed ultrasound accelerates rat femoral fracture healing by acting on the various cellular reactions in the fracture callus J Bone Miner Res. 2001. Apr;16:671–680. doi: 10.1359/jbmr.2001.16.4.671 - DOI - PubMed

Publication types