. 2023 Sep 15;18(9):e0290793.
doi: 10.1371/journal.pone.0290793. eCollection 2023.

Levels and in vitro functional effects of circulating anti-hinge antibodies in melanoma patients receiving the immune checkpoint inhibitor pembrolizumab

Affiliations

Levels and in vitro functional effects of circulating anti-hinge antibodies in melanoma patients receiving the immune checkpoint inhibitor pembrolizumab

Barry D Hock et al. PLoS One. .

Abstract

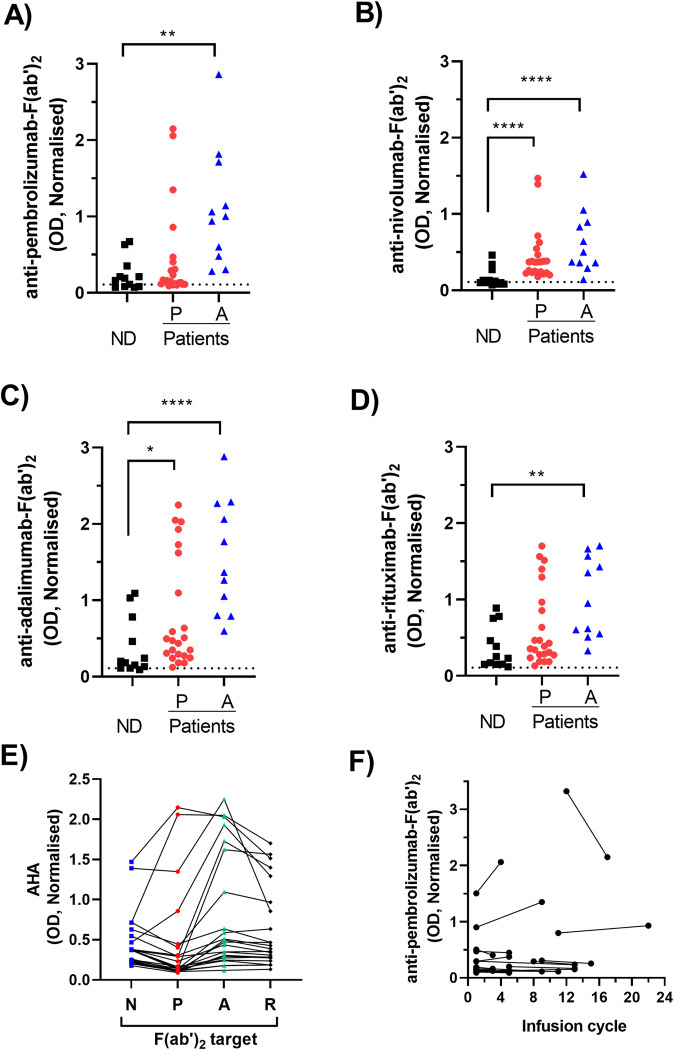
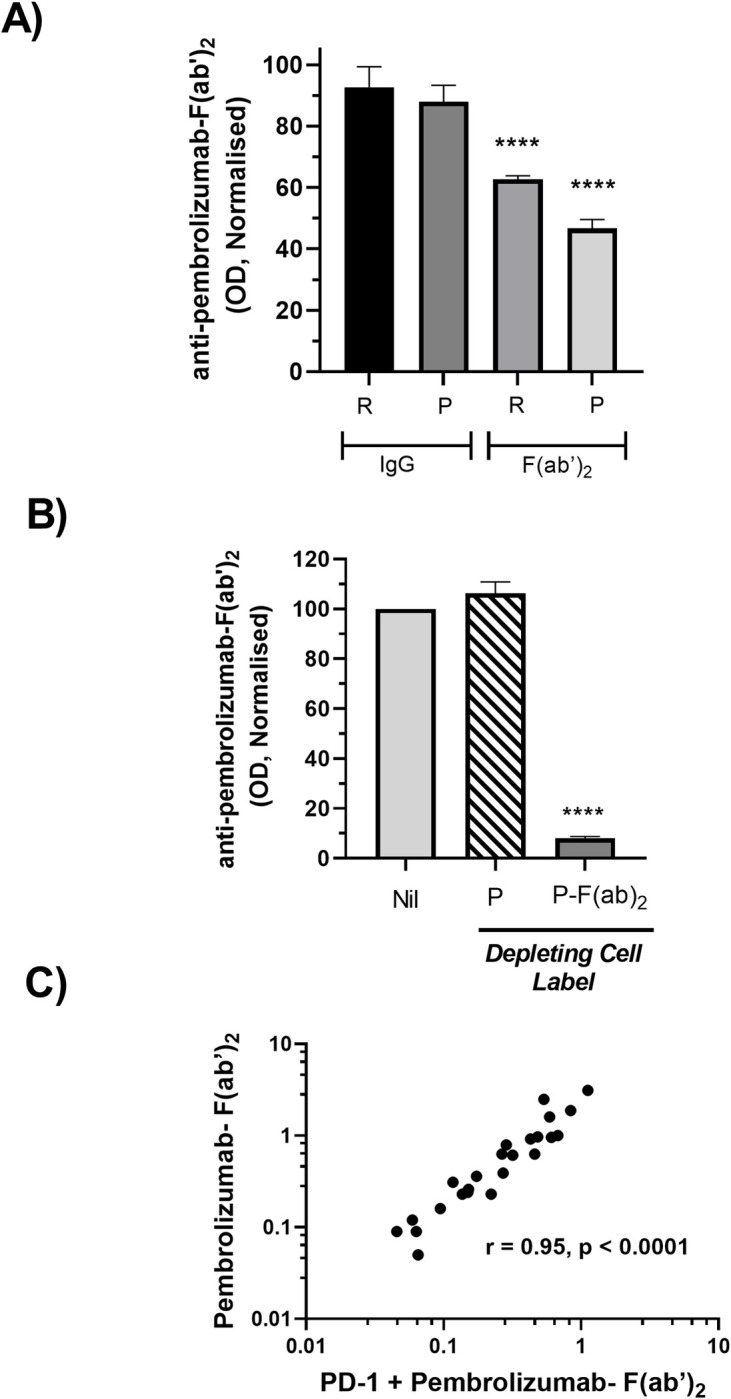
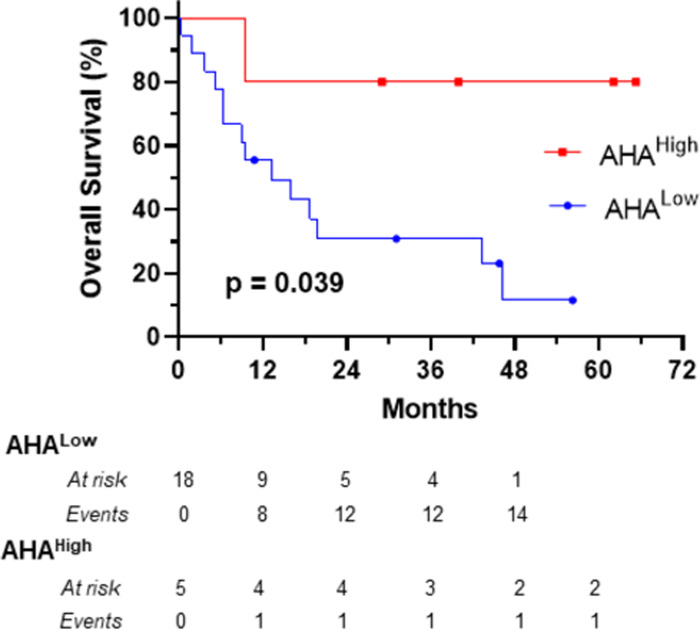
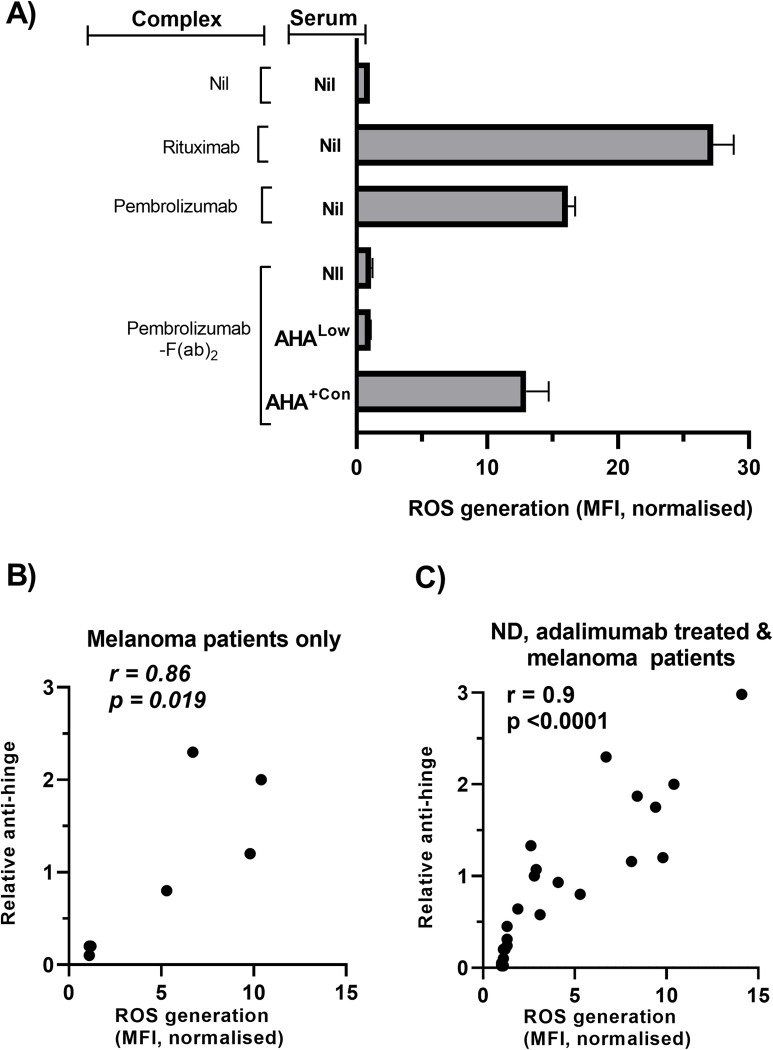
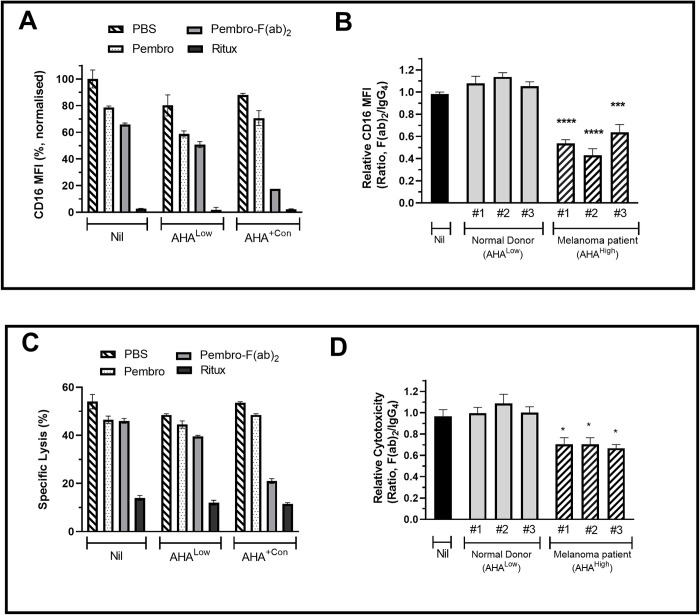
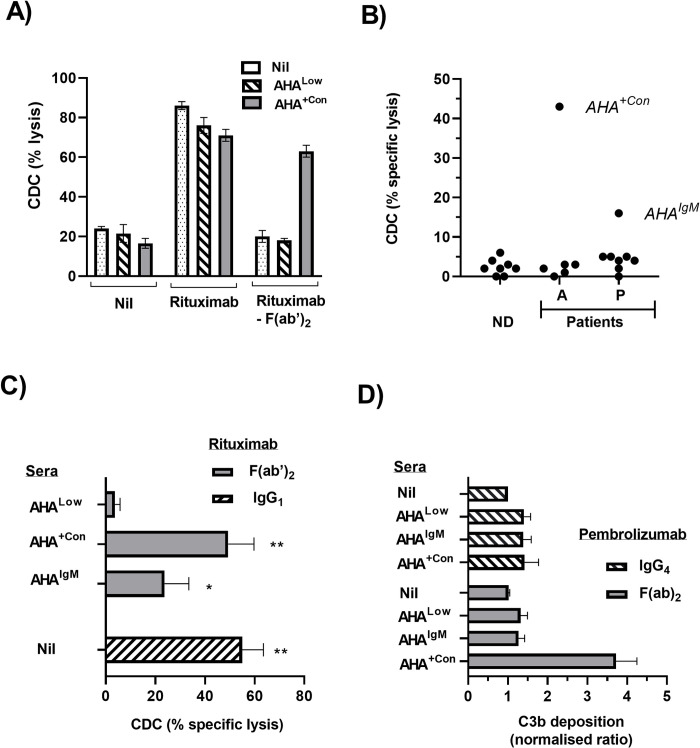
The efficacy of PD-1 monoclonals such as pembrolizumab can be modulated by the signals delivered via their Fc region. Tumour/inflammation associated proteases can generate F(ab')2 fragments of therapeutic monoclonals, and subsequent recognition of F(ab')2 epitopes by circulating anti-hinge antibodies (AHA) can then, potentially, link F(ab')2 binding to the target antigen with novel Fc signalling. Although elevated in inflammatory diseases, AHA levels in cancer patients have not been investigated and functional studies utilising the full repertoire of AHA present in sera have been limited. AHA levels in pembrolizumab treated melanoma patients (n = 23) were therefore compared to those of normal donors and adalimumab treated patients. A subset of melanoma patients and the majority of adalimumab patients had elevated levels of AHA reactive with F(ab')2 fragments of IgG4 anti-PD-1 monoclonals (nivolumab, pembrolizumab) and IgG1 therapeutic monoclonals (rituximab, adalimumab). Survival analysis was restricted by the small patient numbers but those melanoma patients with the highest levels (>75% percentile, n = 5) of pembrolizumab-F(ab')2 reactive AHA had significantly better overall survival post pembrolizumab treatment (p = 0.039). In vitro functional studies demonstrated that the presence of AHA+ sera restored the neutrophil activating capacity of pembrolizumab to its F(ab')2 fragment. Neither pembrolizumab nor its F(ab')2 fragments can induce NK cell or complement dependent cytotoxicity (CDC). However, AHA+ sera in combination with pembrolizumab-F(ab')2 provided Fc regions that could activate NK cells. The ability of AHA+ sera to restore CDC activity was more restricted and observed using only one pembrolizumab and one adalimumab patient serum in combination with rituximab- F(ab')2. This study reports the presence of elevated AHA levels in pembrolizumab treated melanoma patients and highlight the potential for AHA to provide additional Fc signaling. The issue of whether tumour associated proteolysis of PD-1 mAbs and subsequent AHA recognition impacts on treatment efficacy requires further study.


Conflict of interest statement

The authors have declared that no competing interests exist

Figures

Fig 1
Fig 1. Comparison of AHA levels in patients and controls.
Serum from normal donors [ND], adalimumab treated patients [A] and pembrolizumab treated patients [P] were analysed by ELISA for reactivity against F(ab’)2 fragments. All O.D’s measured by ELISA were normalised against the signal generated by a control serum reacting with pembrolizumab- F(ab’)2 on the same plate (mean O.D ±SD = 0.99±0.12). (A-D) Normalised AHA data are shown as a scatter plot of reactivity with the F(ab’)2 fragments of (A) pembrolizumab (B) nivolumab (C) adalimumab and (D) rituximab and the dotted line indicates the cut-point for positivity. Asterisks indicate a significant difference from ND levels following analysis of log transformed raw data by ANOVA in combination with Dunnett’s post hoc test (E) the F(ab’)2 reactivity of each pembrolizumab treated patient serum are shown as a line graph. Each line represents an individual serum and the columns correspond to the different F(ab’)2 targets nivolumab-F(ab’)2 [N], pembrolizumab-F(ab’)2 [P], adalimumab-F(ab’)2 [A] and rituximab-F(ab’)2 [R] (F) Levels of pembrolizumab- F(ab’)2 reactive AHA detected in serum collected from each pembrolizumab treated patient at two time points corresponding to the indicated treatment infusion cycle. Serum was collected immediately prior to infusion and therefore cycle 1 samples represent pre-treatment. Data from each individual patient are shown as a line linking two samples, with the later sample corresponding to that used throughout the rest of the study.
Fig 2
Fig 2. Specificity of AHA detection.
(A) Serum containing AHA (n = 3) were divided into aliquots and spiked with either nil, rituximab, rituximab- F(ab’)2, pembrolizumab or pembrolizumab- F(ab’)2 prior to ELISA based determination of AHA reactivity with solid phase pembrolizumab-F(ab’)2. The AHA levels detected in each serum aliquot were normalised relative to the level in the corresponding nil treated aliquot (defined as 100%) and pooled data are shown as mean ± SEM. The serums analysed were obtained from a ND, a pembrolizumab treated patient and an adalimumab treated patient that had AHA OD of 0.6, 0.8 and 1 respectively. (B) Serum containing AHA (n = 4) were divided into aliquots and either nil treated or depleted by incubation with a PD-1+cell line that had been labelled with either pembrolizumab or pembrolizumab- F(ab’)2. AHA reactivity with solid phase pembrolizumab-F(ab’)2 was then determined by ELISA and the levels in each serum aliquot were normalised relative to the level in the corresponding nil treated aliquot (defined as 100%) and pooled data are shown as mean ± SEM. The serums analysed all had elevated AHA levels and were obtained from AHA+Con, a pembrolizumab treated patient and 2 adalimumab treated patients (C) AHA reactivity with pembrolizumab- F(ab’)2 that has bound to its target antigen PD-1. AHA binding was detected by ELISA and results normalised as described in Fig 1. Data are shown as a scatterplot of reactivity with PD-1 bound pembrolizumab-F(ab)2 versus reactivity with solid phase pembrolizumab—F(ab’)2 for each individual serum sample. Serum analysed were from ND and adalimumab treated patients and the respective Spearman rank correlation coefficient is indicated. Asterisks in A and B indicate treatments significantly different from nil following analysis of raw data by repeated measures ANOVA.
Fig 3
Fig 3. Kaplan-Meier plot of the overall survival of melanoma patients following commencement of treatment with pembrolizumab.
Patients were divided, on the basis of their ranked IgG-AHA levels, into AHALow (n = 18) and AHAHigh (n = 5) groups using the 75% percentile as a cut-point. Solid symbols on each curve represent patients censored at that specific time. Curves were compared using the log rank test and the p value indicated. Median survival for AHALow was 13.2 months and for AHAHigh was not reached.
Fig 4
Fig 4. Effect of AHA on ROS production by granulocytes.
Granulocytes loaded with ROS indicator (DHR) were added together with serum samples to antibody complexes formed by coating wells with either nil, antibodies (rituximab, pembrolizumab) or pembrolizumab- F(ab´)2. Plates were then incubated for 1h prior to flow cytometric analysis (A) Representative bar graph of rhodamine-123 staining observed following culture under the indicated conditions. Data are normalized relative to the MFI of nil treated granulocytes and are from a single experiment of 3 performed. (B, C) ROS stimulating capacity of individual serum samples following addition to cultures containing granulocytes and solid phase pembrolizumab- F(ab´)2. Data are shown as a scatterplot of ROS generation versus anti-hinge levels for each individual serum collected from either (B) a mixture of AHAHigh (n = 4) and AHALow (n = 3) pembrolizumab treated melanoma patients or (C) normal donors (n = 6), adalimumab treated patients (n = 11) and pembrolizumab treated melanoma patients (n = 7). The spearman rank correlation coefficient is indicated.
Fig 5
Fig 5. Effect of AHA on NK activation.
Responder cells (enriched NK cells or PBMC) and IL-2 were added in combination with test serum samples to wells coated with either nil, antibodies (rituximab, pembrolizumab) or pembrolizumab- F(ab´)2. Following 24h incubation, cultures containing (A, B) enriched NK cells were utilised for analysis of CD16 expression (MFI) by flow cytometry and (C, D) PBMC were used as effectors in killing assays utilizing K562 as the target. Data from representative experiments are shown as bar graphs of (A) CD16 expression and (C) Specific cytotoxicity following culture of corresponding responders with the indicated solid phase antibodies in the additional presence of either nil, AHALow serum or AHA+Con serum (B, D) Bar graphs of the relative levels of CD16 expression and cytotoxicity observed following addition of individual test serum to wells coated with either pembrolizumab or pembrolizumab- F(ab´)2. Test sera were from with AHALow ND or AHAHigh pembrolizumab treated melanoma patients. For each sera relative levels are defined as the pembrolizumab- F(ab´)2/pembrolizumab ratio (F(ab´)2/IgG4) and pooled data from three separate experiments are shown as mean ± SEM. Statistical analysis was performed using repeated measures ANOVA and asterisks indicate values significantly different from those observed in control wells containing no serum.
Fig 6
Fig 6. Effect of AHA on CDC and C3b deposition.
(A, B) CDC of Raji, a CD20+ cell line. Raji was incubated with nil, Rituximab or rituximab- F(ab´)2 either alone or in combination with ND or patient serum. Following subsequent exposure to complement the level of target cell lysis (%) was determined. (A) Data from a representative experiment of three performed are shown as a bar graph of % lysis observed following incubation of Raji with the indicated combinations of antibody (rituximab vs rituximab- F(ab´)2) and either nil AHALow or AHA+Con sera (B) Serum samples from ND, adalimumab treated patients [A] and pembrolizumab treated melanoma patients [P] were added to Raji in both the presence and absence of rituximab- F(ab´)2. The difference between the treatments following exposure to complement provided the measure of specific lysis and data are shown as a scatter plot (C) CDC inducing activity of serum from a pembrolizumab treated melanoma patient (AHAIgM) compared to a ND with low AHA levels (AHALow) and AHA+Con. Sera were combined with rituximab- F(ab´)2 or nil and their ability to induce specific lysis of Raji was determined in comparison to that induced by rituximab alone. Pooled data from three separate experiments are shown as mean ± SEM. Statistical analysis was performed using a repeated measures ANOVA in combination with a Holm-Šídák’s multiple comparisons test and asterisks indicate values significantly different from those observed AHALow sera. (D) Effect of AHA on C3b deposition. Wells coated with solid phase pembrolizumab or pembrolizumab- F(ab´)2 were incubated with nil sera, AHALow sera, AHA+Con or AHAIgM sera and then following exposure to complement the level of C3b deposition was determined by ELISA. Data from individual experiments (n = 3) were normalized relative to the OD observed in control wells coated with pembrolizumab + nil serum (defined as ratio = 1). Pooled data are shown as mean ± SEM and asterisks indicate values significantly different from the control following analysis using a repeated measures ANOVA.

Similar articles

Cited by

References

    1. Ribas A, Wolchok JD. Cancer immunotherapy using checkpoint blockade. Science. 2018;359(6382):1350–5. doi: 10.1126/science.aar4060 - DOI - PMC - PubMed
    1. Almagro JC, Daniels-Wells TR, Perez-Tapia SM, Penichet ML. Progress and Challenges in the Design and Clinical Development of Antibodies for Cancer Therapy. Frontiers in immunology. 2017;8:1751. doi: 10.3389/fimmu.2017.01751 - DOI - PMC - PubMed
    1. Chen X, Song X, Li K, Zhang T. FcgammaR-Binding Is an Important Functional Attribute for Immune Checkpoint Antibodies in Cancer Immunotherapy. Frontiers in immunology. 2019;10(292):1–13. - PMC - PubMed
    1. Zhang T, Song X, Xu L, Ma J, Zhang Y, Gong W, et al.. The binding of an anti-PD-1 antibody to FcgammaRIota has a profound impact on its biological functions. Cancer Immunol Immunother. 2018;67(7):1079–90. - PMC - PubMed
    1. Lo Russo G, Moro M, Sommariva M, Cancila V, Boeri M, Centonze G, et al.. Antibody-Fc/FcR Interaction on Macrophages as a Mechanism for Hyperprogressive Disease in Non-small Cell Lung Cancer Subsequent to PD-1/PD-L1 Blockade. Clin Cancer Res. 2019;25(3):989–99. doi: 10.1158/1078-0432.CCR-18-1390 - DOI - PubMed

Publication types