. 2023 Sep 15;21(9):e3002309.
doi: 10.1371/journal.pbio.3002309. eCollection 2023 Sep.

A new polymodal gating model of the proton-activated chloride channel

Affiliations

A new polymodal gating model of the proton-activated chloride channel

Piao Zhao et al. PLoS Biol. .

Abstract

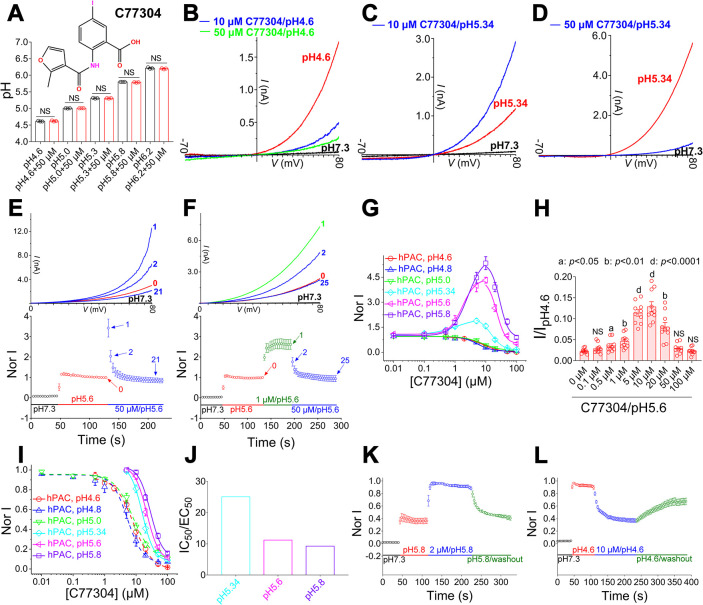
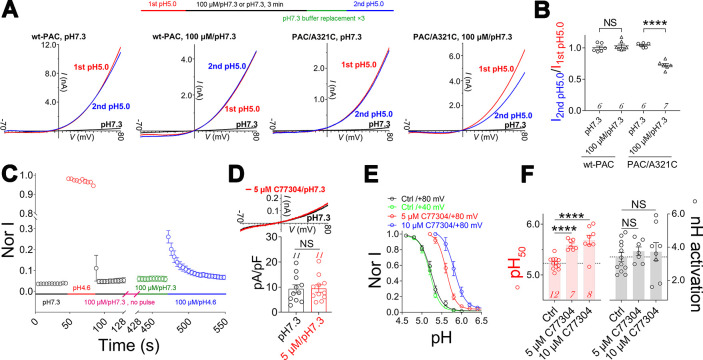
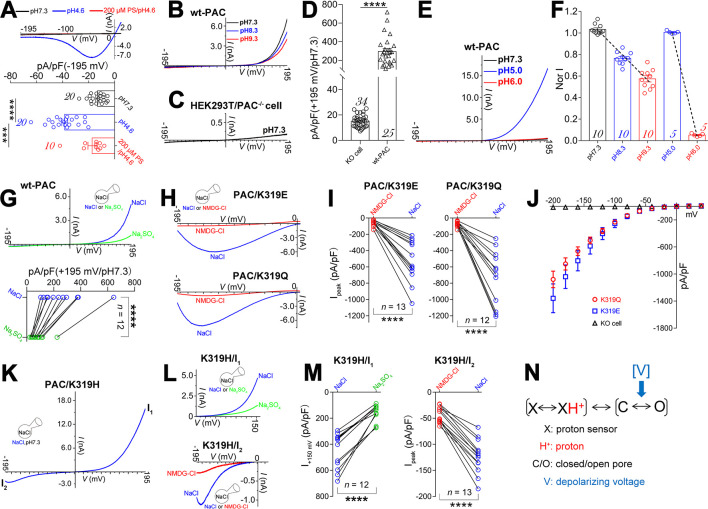
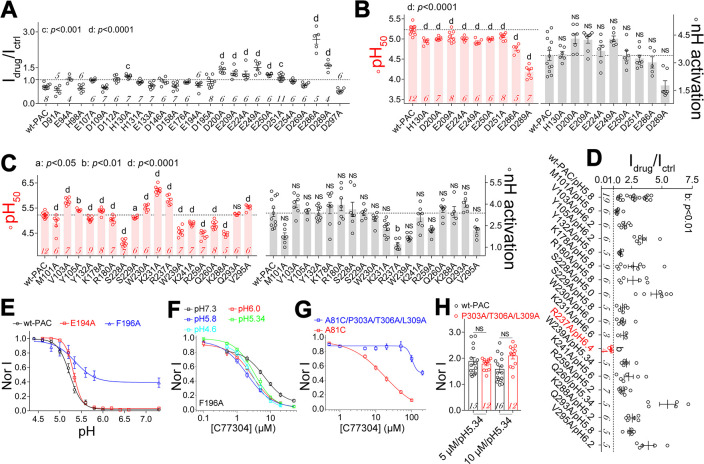
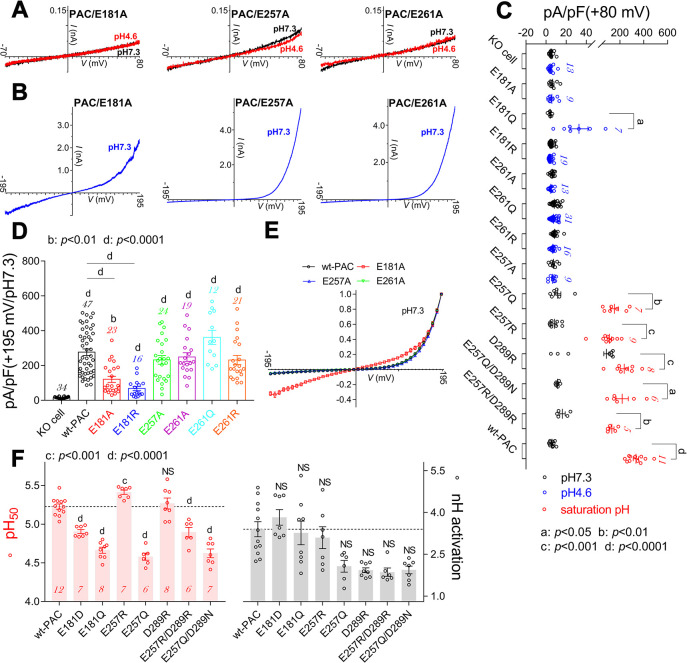
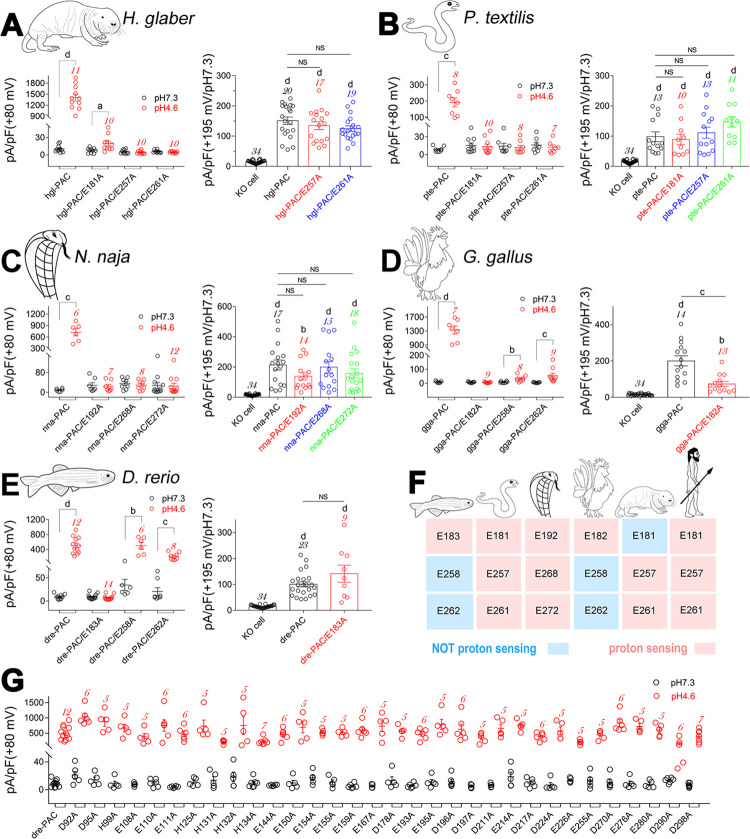
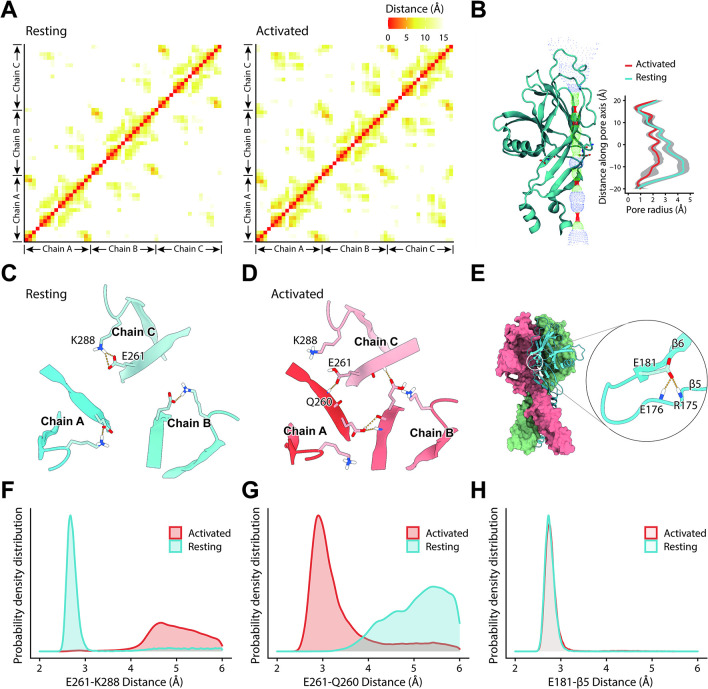
The proton-activated chloride (PAC) channel plays critical roles in ischemic neuron death, but its activation mechanisms remain elusive. Here, we investigated the gating of PAC channels using its novel bifunctional modulator C77304. C77304 acted as a weak activator of the PAC channel, causing moderate activation by acting on its proton gating. However, at higher concentrations, C77304 acted as a weak inhibitor, suppressing channel activity. This dual function was achieved by interacting with 2 modulatory sites of the channel, each with different affinities and dependencies on the channel's state. Moreover, we discovered a protonation-independent voltage activation of the PAC channel that appears to operate through an ion-flux gating mechanism. Through scanning-mutagenesis and molecular dynamics simulation, we confirmed that E181, E257, and E261 in the human PAC channel serve as primary proton sensors, as their alanine mutations eliminated the channel's proton gating while sparing the voltage-dependent gating. This proton-sensing mechanism was conserved among orthologous PAC channels from different species. Collectively, our data unveils the polymodal gating and proton-sensing mechanisms in the PAC channel that may inspire potential drug development.


Conflict of interest statement

The authors have declared that no competing interests exist.

Figures

Fig 1
Fig 1. Identification of C77304 as a bifunctional modulator of the PAC channel.
(A) Upper panel, C77304 structure; lower panel, C77304 does not change buffer pHs (n = 3; NS, not significant; paired t test). (B) C77304 concentration–dependently inhibits pH 4.6–evoked PAC currents recorded at ramp depolarizations from −70 to +80 mV (1 mV/ms) (n = 6). (C, D) C77304 at 10 μM potentiates (C), but at 50 μM inhibits (D), PAC currents at pH 5.34 (n = 15). (E, F) Lower panels: time–course of C77304 acting on PAC channels at pH 5.6. Colored bars show the treatment sequence. Currents were normalized to time point 0. Upper panels: example current traces at different time points as indicated (n = 7–10). (G) Concentration–response curves of C77304 acting on PAC channels at different pHs. Currents were normalized to the no compound treatment condition. The activation EC50s and mean hill slopes were 2.9 ± 0.9 μM and 1.6 (n = 19), 1.8 ± 0.6 μM and 1.9 (n = 8), and 0.6 ± 0.2 μM and 2.1 (n = 16) at pH 5.8, pH 5.6, and pH 5.34, respectively. (H) Concentration–response relationship of C77304 acting on PAC channels at pH 5.6, currents were normalized to the maximum available current elicited by pH 4.6 stimulus; open circles in each bar represents a separate experimental cell [n = 10; significant differences between the C77304 treated groups and the control group (0 μM) were assessed using RM (repeated measure) one–way ANOVA with post hoc Dunnett analysis; NS, not significant]. (I) The same as in (G), except that currents were normalized to the maximum compound–activated current (5 or 10 μM) at pHs 5.34, 5.6, and 5.8, the IC50s and mean hill slopes were 26.9 ± 2.6 μM and 1.9 (n = 19), 20.2 ± 1.5 μM and 2.5 (n = 8), 15.5 ± 1.1 μM and 2.6 (n = 15), 7.9 ± 0.5 μM and 2.0 (n = 8), 6.2 ± 0.8 μM and 1.8 (n = 7), and 8.3 ± 1.0 μM and 1.5 (n = 6) at pH 5.8, pH 5.6, pH 5.34, pH 5.0, pH 4.8, and pH 4.6, respectively. (J) The ratio of the apparent affinity of C77304 inhibiting and activating PAC channels (IC50/EC50) at different pHs. (K, L) Time–course of C77304 activating (K) and inhibiting (L) PAC currents and the corresponding wash–out upon perfusion with compound–free solutions. Compound activation and subsequent current recovery at pH 5.8 had time constants of 4.5 ± 1.3 s and 15.9 ± 2.5 s, respectively. At pH 4.6, compound inhibition and subsequent current recovery had time constants of 15.9 ± 2.3 s and 82.7 ± 12.9 s, respectively (n = 6–10). The data underlying the graphs shown in the figure can be found in S1 Data. PAC, proton–activated chloride.
Fig 2
Fig 2. The mechanism of action of C77304 on PAC channels.
(A) Upper panel: experimental protocol; lower 4 panels: representative traces showing 100 μM C77304 preincubated at pH 7.3 inhibits currents from A321C mutant, but not wt–PAC, channels (n = 6–7). (B) Summary of data in panel A (n value as indicated in each group; NS, not significant; ****, p < 0.0001; unpaired t test). (C) Time course of preincubated C77304 (100 μM/pH 7.3 for 5 min; see sequence of treatment conditions) blocking PAC currents upon channel activation by pH 4.6 (the blue circles) (n = 9). Currents were recorded at ramp depolarizations from −70 to +80 mV (1 mV/ms). (D) Example traces (upper panel) and summary analysis (lower panel) showing C77304 did not activate PAC currents at pH 7.3 (n = 11; NS, not significant; paired t test). (E, F) Current–pH relationships of PAC channels before and after 5 and 10 μM C77304 treatment (E) and the related summary analysis of the pH50s and slope factors (F), currents at +40 mV and/or +80 mV recorded by ramp depolarization (−70 to +80 mV) were analyzed (n = 7–12; NS, not significant; ****, p < 0.0001; one–way ANOVA with post hoc Dunnett analysis). The data underlying the graphs shown in the figure can be found in S1 Data. PAC, proton–activated chloride; wt, wild–type.
Fig 3
Fig 3. Protonation–independent voltage gating in PAC channels.
(A) Representative traces (upper panel) and summary data (lower panel) showing pH 4.6 treatment activated a small but significant PS–sensitive and PAC channel–responsible currents at hyperpolarizing voltages. Currents were elicited by ramp depolarization from −195 mV to +10 mV (n = 10–20; ****, p < 0.0001; ***, p < 0.001; paired t test). (B–D) Representative current traces (B and C) and summary bar graphs (D) showing strong ramp depolarization (−195 mV to +195 mV) elicits large currents in wt–PAC transfected but not PAC knock–out cells at pH 7.3, with extracellular alkalization to pH 8.3 and 9.3 slightly reducing the amplitude (B) (n = 10–34; ****, p < 0.0001; unpaired t test). (E) Representative current traces showing pH 6.0 bath perfusion reduces the pH 5.0 acidification elicited currents in response to a −195 mV to +195 mV ramp depolarization (n = 5). Untransfected HEK293T cells endogenously expressing the PAC channel were used for controlling the amplitude of acid–evoked currents at +195 mV. (F) Current–pH relationships of PAC channels in different pH ranges, with the linear fit slope factor determined to be −0.22 and −0.95 between pH 7.3–9.3 and pH 5.0–6.0, respectively; n values indicated in each bar. Currents were recorded as in (B) and (E). (G) Representative traces (upper panel) and statistics (lower panel) showing Na2SO4 substitution of the external NaCl significantly reduces depolarization–activated PAC currents (****, p < 0.0001; paired t test; n = 12). (H, I) Representative current traces and statistics showing NMDG–Cl substitution of the external NaCl significantly reduces hyperpolarizaiton–activated currents in the PAC/K319E (H, upper panel; I, left panel) and PAC/K319Q (H, lower panel; I, right panel) channels (****, p < 0.0001; paired t test; n = 12–13). (J) I–V relationships of PAC/K319E and PAC/K319Q mutant channels at pH 7.3, currents were elicited by a cluster of voltage step from +40 mV to −200 mV (1 s) from the holding potential of 0 mV; HEK293T/PAC–/–(PAC knock–out) cell was included for comparison (n = 10–15). (K) The PAC/K319H mutant channel conducted both inward and outward currents in response to a −195 to +195 mV ramp depolarization at pH 7.3 (n = 7). (L, M) Na2SO4 and NMDG–Cl substitution of external NaCl significantly reduces the outward (L, upper panel; M, left panel) and inward currents (L, lower panel; M, right panel) in the PAC/K319H mutant channel, respectively (****, p < 0.0001; paired t test; n = 12–13). (N) Gating scheme of the PAC channel. The data underlying the graphs shown in the figure can be found in S1 Data. PAC, proton–activated chloride; PS, pregnenolone sulfate; wt, wild–type.
Fig 4
Fig 4. Mapping key residues involved in proton gating and deciphering the putative C77304 binding sites in PAC channels.
(A) Alanine–scanning mutations of glutamate, aspartate, and histidine residues in the human PAC channel: Bar graphs show the normalized effect of 5 μM C77304 on their currents at pH 5.0. (B) Summary analysis showing the changes in pH50 (left panel) and nH activation values (right panel) of PAC mutants activated by C77304 in (A). (C) Summary analysis showing most mutations in the side portal region of PAC channel significantly change the pH50 of proton activation (left panel). The R237A mutation remarkably changed the slope factor (right panel). (D) Effects of 5 μM C77304 on PAC mutant channels’ currents at their respective root pHs; currents were normalized to their respective control currents before drug treatment, showing the compound exclusively inhibited the PAC/R237A currents but activated the others. (E) Current–pH relationships of PAC/E194A and PAC/F196A mutant channels, wt–PAC was included for comparison (n = 6–12). (F) Dose–response relationships of C77304 inhibiting the PAC/F196A mutant channel at multiple pHs spanning its current–pH relationship. The IC50s and mean slope factors were determined to be 6.6 ± 0.9 μM and 1.4 (n = 8), 2.9 ± 0.2 μM and 1.3 (n = 6), 2.0 ± 0.2 μM and 1.2 (n = 7), 3.6 ± 0.3 μM and 1.5 (n = 5), 3.0 ± 0.5 μM and 1.4 (n = 7), at pH 7.3, pH 6.0, pH 5.8, pH 5.34, and pH 4.6, respectively. (G) Concentration–response relationships of C77304 inhibiting the currents of A81C and A81C/P303A/T306A/P309A mutant channels at pH 7.3, with the IC50s being determined as 18.3 ± 3.0 μM and approximately 200 μM, respectively (n = 7–9). (H) C77304 similarly activated the pH 5.34–evoked currents of the wt–PAC and P303A/T306A/P309A mutant channels; currents were normalized to that before drug treatment. In (A–D), the differences between mutant and wt–PAC channels were assessed by one–way ANOVA with post hoc Dunnett analysis; in (H), unpaired t test was used; p values as indicated in each panel and “NS” means not significant, n values for each channel as indicated in the bar. The data underlying the graphs shown in the figure can be found in S1 Data. PAC, proton–activated chloride; wt, wild–type.
Fig 5
Fig 5. Characterizing the primary proton sensors in human PAC channels.
(A, B) Representative current traces showing PAC/E181A, PAC/E257A, and PAC/E261A mutant channels did not respond to low pHo stimulation (A) but were activated by strong ramp depolarizations from −195 mV to +195 mV at pH 7.3 (B) (n = 9–24). (C, D) Summary analysis of proton (C) and strong depolarization (D; at pH 7.3)–activated currents of mutant channels as indicated, the KO cell and wt–PAC groups were included for comparison (n value as indicated in each bar). (E) Normalized I–V relationships of wt–PAC, PAC/E181A, PAC/E257A, and PAC/E261A mutant channels, with E181A mutation changed the I–V shape (n = 8–12). (F) Summary analysis of pH50 (left panel) and nH activation (right panels) values for mutant channels as indicated (n values inside each bar). Statistical differences were assessed using paired t test (C); one–way ANOVA with post hoc Dunnett analysis in (D) and (F); in (D), mutants were compared with KO and wt–PAC respectively; p values as indicated in each panel and “NS” means not significant. Note in (D), the “NS” symbols between E257A, E261A, E261Q, E261R, and wt–PAC were omitted for clarity. The data underlying the graphs shown in the figure can be found in S1 Data. PAC, proton–activated chloride; wt, wild–type.
Fig 6
Fig 6. Cross–species analysis of the proton sensing mechanism of PAC channels.
(A) Summary analysis of the proton (left) and strong–depolarization (right) activated currents of hgl–PAC, hgl–PAC/E181A, hgl–PAC/E257A, and hgl–PAC/E261A mutant channels from H. glaber. (B) Summary analysis of proton (left) and strong depolarization (right)–activated currents in pte–PAC, pte–PAC/E181A, pte–PAC/E257A, and pte–PAC/E261A mutant channels from P. textilis. (C) Summary analysis of proton (left) and strong depolarization (right)–activated currents of nna–PAC, nna–PAC/E192A, nna–PAC/E268A, and nna–PAC/E272A mutant channels from N. naja. (D) Summary analysis of proton (left) and strong depolarization (right)–activated currents in gga–PAC, gga–PAC/E182A, gga–PAC/E258A, and gga–PAC/E262A mutant channels from G. gallus. (E) Summary analysis of proton (left) and strong depolarization (right)–activated currents in dre–PAC, dre–PAC/E183A, dre–PAC/E258A, and dre–PAC/E262A mutant channels from D. rerio. (F) Heat map showing the homology of residues constituting the presumptive proton sensors among orthologous PAC channels. (G) Alanine–scan mutation of titratable residues in dre–PAC channel; all these mutants were effectively activated by protons by pH dropping from 7.3 to 4.6. Currents were recorded with −70 mV to +80 mV ramp depolarizations. Statistical differences between pH 7.3 and pH 4.6 in (A–E) were assessed by paired t tests; differences for strong depolarization–activated currents between groups in (A–E) were assessed by one–way ANOVA with post hoc Dunnett analysis (the KO cell and wt–PAC groups were used as control for comparison, respectively); a, p < 0.05; b, p < 0.01; c, p < 0.001; d, p < 0.0001; NS, not significant; n value as indicated in each bar. The data underlying the graphs shown in the figure can be found in S1 Data. PAC, proton–activated chloride; wt, wild–type.
Fig 7
Fig 7. A gating model of the PAC channel.
(A) Inter–and intra–chain contact maps in the resting state (left panel) and activated state (right panel). The x/y axis represents the residue ID on the 3 chains. The color bar indicates the distance (in angstroms) of the interactions. (B) The pore sizes of the PAC channel in the resting and activated states. Only 1 of the 3 subunits is shown for clarity. (C) The E261 interaction pattern in a representative resting state structure, dominated by electrostatic attractions within the subunit. The colors indicate the 3 subunits. (D) The E261 interaction pattern in a representative activated state structure, dominated by the hydrogen bond between Q260 and E261 on a neighboring chain in the activated state. (E) The interaction network involving E181 in a representative structure in the resting state taken from the MD trajectory. (F) The probability density distributions of the salt bridge distance between the carboxyl oxygen on E261 and the amino nitrogen on K288. (G) The probability density distributions of the distance between the carboxyl oxygen on E261’s sidechain and the carboxyl oxygen or amide nitrogen on Q260’s backbone. (H) The probability density distributions of the hydrogen bond distance between the carboxyl oxygen on E181’s sidechain and the amide nitrogen on E176’s or R175’s backbone. The data underlying the graphs shown in the figure can be found in S1 Data. PAC, proton–activated chloride.

Similar articles

Cited by

References

    1. Carmona EM, Fernandez M, Alvear–Arias JJ, Neely A, Larsson HP, Alvarez O, et al.. The voltage sensor is responsible for DeltapH dependence in Hv1 channels. Proc Natl Acad Sci U S A. 2021;118(19). Epub 2021/05/05. doi: 10.1073/pnas.2025556118 ; PubMed Central PMCID: PMC8126849. - DOI - PMC - PubMed
    1. Cherny VV, Morgan D, Thomas S, Smith SME, DeCoursey TE. Histidine(168) is crucial for DeltapH–dependent gating of the human voltage–gated proton channel, hHV1. J Gen Physiol. 2018;150(6):851–62. Epub 2018/05/11. doi: 10.1085/jgp.201711968 ; PubMed Central PMCID: PMC5987877. - DOI - PMC - PubMed
    1. Peters CH, Ghovanloo MR, Gershome C, Ruben PC. pH Modulation of Voltage–Gated Sodium Channels. Handb Exp Pharmacol. 2018;246:147–60. Epub 2018/02/21. doi: 10.1007/164_2018_99 . - DOI - PubMed
    1. Jones DK, Peters CH, Allard CR, Claydon TW, Ruben PC. Proton sensors in the pore domain of the cardiac voltage–gated sodium channel. J Biol Chem. 2013;288(7):4782–91. Epub 2013/01/04. doi: 10.1074/jbc.M112.434266 ; PubMed Central PMCID: PMC3576083. - DOI - PMC - PubMed
    1. Waldmann R, Champigny G, Bassilana F, Heurteaux C, Lazdunski M. A proton–gated cation channel involved in acid–sensing. Nature. 1997;386(6621):173–7. Epub 1997/03/13. doi: 10.1038/386173a0 . - DOI - PubMed