. 2023 Sep 15;9(37):eadf3885.
doi: 10.1126/sciadv.adf3885. Epub 2023 Sep 15.

Sodium channel endocytosis drives axon initial segment plasticity

Affiliations

Sodium channel endocytosis drives axon initial segment plasticity

Amélie Fréal et al. Sci Adv. .

Abstract

Activity-dependent plasticity of the axon initial segment (AIS) endows neurons with the ability to adapt action potential output to changes in network activity. Action potential initiation at the AIS highly depends on the clustering of voltage-gated sodium channels, but the molecular mechanisms regulating their plasticity remain largely unknown. Here, we developed genetic tools to label endogenous sodium channels and their scaffolding protein, to reveal their nanoscale organization and longitudinally image AIS plasticity in hippocampal neurons in slices and primary cultures. We find that N-methyl-d-aspartate receptor activation causes both long-term synaptic depression and rapid internalization of AIS sodium channels within minutes. The clathrin-mediated endocytosis of sodium channels at the distal AIS increases the threshold for action potential generation. These data reveal a fundamental mechanism for rapid activity-dependent AIS reorganization and suggests that plasticity of intrinsic excitability shares conserved features with synaptic plasticity.


Figures

Fig. 1.
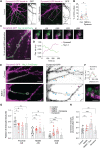
Fig. 1.. NMDAR activation induced AIS shortening in acute hippocampal slices and cultured neurons.
(A) Genetically induced AnkG-GFP expression in CA1. (B) Hippocampal AnkG-GFP with patch-clamp configuration stimulating SC and CA1 pyramidal neuron filled with biocytin and immunostained against GFP. (C) Live bright-field and AnkG-GFP image during whole-cell recording. Top: Application of 20 μM NMDA followed by APV (“NMDA”)–induced AP burst firing. Bottom: APV alone (“control”) did not change resting potential. (D) Example EPSC traces before (pre) and after 60 min (post) control or NMDA treatment. NMDA causes LTD (NMDA, n = 7; control, n = 6; unpaired t test, ***P < 0.001). (E) Neuron filled with Atto594 and positive for AnkG-GFP before and after NMDA. White arrows indicate AIS start and end. (F) NMDA significantly reduces AIS length (mixed-effect analysis: control, P = 0.0254; NMDA, P < 0.0001. Šídák’s multiple comparisons test: control, P > 0.05 for 0 versus −10, 30, and 60; NMDA, −10 versus 0; P = 0.06 (ns), 0 versus 30; ***P < 0.001, 0 versus 60; ***P < 0.001. control: n = 24, 16 whole cell, 8 imaging; NMDA: n = 25, 14 whole cell, 11 imaging). (G) Immunostaining of AnkG, PanNav, and MAP2 in hippocampal neurons in control and after NMDA (4 min, 50 μM NMDA). (H to I) AnkG (H) and PanNav (I) lengths in indicated conditions (N = 4 cultures, n > 440 neurons per condition). Matched Friedman test with Dunn’s multiple comparisons test. AnkG: NMDA, *P = 0.027; NMDA + APV, P = 0.96 (ns). PanNav: NMDA, *P = 0.027; NMDA + APV, P = 0.15 (ns). (J) Cumulative fraction plots for AnkG and PanNav lengths. Scale bars, 500 and 15 μm (B); 10 μm; 1 min, 30 mV (C); 50 ms, 30 mV (inset of C); 100 pA, 10 ms (D); 10 μm (E); and 20 μm (G).
Fig. 2.
Fig. 2.. NaV1.2 is selectively reduced in the distal AIS during NMDAR-mediated plasticity.
(A) Immunostaining for NaV1.2, NaV1.6 and AnkG on DIV14 in control and NMDA condition. Scale bars, 20 μm. (B) Average length of NaV1.2 was reduced by NMDA exposure and blocked by APV (NMDA + APV). Repeated-measures one-way ANOVA with Dunnett’s multiple comparisons test: NMDA, **P = 0.008; NMDA + APV, P = 0.99 (ns). N = 4 cultures with at least 236 neurons per condition. (C and D) NMDA-mediated reduction in Δ end (NaV1.2 to NaV1.6). (C) Repeated-measure one-way ANOVA with Dunnett’s multiple comparisons test, N = 4 cultures. NMDA, *P = 0.022; NMDA + APV, P = 0.76 (ns). At least 260 neurons per condition, and corresponding scheme (D). (E and F) STED image of DIV14 NaV1.2-GFP knock-in neuron stained for GFP and AnkG with zoom in of the proximal AIS. Scale bars, 5 μm and 500 nm. (G) Autocorrelation coefficient of AnkG and NaV1.2 fluorescence profiles in the proximal AIS, n = 8 neurons. (H) Live-cell imaging of NaV1.2-GFP knock-in neuron 5 min before and 30 min after NMDA and control. Scale bars, 10 μm. White arrowheads point to start and end of NaV1.2-GFP signal. (I) Corresponding fluorescence intensities normalized and smoothened over 1 μm. Dashed lines delineate the thresholds of end position, and red arrow points at the distal shortening 30 min after NMDA. (J) Average NaV1.2-GFP length of control neurons (gray, n = 13 neurons in N = 2 cultures) or in NMDA condition (red, n = 15 in N = 2 cultures) normalized to the first frame. Mixed-effects analysis with Šídák’s multiple comparisons test: 5 min, P > 0.99 (ns); 17.5 min, *P = 0.019; 30 min, ***P = 0.0009.
Fig. 3.
Fig. 3.. AIS plasticity is triggered by the activation of synaptic NMDARs and relies on calcineurin.
(A) GluN1-GFP knock-in neurons stained for extracellular GFP, total GFP, and AnkG. Scale bars, 15 and 10 μm. Arrows show the trajectory of the AIS and axon. (B) Percentage of the AIS or dendrites surface positive for extracellular GFP. Wilcoxon’s test, ***P = 0.001, n = 16 neurons from three independent cultures. (C and D) NaV1.2 and AnkG relative lengths in NMDA and in the presence of FK-506, tautomycetin (Tauto), or okadaic acid (OA). N = 3 to 6 cultures, Kruskal-Wallis test. For NaV1.2: NMDA, **P = 0.0024; FK-506, P = 0.93 (ns); Tauto, P = 0.06 (ns); OA, P = 0.82 (ns). For AnkG: NMDA, **P = 0.004; FK-506, P = 0.99 (ns); Tauto, *P = 0.015; OA, P = 0.28 (ns).
Fig. 4.
Fig. 4.. Endocytosis is required for NMDA-induced NaV1.2 removal from the AIS.
(A) NaV1.2 and (B) AnkG relative length following NMDA application and in the presence of MG-132, MDL2870, Dynasore, and Pitstop 2, N = 3 to 6 independent experiments and n > 100 neurons per condition per experiment. Kruskal-Wallis test; NMDA: NaV1.2, *P = 0.019; AnkG, **P = 0.001; NMDA + MG-132: NaV1.2, *P = 0.036; AnkG, P = 0.21 (ns); NMDA + MDL28170: NaV1.2, **P = 0.005; AnkG, *P = 0.018; NMDA + Dynasore: NaV1.2, P > 0.99 (ns); AnkG, P = 0.38 (ns); NMDA + Pitstop 2: NaV1.2, P = 0.068 (ns); AnkG, P = 0.39 (ns). (C) Immunostaining for NaV1.2, AnkG, and MAP2 of DIV14 neurons in control conditions and NMDA with or without the dynamin inhibitor Dynasore. Scale bar, 10 μm. (D) Live-cell imaging of NaV1.2-GFP knock-in neuron 5 min before and 30 min after NMDA treatment and control. Scale bar, 10 μm; white arrowheads point to the start and end point of the NaV1.2-GFP signal. (E) Corresponding fluorescence intensities normalized to the maximum intensity. (F) Average NaV1.2-GFP length of neurons treated with NMDA in the presence of Dynasore normalized to the first frame. Repeated-measure one-way ANOVA with Šídák’s multiple comparisons test, P > 0.70 (ns), n = 7 neurons in N = 2 cultures.
Fig. 5.
Fig. 5.. Recruitment of the endocytic machinery at the AIS during rapid plasticity.
(A) Dynamin2 GFP knock-in neurons stained for GFP reveals increased NMDA-induced clusters in the AIS. Scale bars, 10 μm. (B) Dynamin2 surface in the NaV1.2-positive AIS in indicated conditions. Paired t test, *P = 0.033. N = 3 independent experiments, four to seven neurons per condition per experiment. (C) Simultaneous dual-color live imaging of a neuron coexpressing dynamin2-GFP and NaV1.2-mCherry 15-min post-NMDA treatment. Time points (in seconds) of the boxed areas are presented. Scale bars, 5 μm (left) and 500 nm (zooms). (D) Average fluorescence intensity inside the circle over time, smoothened over 24 s. (E) STED images of neurons coexpressing dynamin2-GFP and NaV1.2-mCherry under indicated conditions. Scale bars, 5 μm. Blue arrowheads point to endocytic structures, colored combs show regions with periodic distribution of dynamin2 in the AIS (orange) or dendrites (magenta). (F) Zoom of the boxed area and fluorescence intensity profile along the dashed line. Scale bar, 250 nm. (G) Distribution of dynamin2 endocytic structures along the AIS in indicated conditions. Two-way ANOVA with Tukey’s multiple comparison test. Proximal AIS: control versus NMDA, *P = 0.015; control versus NMDA + Dynasore, *P = 0.037; control versus Dynasore, P = 0.69 (ns). Middle AIS: control versus NMDA, P = 0.58 (ns); control versus NMDA + Dynasore, P = 0.73 (ns); control versus Dynasore, P = 0.86 (ns). Distal AIS: control versus NMDA, ***P = 0.0006; control versus NMDA + Dynasore, *P = 0.047; control versus Dynasore, P = 0.99 (ns); n > 9 neurons from two independent experiments. (H) AIS density of dynamin2 structures under indicated conditions. One-way ANOVA with Dunnett’s multiple comparison test. Control versus NMDA, P = 0.68 (ns); control versus NMDA + Dynasore, ***P = 0.0002; control versus Dynasore, P = 0.72 (ns); n > 9 neurons from two independent experiments.
Fig. 6.
Fig. 6.. NMDA-induced AIS shortening correlates with increased threshold for AP generation.
(A) AP voltage-time and phase-plane plots before and after NMDA and APV. Scale bars, 3 ms, 10 mV and 10 mV, 100 V/s. (B) Voltage threshold significantly increased after 60 min [two-way ANOVA, P = 0.0001 (time), P = 0.78 (treatment), and P = 0.278 (interaction). Šídák’s multiple comparisons test: Ctrl, *P < 0.05; NMDA, ***P < 0.001]. (C) NMDA reduces AP rate of rise. AIS peak: two-way ANOVA, P = 0.01 (time), P = 0.49 (treatment), and P = 0.54 (interaction). Multiple comparisons tests: Ctrl, P = 0.29 (ns); NMDA, *P = 0.047. Soma peak: two-way ANOVA, P = 0.0005 (time), P = 0.48 (treatment), and P = 0.40 (interaction). Multiple comparisons test: Ctrl, *P = 0.045; NMDA, **P = 0.0028. (D) Live AnkG-GFP imaging during NMDA treatment. See also movies S1 and S2. Scale bar, 20 μm. (E) AIS length reduction significantly correlates with voltage threshold. Continuous line, linear regression with 95% confidence interval (shaded). (F) Current-frequency (I-f) relationships for control (black) and NMDA treatment (orange). Control: paired mixed-effects model, P < 0.0001 (current), P < 0.0003 (time), and P = 0.69 (interaction). Individual current injections were not different (Šídák’s multiple comparisons test, P > 0.05 for all steps tested). NMDA reduced excitability. Two-way ANOVA, P < 0.0001 (current), P < 0.0001 (time), and P = 0.046 (interaction). Multiple comparisons tests for current steps; *P < 0.05, **P < 0.01, and ***P < 0.001. Scale bars, 100 ms, 20 mV. (G) Rheobase current increased after NMDA. Two-way ANOVA, P = 0.97 (treatment), P < 0.007 (time), and P = 0.41 (interaction). Multiple comparisons tests: Ctrl, P = 0.25 (ns); NMDA, *P = 0.017. (H) Proposed AIS plasticity model (see Discussion). (A to G) Data are depicted as individual scatter and mean ± SEM.

References

    1. M. H. Kole, G. J. Stuart, Signal processing in the axon initial segment. Neuron 73, 235–247 (2012). - PubMed
    1. C. Leterrier, The axon initial segment: An updated viewpoint. J. Neurosci. 38, 2135–2145 (2018). - PMC - PubMed
    1. J. J. Garrido, P. Giraud, E. Carlier, F. Fernandes, A. Moussif, M. P. Fache, D. Debanne, B. Dargent, A targeting motif involved in sodium channel clustering at the axonal initial segment. Science 300, 2091–2094 (2003). - PubMed
    1. G. Lemaillet, B. Walker, S. Lambert, Identification of a conserved ankyrin-binding motif in the family of sodium channel alpha subunits. J. Biol. Chem. 278, 27333–27339 (2003). - PubMed
    1. N. Jamann, D. Dannehl, N. Lehmann, R. Wagener, C. Thielemann, C. Schultz, J. Staiger, M. H. P. Kole, M. Engelhardt, Sensory input drives rapid homeostatic scaling of the axon initial segment in mouse barrel cortex. Nat. Commun. 12, 23 (2021). - PMC - PubMed

Substances