. 2023 Sep 15;8(87):eadg1487.
doi: 10.1126/sciimmunol.adg1487. Epub 2023 Sep 15.

Lung tumor-infiltrating Treg have divergent transcriptional profiles and function linked to checkpoint blockade response

Affiliations

Lung tumor-infiltrating Treg have divergent transcriptional profiles and function linked to checkpoint blockade response

Arbor G Dykema et al. Sci Immunol. .

Abstract

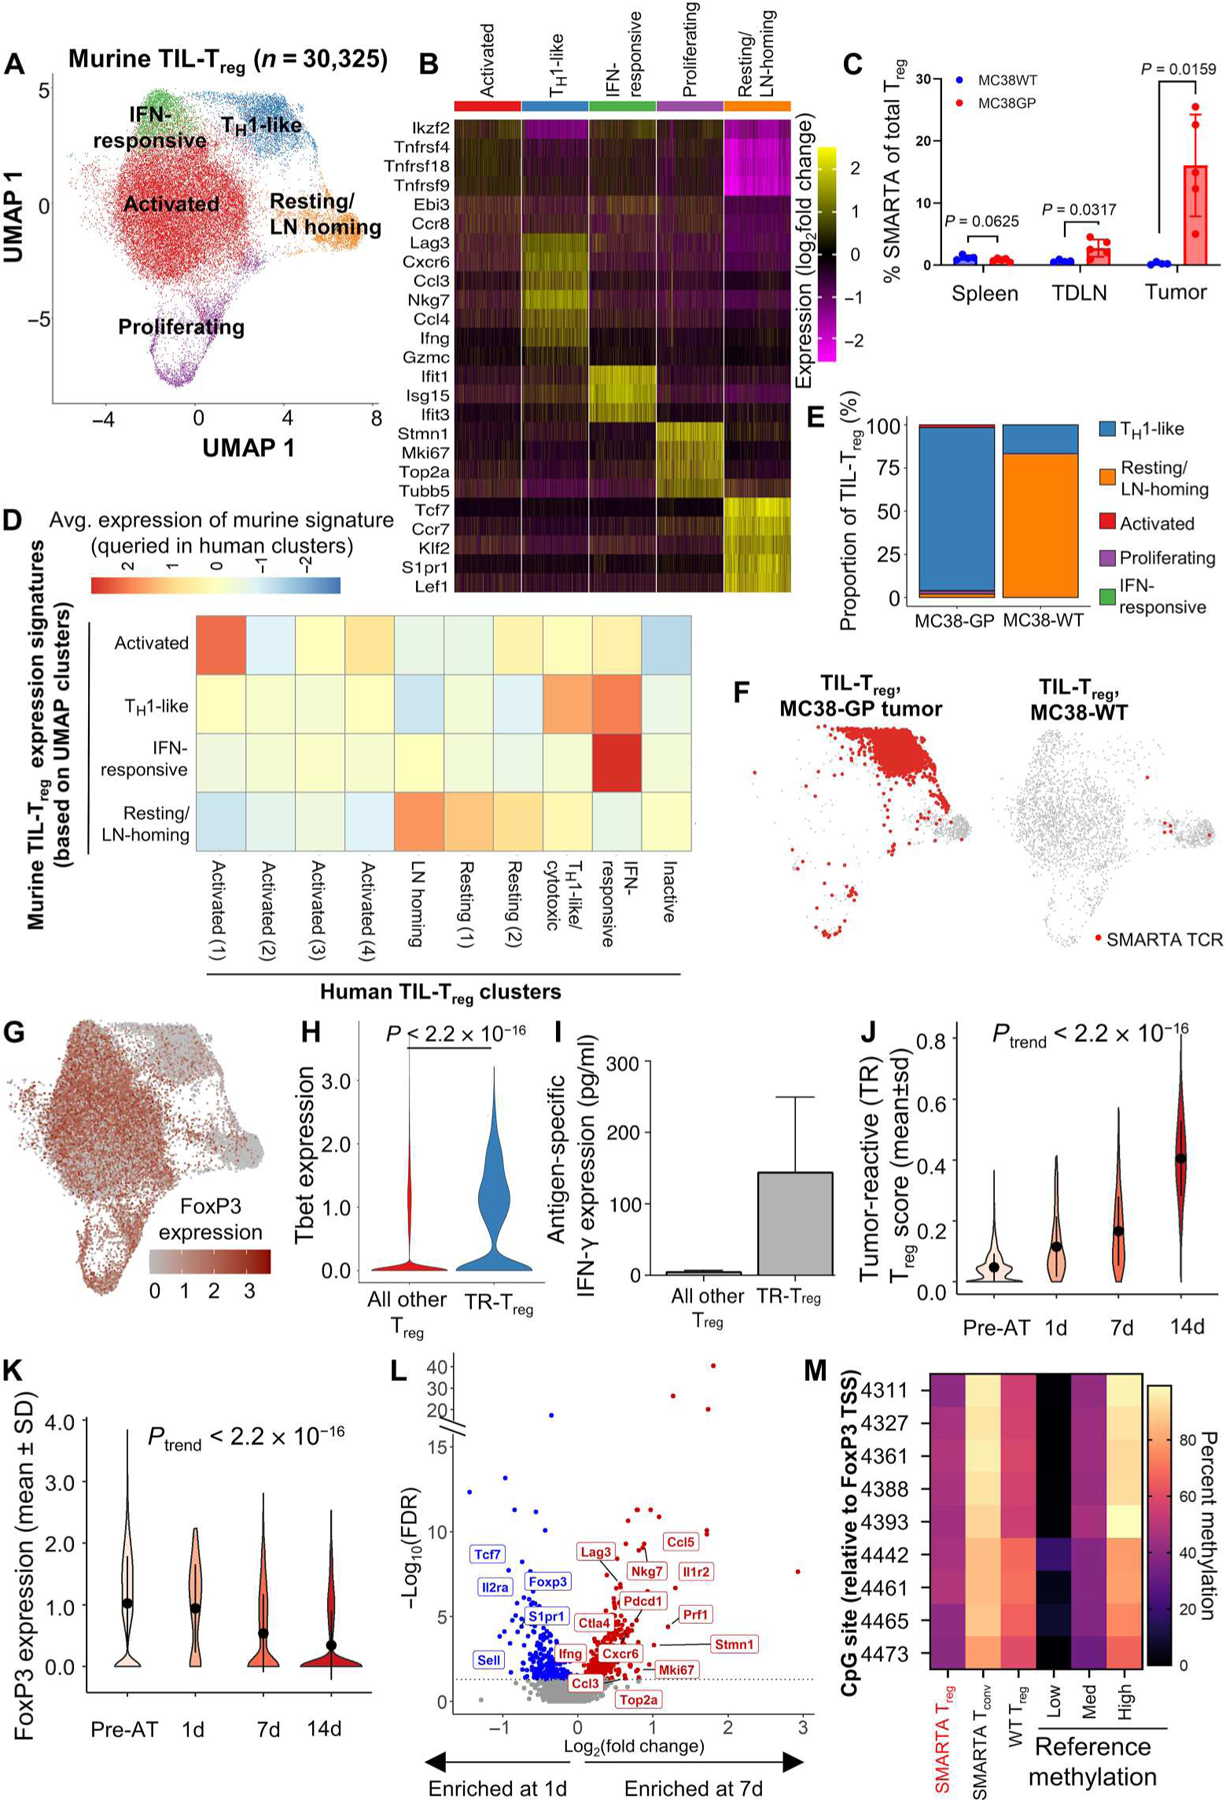
Regulatory T cells (Treg) are conventionally viewed as suppressors of endogenous and therapy-induced antitumor immunity; however, their role in modulating responses to immune checkpoint blockade (ICB) is unclear. In this study, we integrated single-cell RNA-seq/T cell receptor sequencing (TCRseq) of >73,000 tumor-infiltrating Treg (TIL-Treg) from anti-PD-1-treated and treatment-naive non-small cell lung cancers (NSCLC) with single-cell analysis of tumor-associated antigen (TAA)-specific Treg derived from a murine tumor model. We identified 10 subsets of human TIL-Treg, most of which have high concordance with murine TIL-Treg subsets. Only one subset selectively expresses high levels of TNFRSF4 (OX40) and TNFRSF18 (GITR), whose engangement by cognate ligand mediated proliferative programs and NF-κB activation, as well as multiple genes involved in Treg suppression, including LAG3. Functionally, the OX40hiGITRhi subset is the most highly suppressive ex vivo, and its higher representation among total TIL-Treg correlated with resistance to PD-1 blockade. Unexpectedly, in the murine tumor model, we found that virtually all TIL-Treg-expressing T cell receptors that are specific for TAA fully develop a distinct TH1-like signature over a 2-week period after entry into the tumor, down-regulating FoxP3 and up-regulating expression of TBX21 (Tbet), IFNG, and certain proinflammatory granzymes. Transfer learning of a gene score from the murine TAA-specific TH1-like Treg subset to the human single-cell dataset revealed a highly analogous subcluster that was enriched in anti-PD-1-responding tumors. These findings demonstrate that TIL-Treg partition into multiple distinct transcriptionally defined subsets with potentially opposing effects on ICB-induced antitumor immunity and suggest that TAA-specific TIL-Treg may positively contribute to antitumor responses.


Conflict of interest statement

Competing interests: V.A. receives research funding to Johns Hopkins University from Astra Zeneca and Personal Genome Diagnostics, has received research funding to Johns Hopkins University from Bristol-Myers Squibb and Delfi Diagnostics in the past 5 years, and is an advisory board member for Neogenomics. V.A. is an inventor on patent applications (63/276,525, 17/779,936, 16/312,152, 16/341,862, 17/047,006, and 17/598,690) submitted by Johns Hopkins University related to cancer genomic analyses, ctDNA therapeutic response monitoring, and immunogenomic features of response to immunotherapy that have been licensed to one or more entities. Under the terms of these license agreements, the University and inventors are entitled to fees and royalty distributions. J.M.T. receives research funding from Bristol-Myers Squibb and serves a consulting/advisory role for Bristol-Myers Squibb, Merck, and Astra Zeneca. J.R.B. serves an advisory/consulting role for Amgen, AstraZeneca, Bristol-Myers Squibb, Genentech/Roche, Eli Lilly, GlaxoSmithKline, Merck, Sanofi, and Regeneron; receives research funding from AstraZeneca, Bristol-Myers Squibb, Genentech/Roche, Merck, RAPT Therapeutics Inc., and Revolution Medicines; and is on the Data and Safety Monitoring Board of GlaxoSmithKline, Janssen, and Sanofi. P.M.F. receives research support from AstraZeneca, BioNtech, Bristol-Myers Squibb, Novartis, and Regeneron; has been a consultant for AstraZeneca, Amgen, Bristol-Myers Squibb, Iteos, Novartis, Star, Surface, Genentech, G1, Sanofi, Daiichi, Regeneron, Tavotek, VBL Therapeutics, Sankyo, and Janssen; and serves on a data safety and monitoring board for Polaris. S.Y. receives research funding from Bristol-Myers Squibb/Celgene, Janssen, and Cepheid; has served as a consultant for Cepheid; and owns founders’ equity in Brahm Astra Therapeutics and Digital Harmonic. K.N.S. and D.M.P. have filed for patent protection on the MANAFEST technology (serial no. 16/341,862). D.M.P. is a consultant for Compugen, Shattuck Labs, WindMIL, Tempest, Immunai, Bristol-Myers Squibb, Amgen, Janssen, Astellas, Rockspring Capital, Immunomic, and Dracen; owns founders’ equity in ManaT Bio Inc., WindMIL, Trex, Jounce, Enara, Tizona, Tieza, and RAPT; and receives research funding from Compugen, Bristol-Myers Squibb, and Enara. K.N.S. has received travel support/honoraria from Illumina Inc.; receives research funding from Bristol-Myers Squibb, Anara, and Astra Zeneca; and owns founder’s equity in ManaT Bio Inc. J.T. received research funding from Akoya Biosciences and BMS. J.T. is a consultant/advisory board member for BMS, Merck, Astra Zeneca, Genentech, Akoya Biosciences, Lunaphore, and Compugen. J.T. received equipment, reagents, and stock options from Akoya Biosciences. D.P. is an inventor on patents licensed by BMS and is entitled to royalties. The terms of all these arrangements are being managed by Johns Hopkins University in accordance with its conflict-of-interest policies. All other authors declare that they have no competing interests.

Figures

Fig. 1.
Fig. 1.. Single-cell transcriptomic profiling of Treg in treatment-naïve and neoadjuvant anti–PD-1–treated NSCLCs.
Coupled scRNA-seq/TCR-seq was performed on T cells isolated from resected tumor (n = 15), adjacent NL (n = 12), TDLN (n = 3), and a resected brain metastasis (n = 1) from patients with NSCLC treated with two doses of neoadjuvant anti–PD-1 as well as resected tumor (n = 10) and paired adjacent NL (n = 8) from treatment-naïve patients with NSCLC. (A) Two-dimensional (2D) UMAP projection of the expression profiles of the 73,882 Treg that passed QC. Treg subsets, defined by 10 unique clusters, are annotated and marked by color code. (B) Relative expression [average log2(fold change)] for top differential genes for each cluster is visualized on a heatmap. Three thousand cells (or all cells in the cluster if cluster size <3000 cells) were randomly sampled from each cluster for visualization. Differential expression tests for Treg cell subsets were performed with Wilcoxon rank sum test. Genes with >0.25 log2 fold changes, at least 25% expressed in tested groups, and genes with Bonferroni-corrected P values < 0.05 were regarded as differentially expressed. (C) The expression of canonical Treg subset marker genes and cell subset selective genes was visualized in red scale using UMAP projection. (D) PCA and canonical correlation of pseudobulk gene expression for individual tumor (yellow, n = 25) and adjacent NL (dark blue, n = 20) samples. Canonical correlation with tissue type = 0.56, P < 0.001. (E) PCA and canonical correlation of pseudobulk gene expression for individual nonresponder (red, n = 9) and responder (blue, n = 6) tumors. Canonical correlation with response status = 0.36, P = 0.50.
Fig. 2.
Fig. 2.. Activated, OX40hiGITRhi Treg are functionally suppressive and associate with nonresponse to PD-1 blockade.
(A) Functional analysis of OX40loGITRlo and OX40hiGITRhi TIL-Treg–mediated suppression of conventional CD4+T cell (Tconv) proliferation. TIL-Treg from patients MD017–0157, MD017–0092, MD017–0115, MD017–0124, and MD017–0116 were combined to ensure sufficient Treg numbers for this experiment (n = 1). (B) Volcano plot showing differential expression between the Activated (1)/OX40hiGITRhi cluster (right) versus all other Treg (left) when analyzing all tumor samples (n = 25). Each dot represents one gene. False discovery rate (FDR) < 0.05 is considered significant (blue/red dots). LAG3, TNFRSF18, and TNFRSF4 represent the top three most differentially expressed genes in the Activated (1)/OX40hiGITRhi Treg (red dots). (C) Overlay of the Activated Treg score on the TIL-Treg UMAP for each response/treatment group. Red indicates higher expression; blue indicates lower expression. (D) The frequency of Treg with a high Treg activation score is shown for tumor (left) and adjacent NL (right) from nonresponders (NR; red), responders (R; blue), and treatment-naive patients (Tx-naive; green). Comparisons were performed at the individual patient level using Wilcoxon rank test. (E) Clonotype sharing pattern across Treg subsets. The frequencies of Treg TCR clones that were detected in at least two Treg clusters were calculated and are shown on a heatmap. (F) Diffusion plot with RNA velocity for the Activated (1)/ OX40hiGITRhi and Activated (3) clusters (among which most clonotype sharing was observed). (G) Boxplots showing the relative proportion of Activated (1)/OX40hi GITRhi and Activated (3) clusters by R (blue), NR (red), and treatment-naïve status (green). (H) A violin plot shows TNFSF4 (OX40L) expression by neoantigen-specific (red) and flu-specific (blue) CD8 TILs from the same neoadjuvant-treated patients. (I) Violin plot comparing TNFSF4 (OX40L) expression by neoantigen-specific CD8+ TIL between nonresponding (red)and responding (blue) tumors. (J) Gene set enrichment analysis to evaluate differing biological functions of ex vivo OX40L, 41BBL, and GITRL agonism in sorted human TIL-Treg. TIL-Treg from patients MD043–011 and MD01–019 were combined to ensure sufficient Treg numbers for this experiment (n = 1). NF-κB, nuclear factor κB.
Fig. 3.
Fig. 3.. Defining the scRNA-transcriptome associated with Treg tumor antigen reactivity using a transgenic TCR mouse model.
Coupled scRNA-seq/TCR-seq was performed on Treg isolated from GP-expressing MC38 (MC38-GP, n = 5 mice per experiment) or parental MC38 (MC38WT, n = 10 mice per experiment) tumors, tumor-draining inguinal lymph node, and spleens on day 14 of tumor growth. (A) 2D UMAP projection of the expression profiles of the 30,325 Treg that passed QC. Treg subsets, defined by five unique clusters, are annotated and marked by color code. (B) Relative expression of three to five differential genes for each cluster is visualized on a heatmap. (C) Comparison of the frequency of SMARTA FoxP3+ Treg of total Treg defined by expression of CD45.1, FoxP3, and the SMARTA TCR between MC38WT (blue) and MC38-GP (red) tumor-bearing mice in each tissue compartment. Means with SEM error bars are shown for each mouse (n = 5). P values were obtained using Mann-Whitney test. (D) Homology to human Treg clusters is shown by the average expression of genes scores built on the top 20 differentially expressed genes for each murine cluster queried in human clusters. (E) Quantification of cluster designation for all SMARTA clones from WT and GP-expressing MC38. (F) Cluster localization for SMARTA clones is shown with SMARTA TCR (red) overlaid on full 2D UMAP (gray) of Treg isolated from MC38-GP (left) or MC38WT (right). (G) Averaged log2-transformed and library size–normalized FoxP3 expression values are shown. Visualized in red scale using full UMAP projection. (H) TBX21 (Tbet) expression is shown for TR-Treg (blue) and all other Treg (red) from the GP-expressing MC38 tumor after 14 days in vivo. (I) Five thousand TR-Treg and non–TR-Treg were sorted and cocultured ex vivo with 1000 dendritic cells loaded with the LCMV GP peptide for 48 hours. Supernatants were harvested and assayed for IFN-γ using the Meso Scale Discovery platform. Data are shown as IFN-γ production above background, defined as Treg cocultured with dendritic cells without peptide. Mann-Whitney test was used to compare average IFN-γ production between peptide-loaded and peptide-unloaded conditions (P = 0.33; n = 2). (J) Violin plot showing the TR-Treg score of adoptively transferred SMARTA TCRpos Treg before adoptive transfer (pre-AT) and at 1, 7, and 14 days of tumor residence. (K) Violin plot showing FoxP3 expression by adoptively transferred SMARTA TCR+ Treg before adoptive transfer (pre-AT) and at 1, 7, and 14 days of tumor residence. P values obtained by Student’s t test. The P value of the trend (Ptrend) was calculated for the TR-Treg score and normalized Foxp3 expression over time by testing the linear regression slope with null and alternative hypotheses: H0: β1 = 0 (the slope is equal to zero), HA: β1 ≠ 0 (the slope is not equal to zero). N = 5 to 10 mice per time point. (L) Volcano plots showing differentially expressed genes of SMARTA TCR+ Treg in day 7 versus day 1. X axis shows log2(fold change), and y axis shows −log10(FDR). Differentially expressed genes higher at day 7 are shown in red, and differentially expressed genes higher in 1 day are shown in blue. (M) TSDR methylation profile of sorted SMARTA TCR+CD25hiRFP+ Treg from female SMARTA;RIP-GP mice compared with control values (low, medium, and high). Residue numbers denote individual CpG motifs in reference to the transcription initiation site of FoxP3. Data are an average of n = 2 experimental replicates with cells from n = 3 mice pooled per experiment. Bar colors represent 0 to 100% methylation.
Fig. 4.
Fig. 4.. Murine TR-Treg gene signature defines an orthologous subset among human NSCLC TIL-Treg that is enriched in anti–PD-1 R.
(A) Red scale overlay of the TR-Treg gene score, with red indicating higher expression and blue indicating low expression. Red dotted line represents the UMAP region with highest expression. Refined clustering was performed on the TH1-like/cytotoxic subset, and 2D UMAP projection of six unique subclusters (SC0-SC5) is visualized by UMAP and marked by color code. (B) Relative expression of the top 10 most differential genes for each subcluster is visualized on a heatmap. (C) The expression of biologically relevant genes from the TR-Treg score is visualized in red scale. (D) Boxplots showing differences in expression of FoxP3 (P = 6.8 × 10⁻⁹), IL2RA (CD25; P = 1.9 × 10⁻¹), and TBX21 (Tbet, P = 0.00024) by TIL-Treg in SC0 versus all other Treg. Each dot represents an individual tumor sample per patient (n = 14). Comparisons were performed at the individual patient level using paired t test. Patient-averaged log2-transformed and library size–normalized expression values are shown. (E) Cell density plots of the TH1-like/cytotoxic Treg subclusters stratified by response/treatment status. The TR-Treg scorehi population is indicated with a dotted line. Increased density is represented by red scale, and decreased density is represented by green/blue. (F) Boxplots showing the frequency of SC0 in the tumors (left) and adjacent NLs (right) of NR (red) and responders (blue). Comparisons were performed at the individual patient level using Wilcoxon rank test. (G) Diffusion map with RNA velocity between SC0, Activated (1)/OX40hiGITRhi, and LN-homing clusters for NR (left) and R (right). (H) Cross-cluster sharing of Treg TCR clonotypes detected in the SC0 subcluster with non-SC0 Treg and Tconv clusters (as shown in fig. S1C). Red indicates a higher frequency of the clone in the relevant subcluster. Tcm, central memory T cells; Tem, effector memory T cells.

References

    1. Kanwal B, Biswas S, Seminara RS, Jeet C, Immunotherapy in advanced non-small cell lung cancer patients: Ushering chemotherapy through the checkpoint inhibitors? Cureus 10, e3254 (2018). - PMC - PubMed
    1. Caushi JX, Zhang J, Ji Z, Vaghasia A, Zhang B, Hsiue EH-C, Mog BJ, Hou W, Justesen S, Blosser R, Tam A, Anagnostou V, Cottrell TR, Guo H, Chan HY, Singh D, Thapa S, Dykema AG, Burman P, Choudhury B, Aparicio L, Cheung LS, Lanis M, Belcaid Z, El Asmar M, Illei PB, Wang R, Meyers J, Schuebel K, Gupta A, Skaist A, Wheelan S, Naidoo J, Marrone KA, Brock M, Ha J, Bush EL, Park BJ, Bott M, Jones DR, Reuss JE, Velculescu VE, Chaft JE, Kinzler KW, Zhou S, Vogelstein B, Taube JM, Hellmann MD, Brahmer JR, Merghoub T, Forde PM, Yegnasubramanian S, Ji H, Pardoll DM, Smith KN, Transcriptional programs of neoantigen-specific TIL in anti-PD-1-treated lung cancers. Nature 596, 126–132 (2021). - PMC - PubMed
    1. Turner JA, Stephen-Victor E, Wang S, Rivas MN, Abdel-Gadir A, Harb H, Cui Y, Fanny M, Charbonnier L-M, Fong JJH, Benamar M, Wang L, Burton OT, Bansal K, Bry L, Zhu C, Li Q-Z, Clement RL, Oettgen HC, Crestani E, Rachid R, Sage PT, Chatila TA, Regulatory T cell-derived TGF-β1 controls multiple checkpoints governing allergy and autoimmunity. Immunity 53, 1202–1214.e6 (2020). - PMC - PubMed
    1. Miyara M, Sakaguchi S, Natural regulatory T cells: Mechanisms of suppression. Trends Mol. Med 13, 108–116 (2007). - PubMed
    1. Nagai H, Horikawa T, Hara I, Fukunaga A, Oniki S, Oka M, Nishigori C, Ichihashi M, In vivo elimination of CD25+ regulatory T cells leads to tumor rejection of B16F10 melanoma, when combined with interleukin-12 gene transfer. Exp. Dermatol 13, 613–620 (2004). - PubMed

Publication types