. 2023 Sep 15;8(87):eadf6717.
doi: 10.1126/sciimmunol.adf6717. Epub 2023 Sep 15.

Integrated BATF transcriptional network regulates suppressive intratumoral regulatory T cells

Affiliations

Integrated BATF transcriptional network regulates suppressive intratumoral regulatory T cells

Feng Shan et al. Sci Immunol. .

Abstract

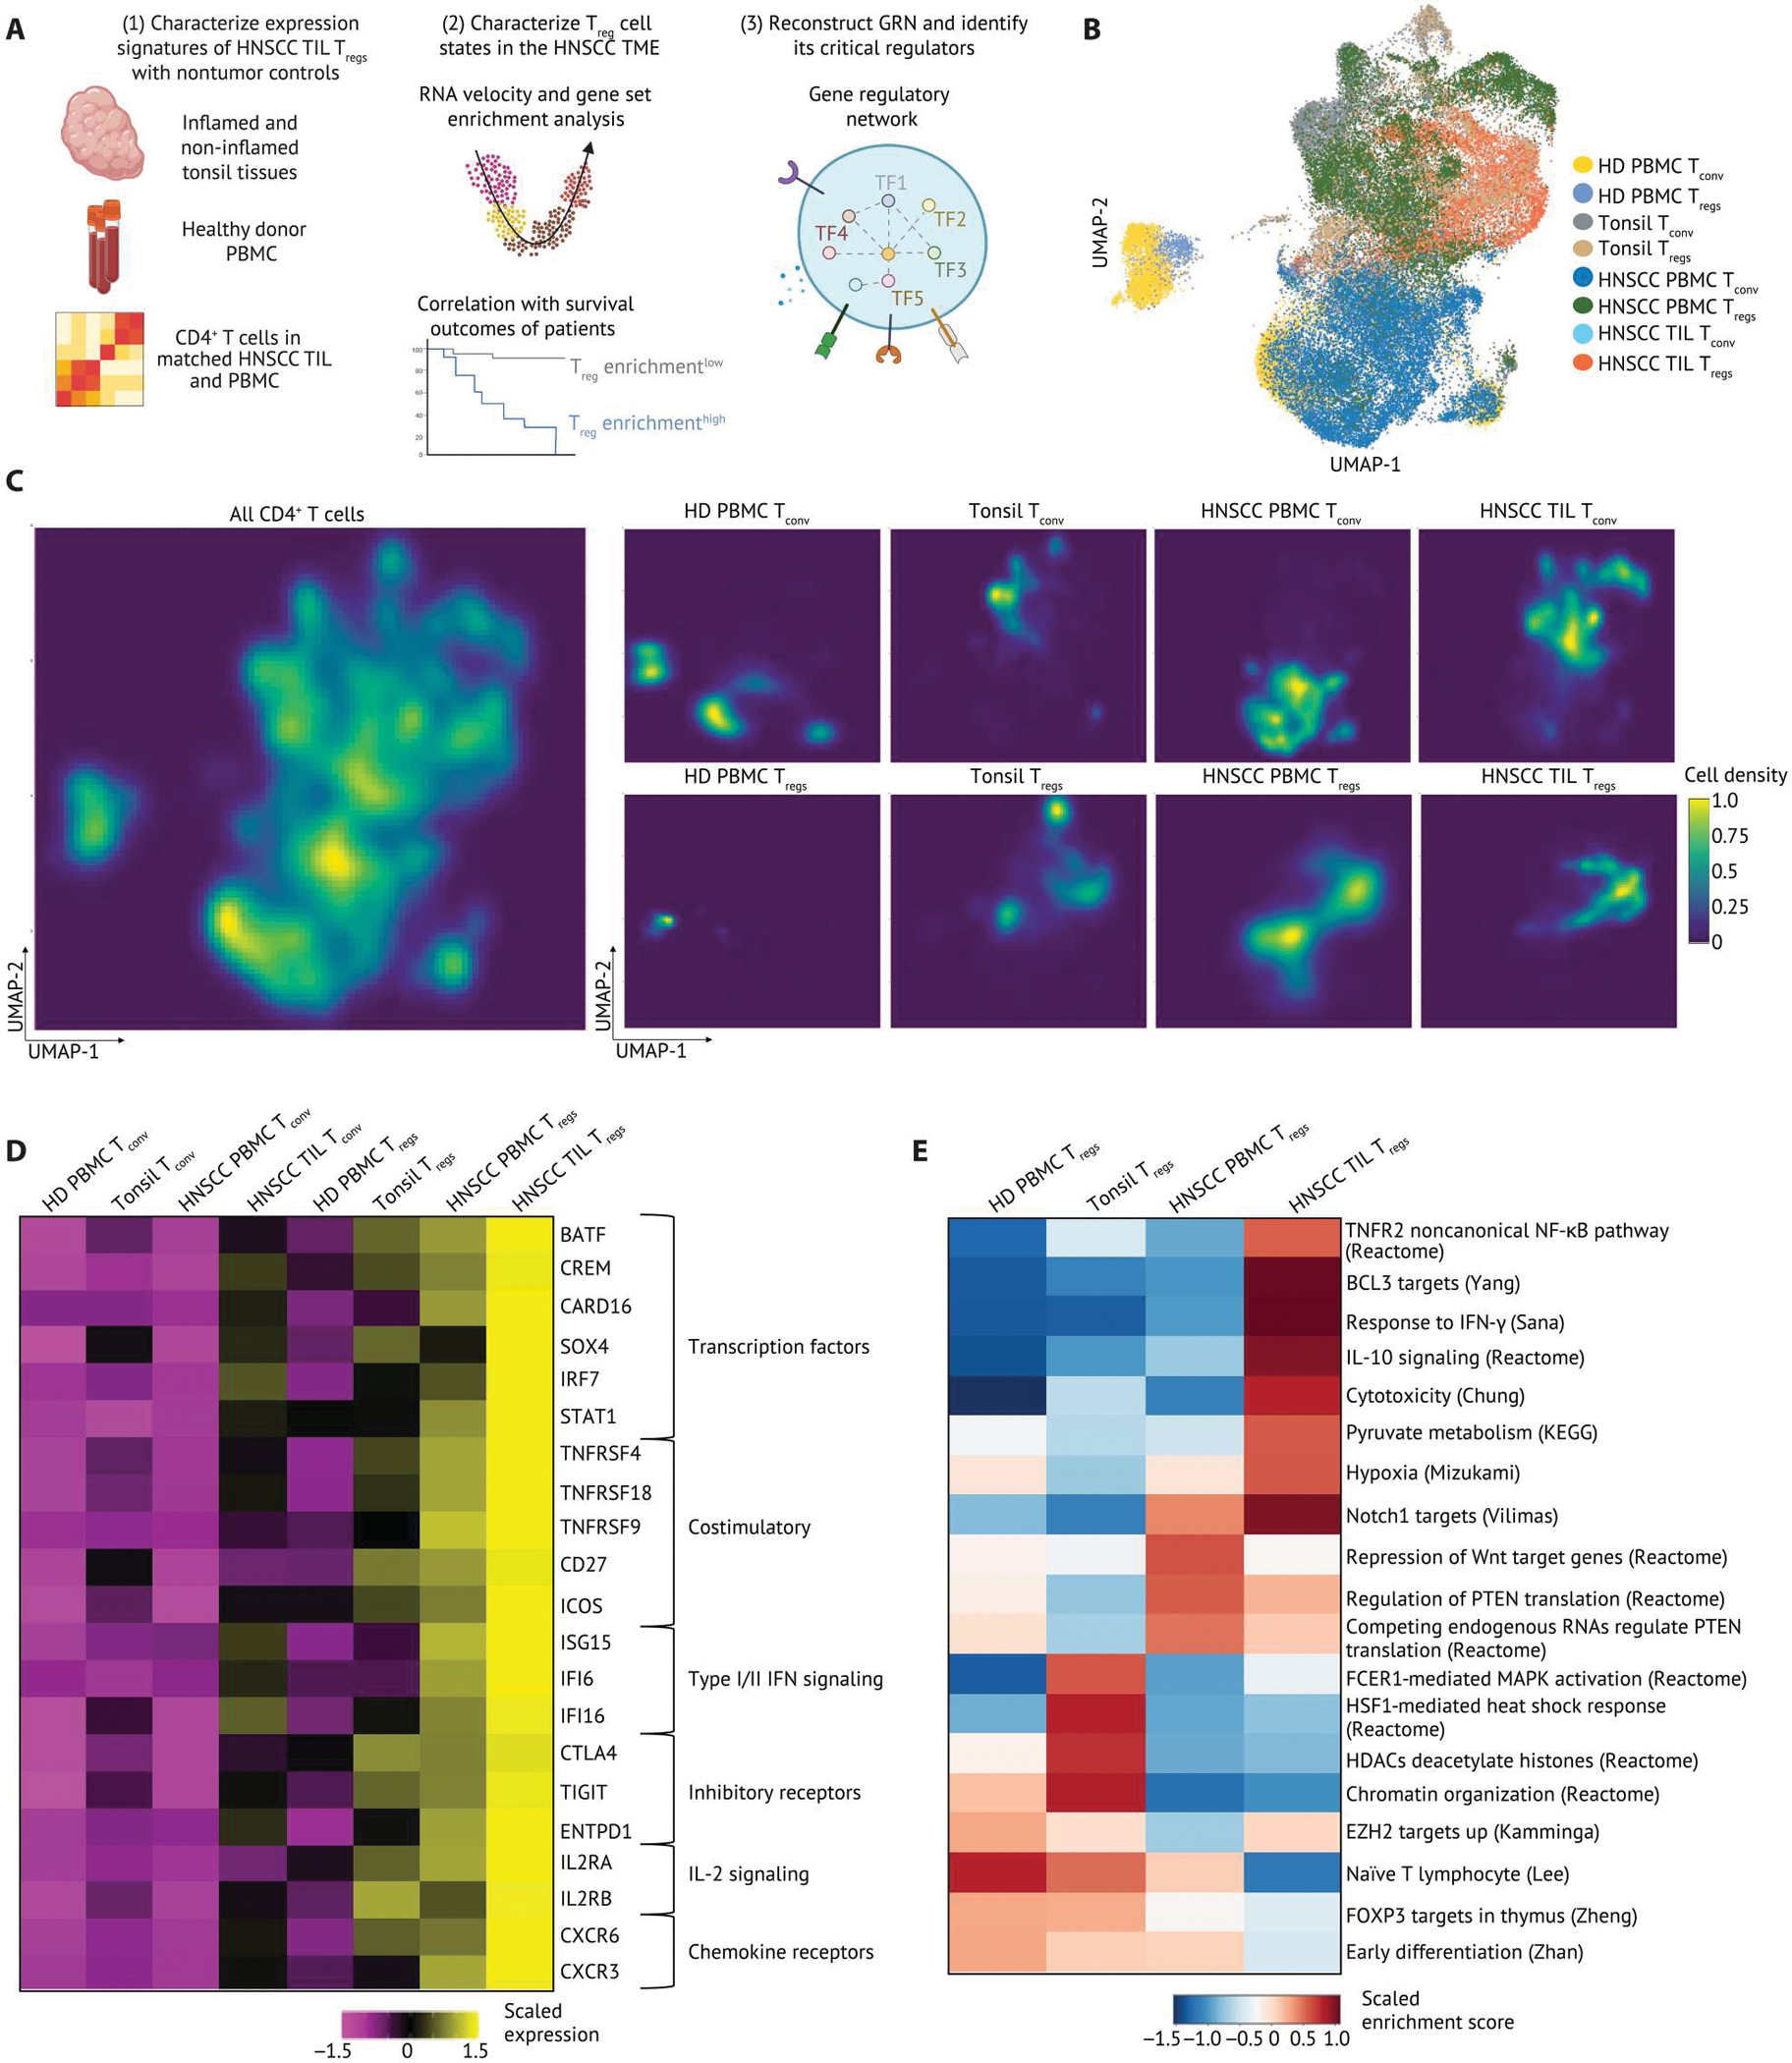
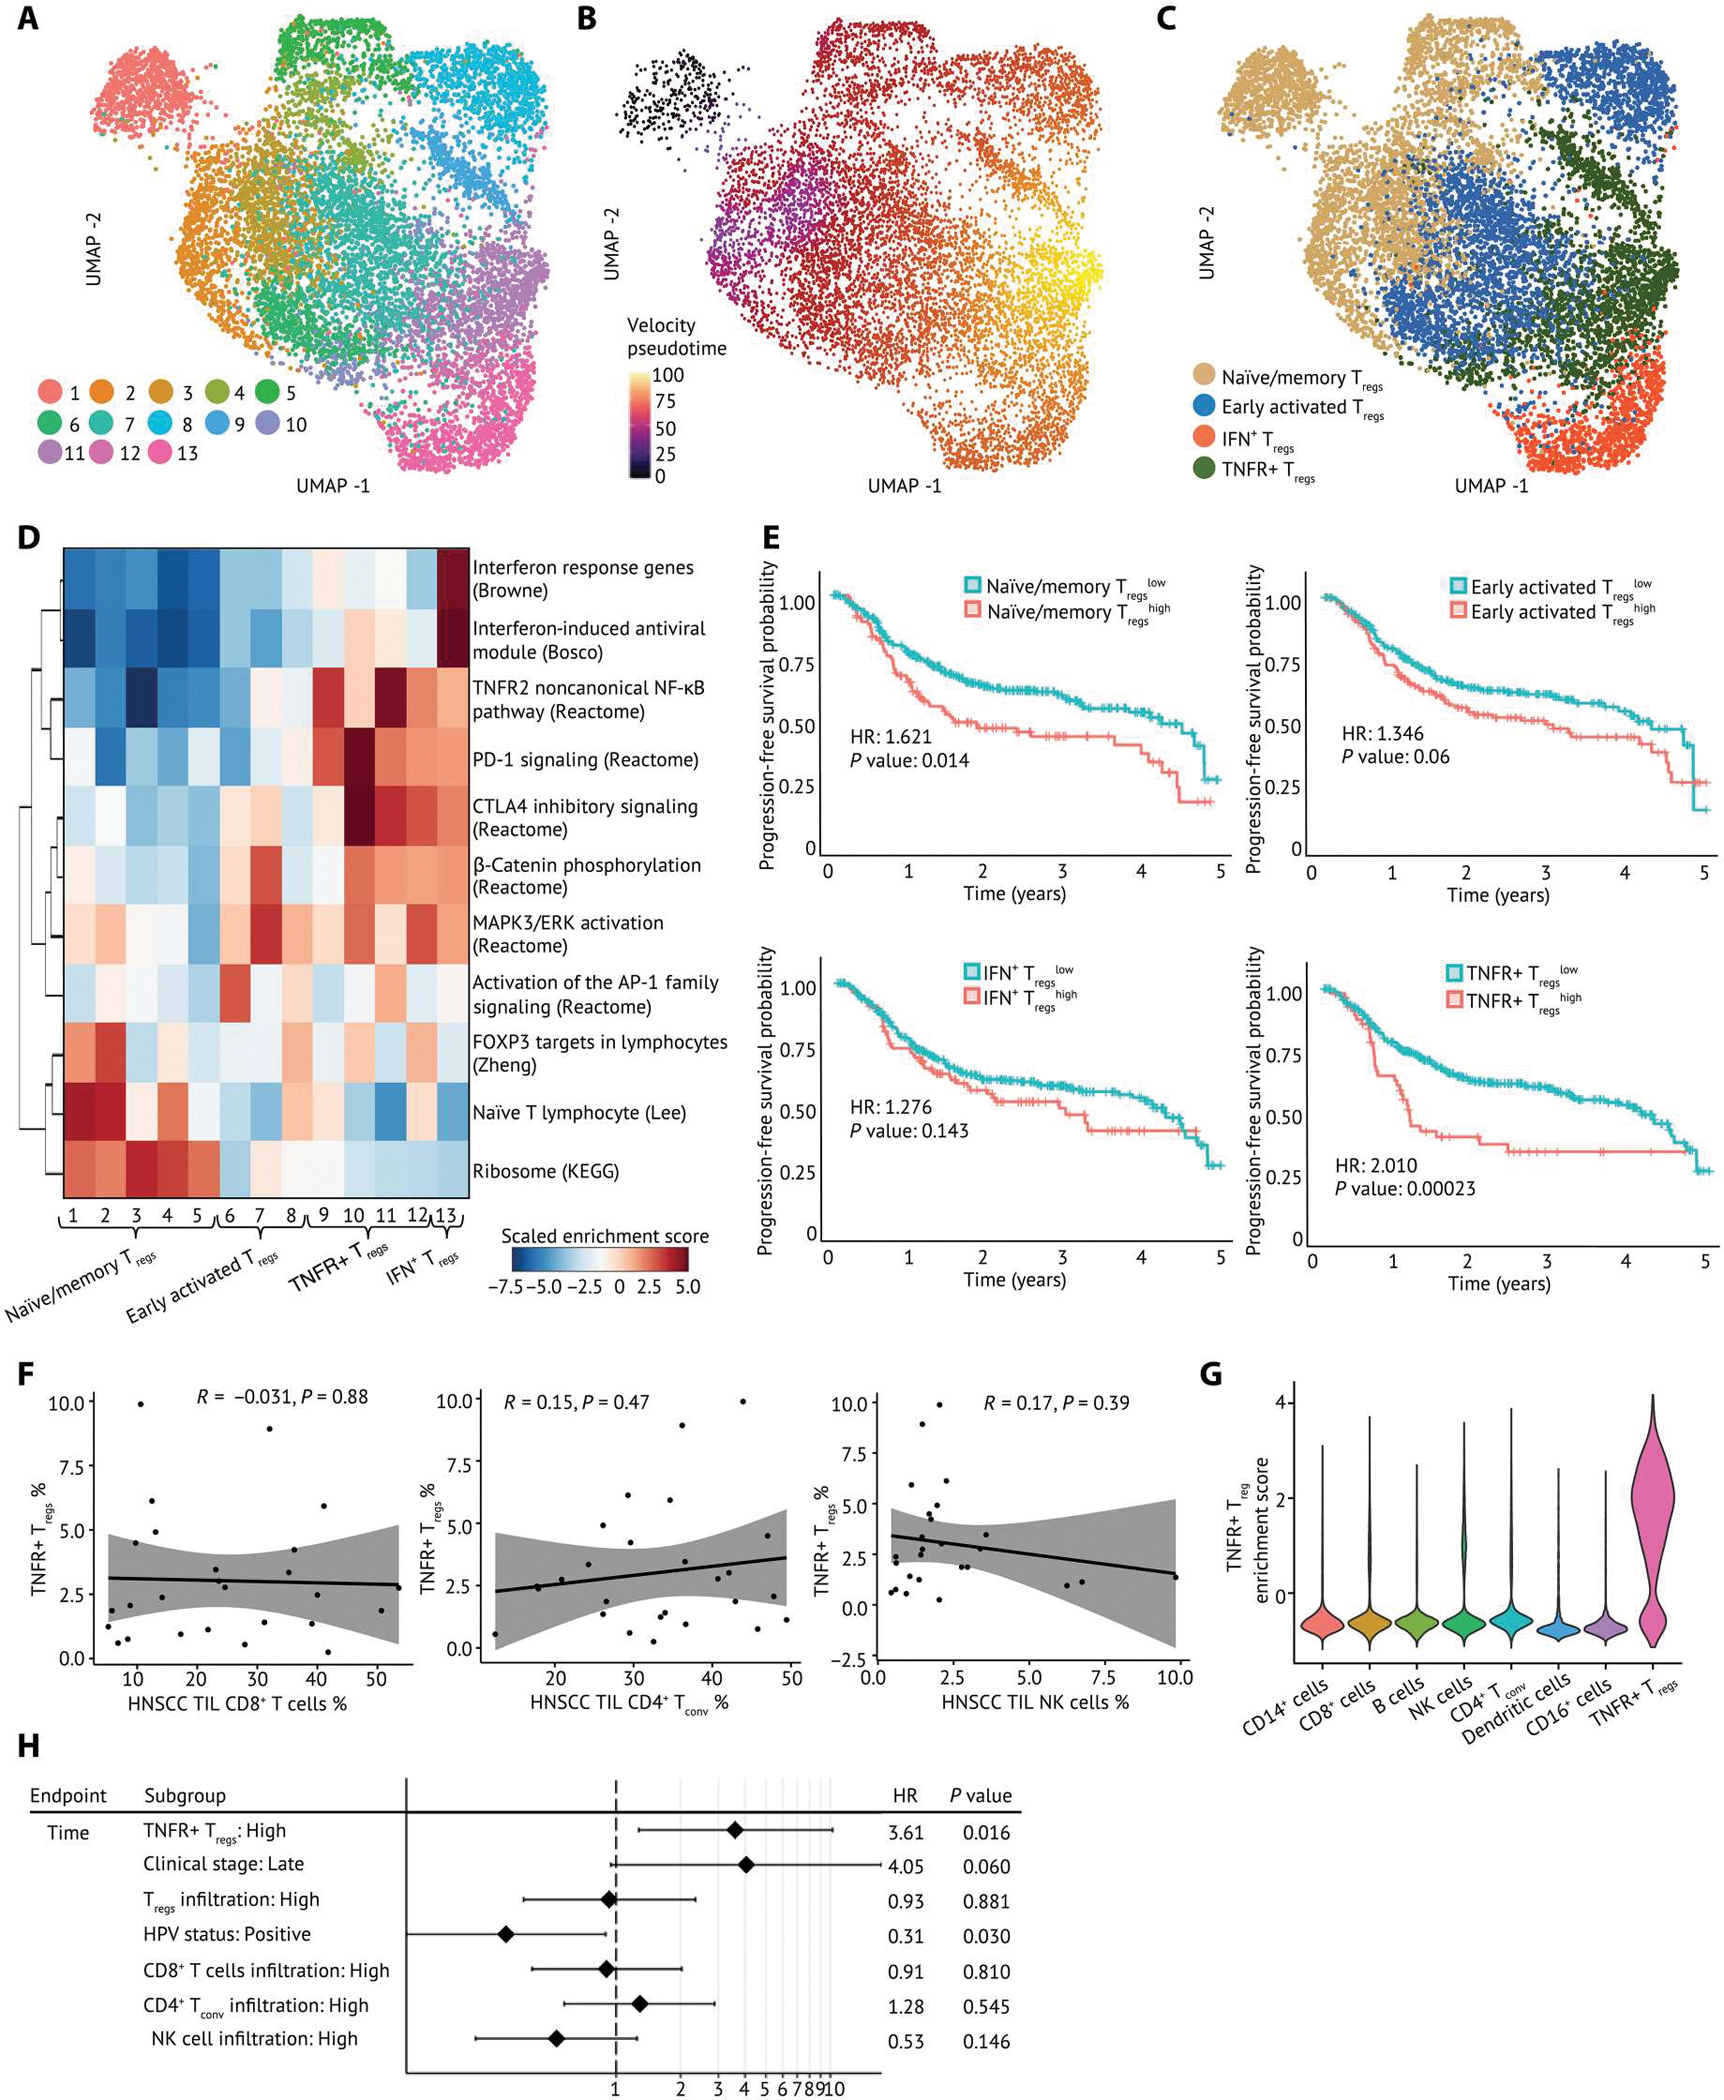
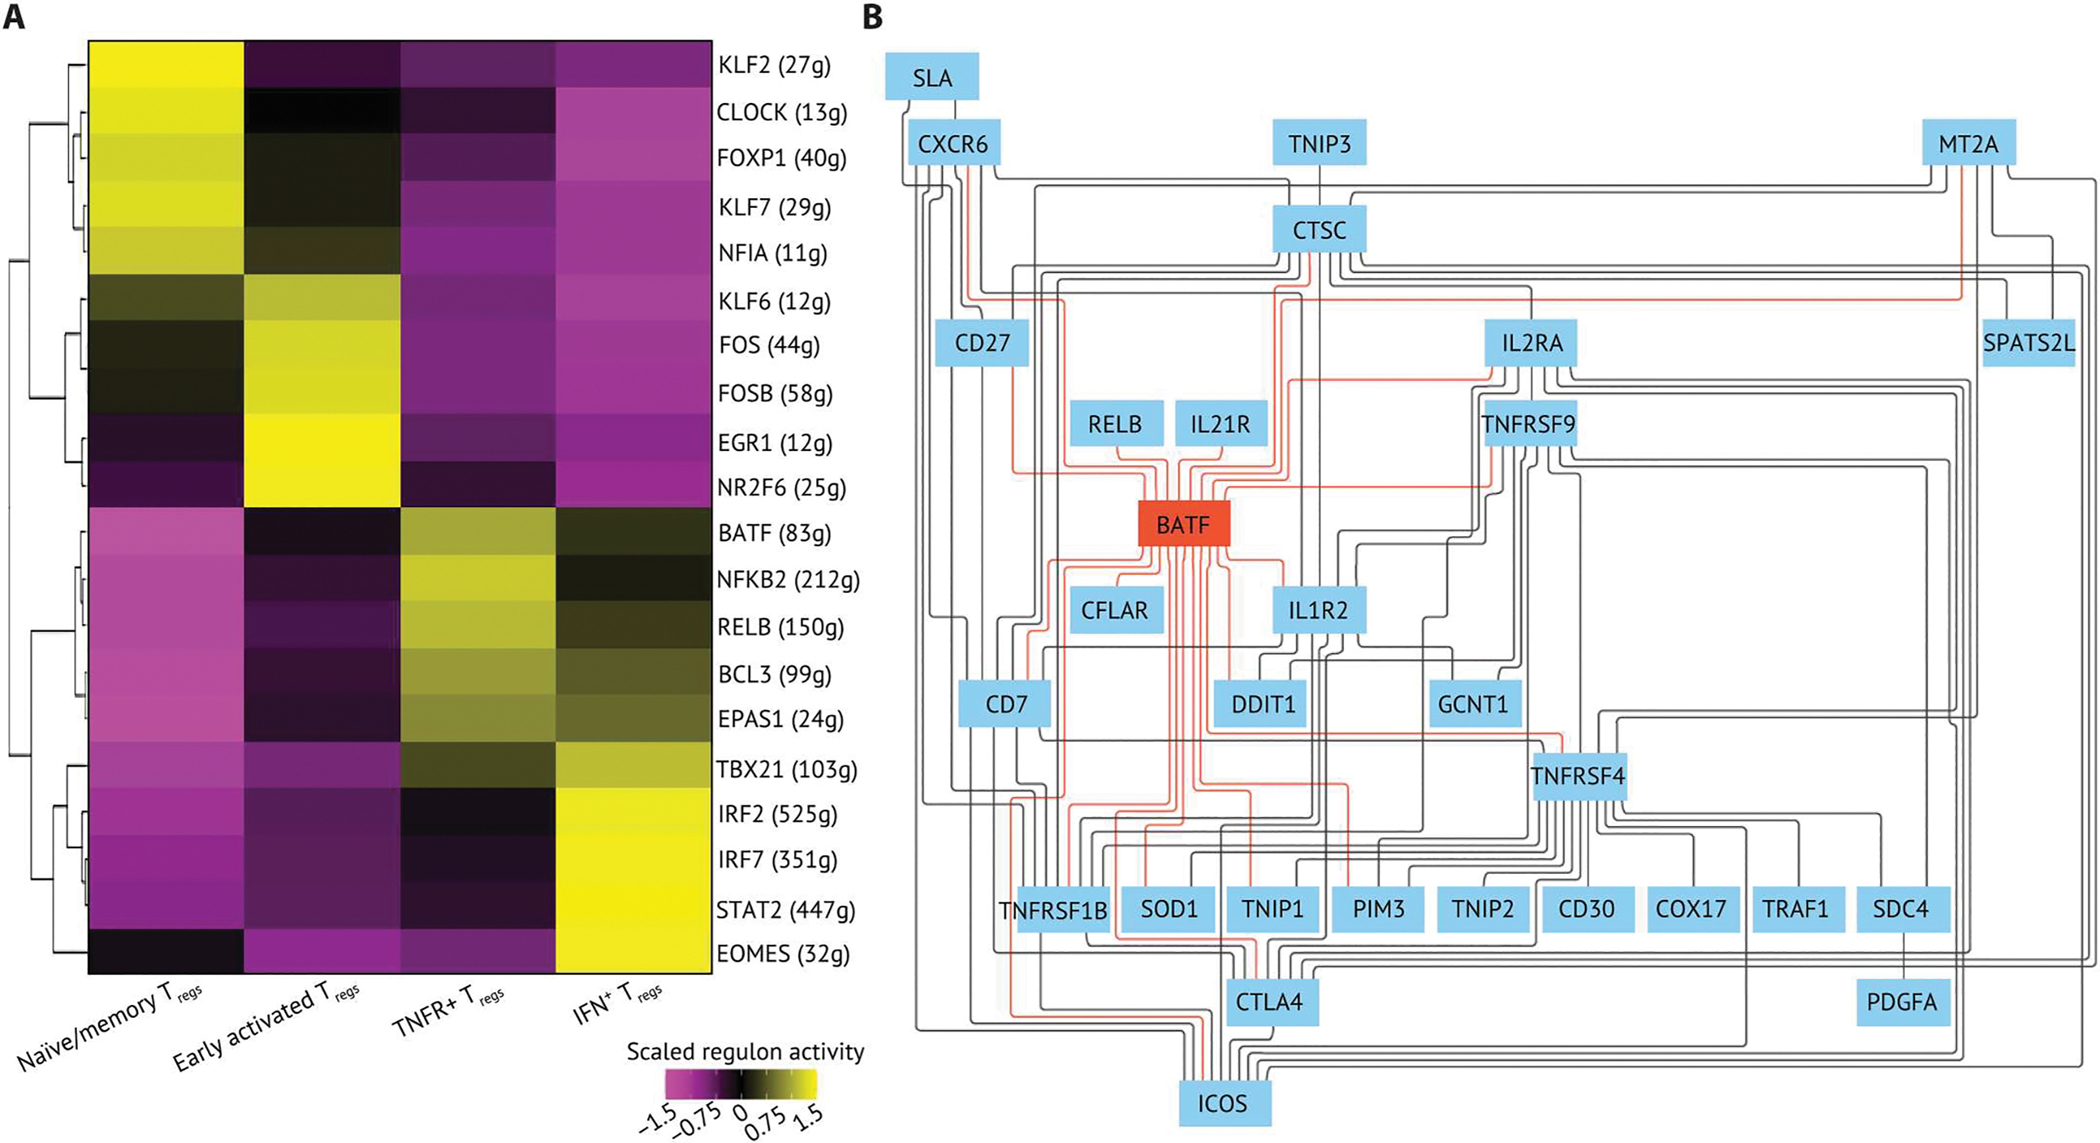
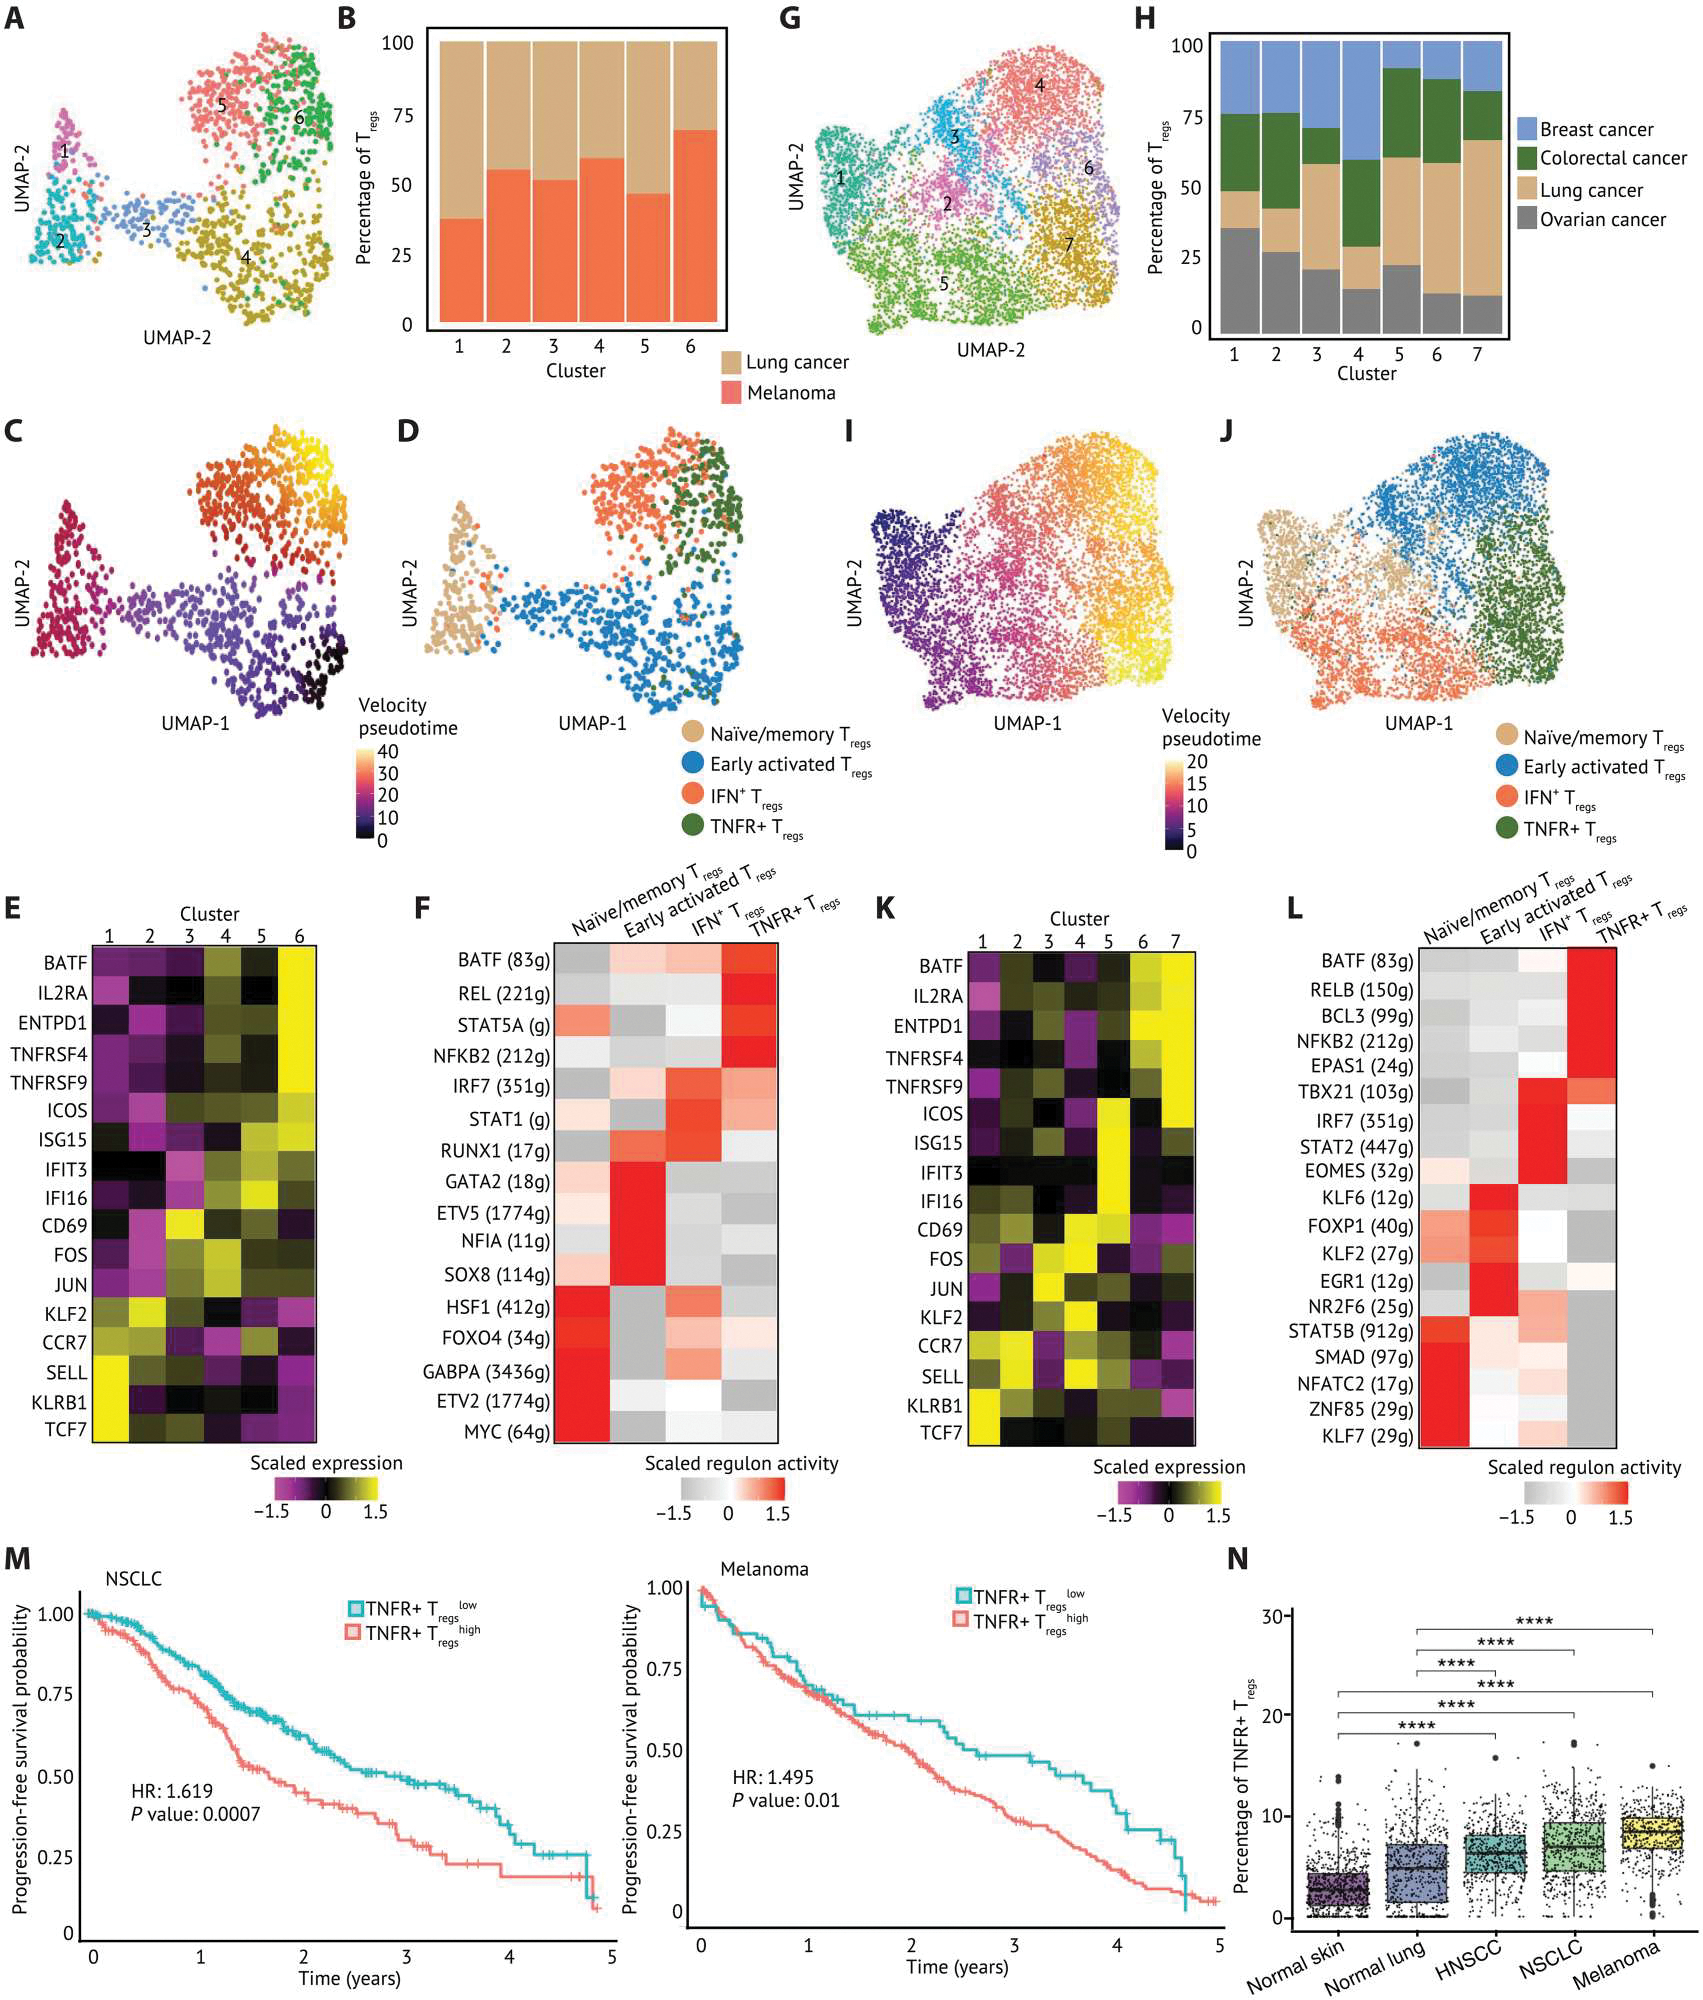
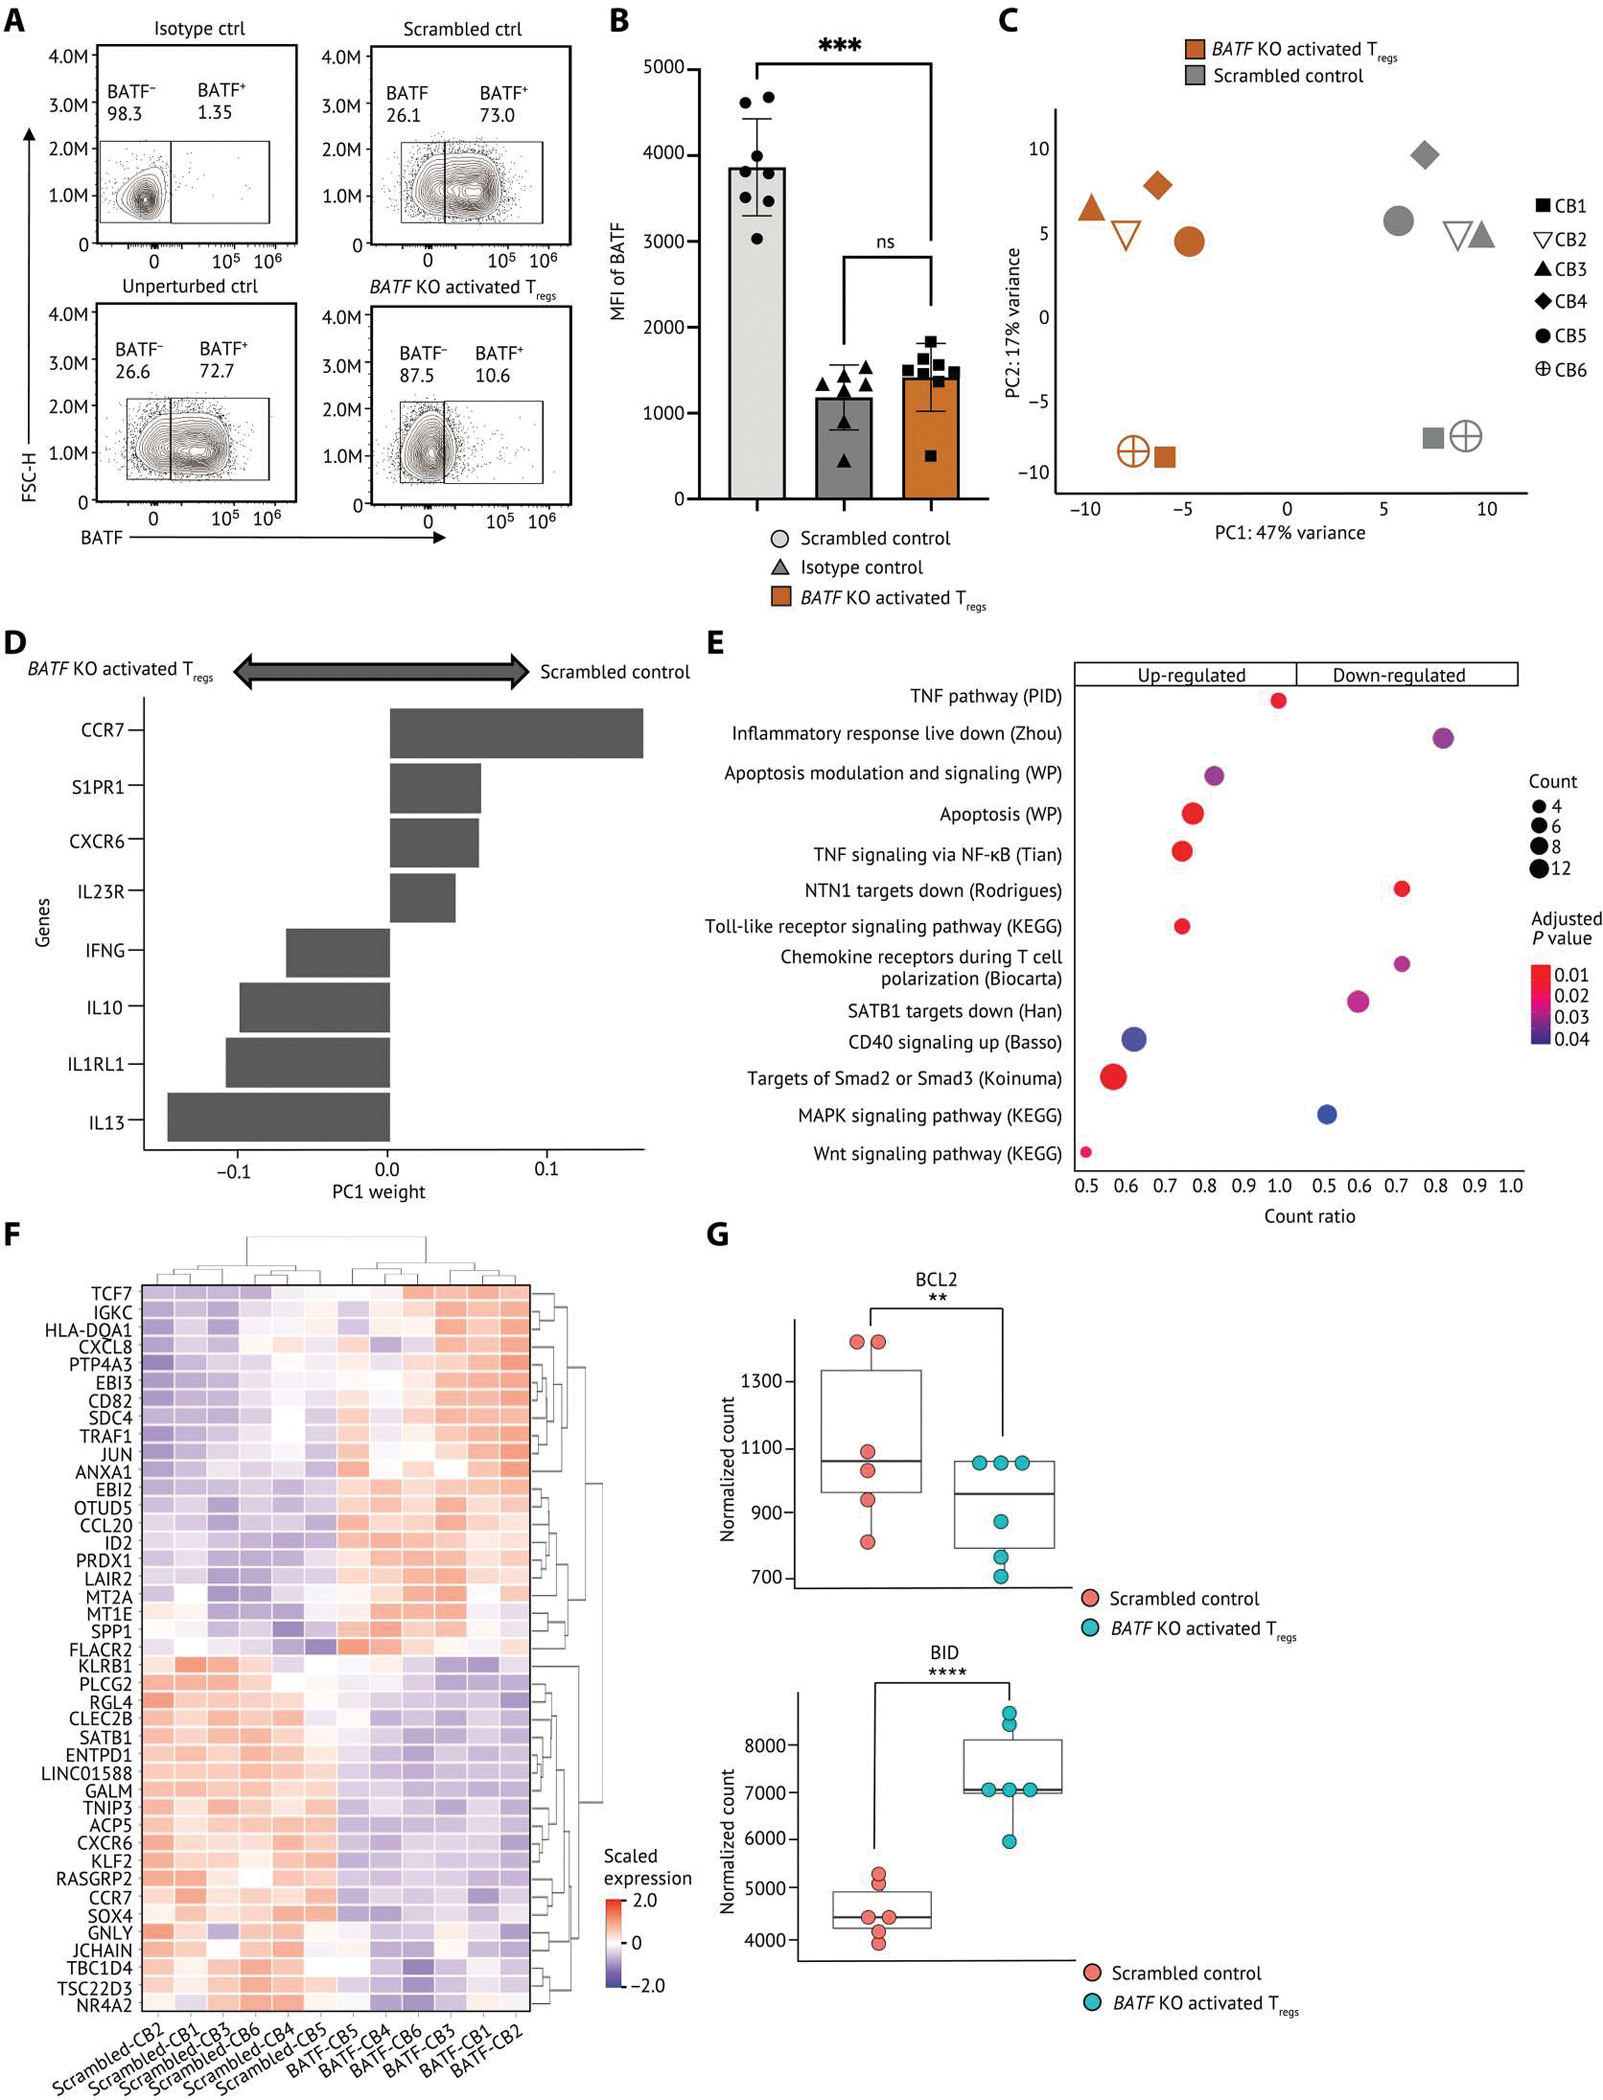
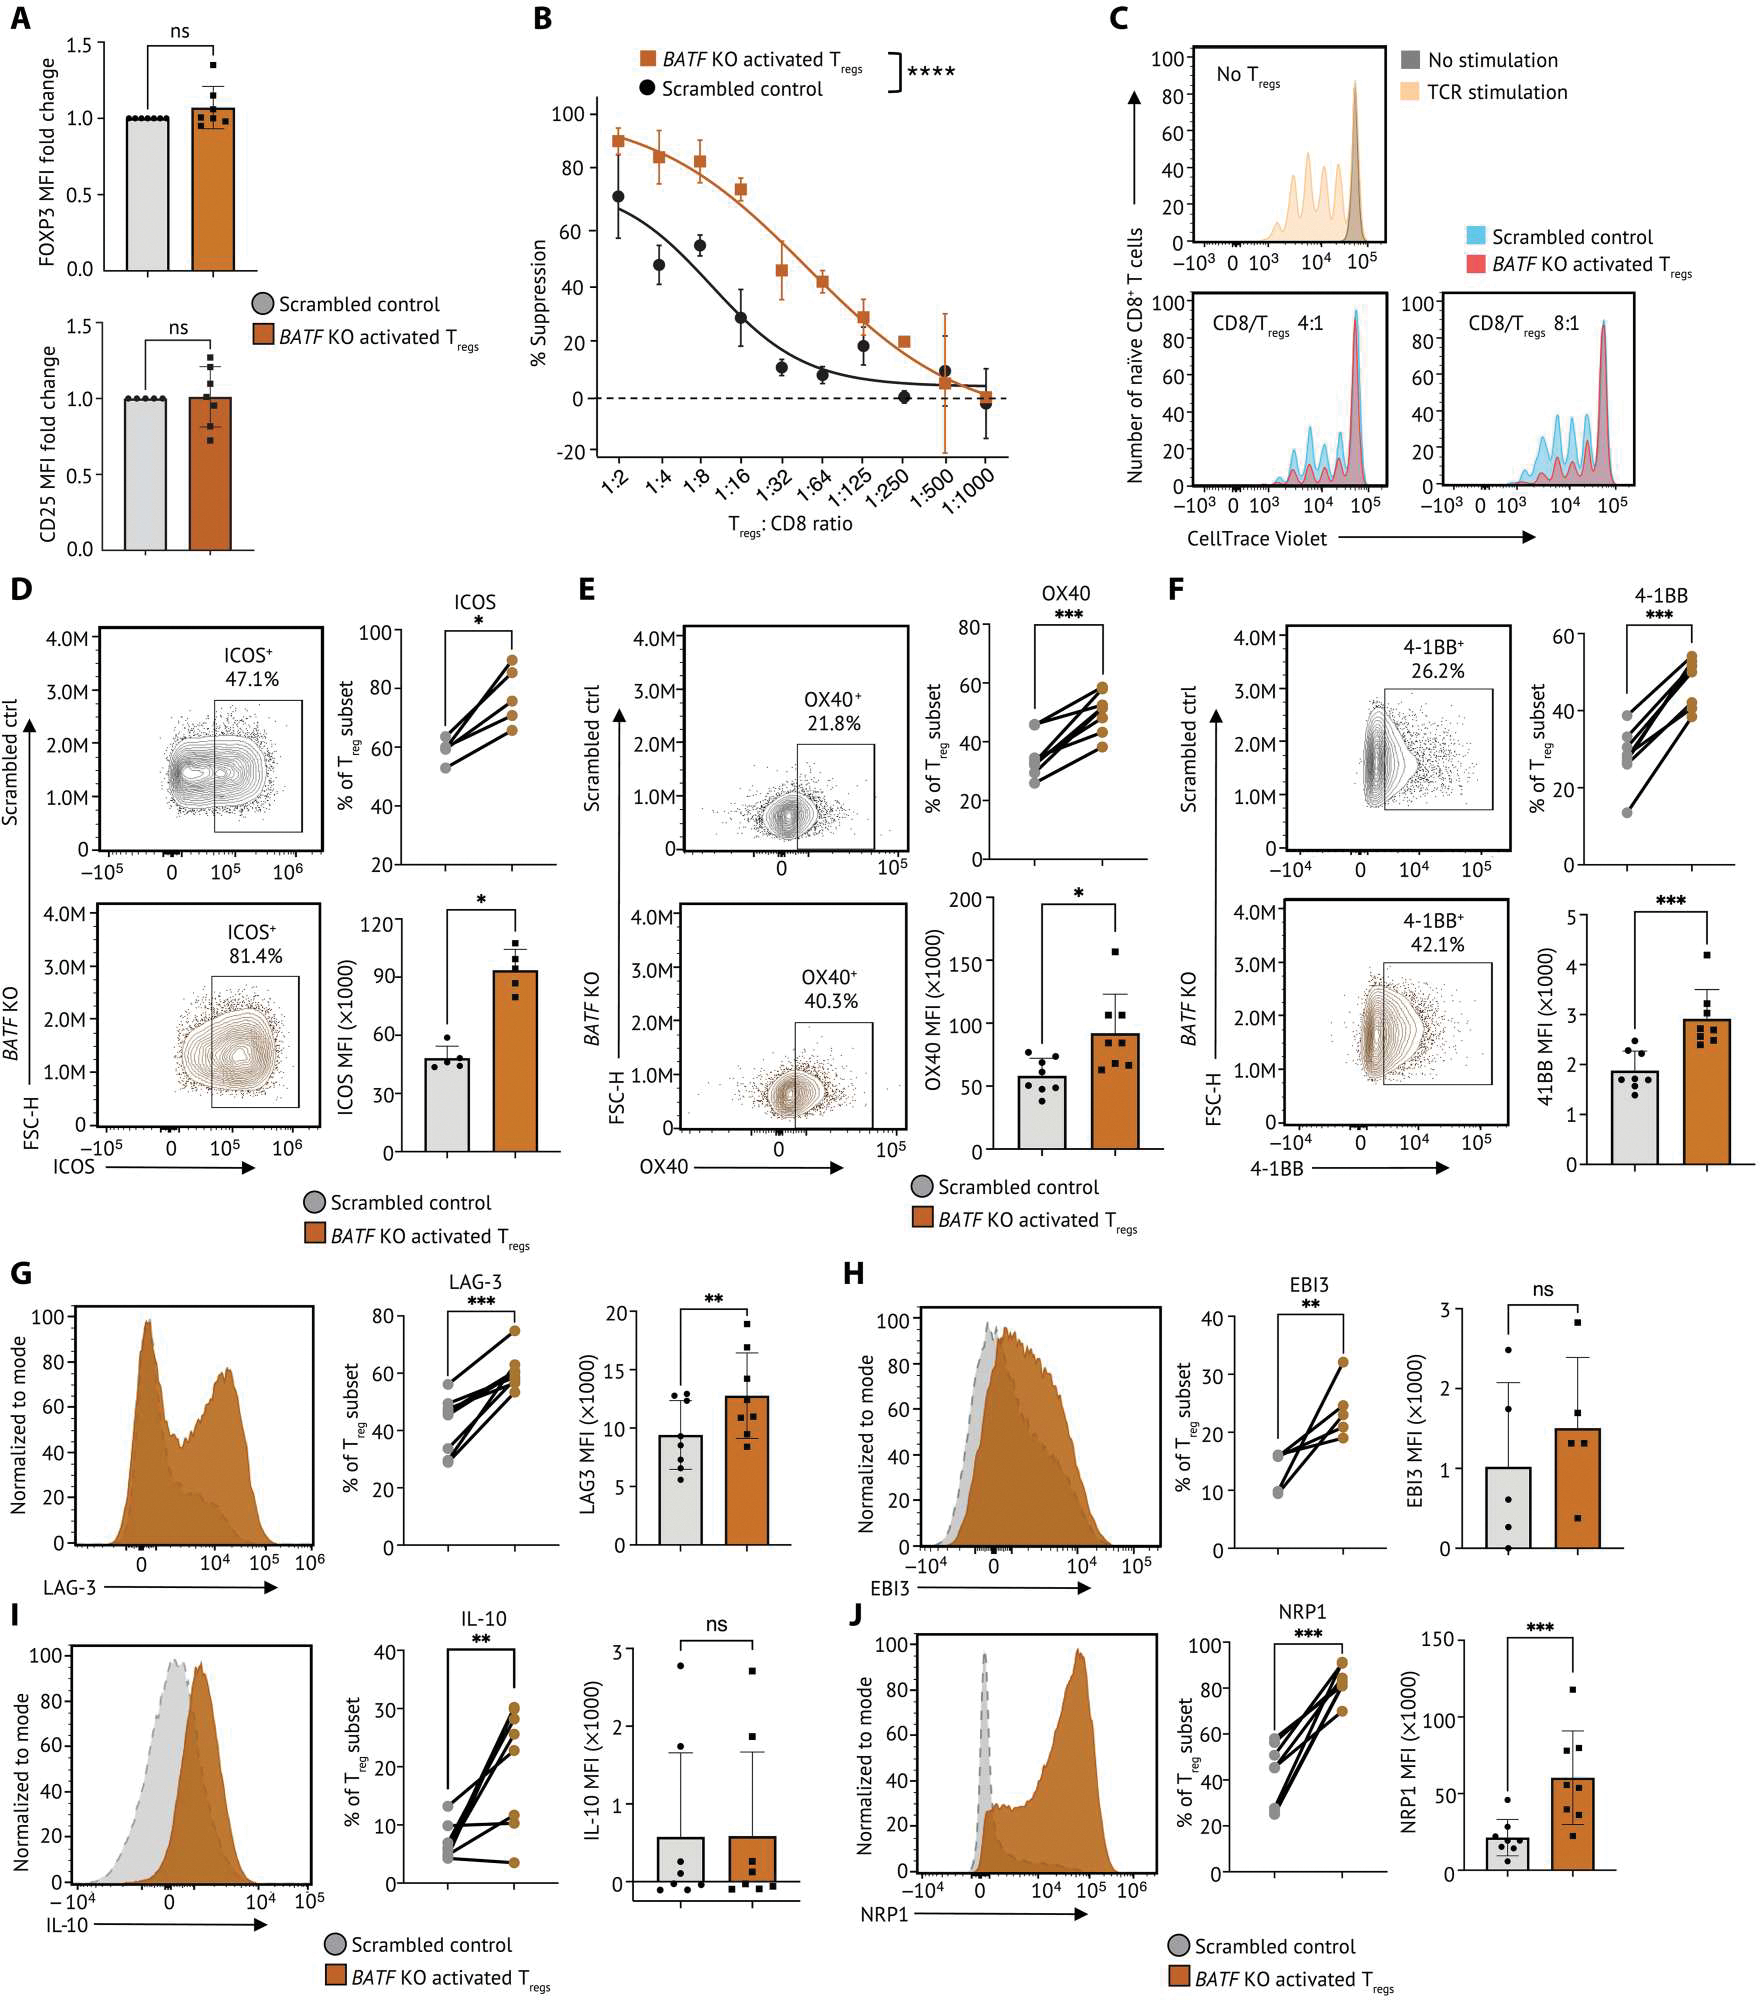
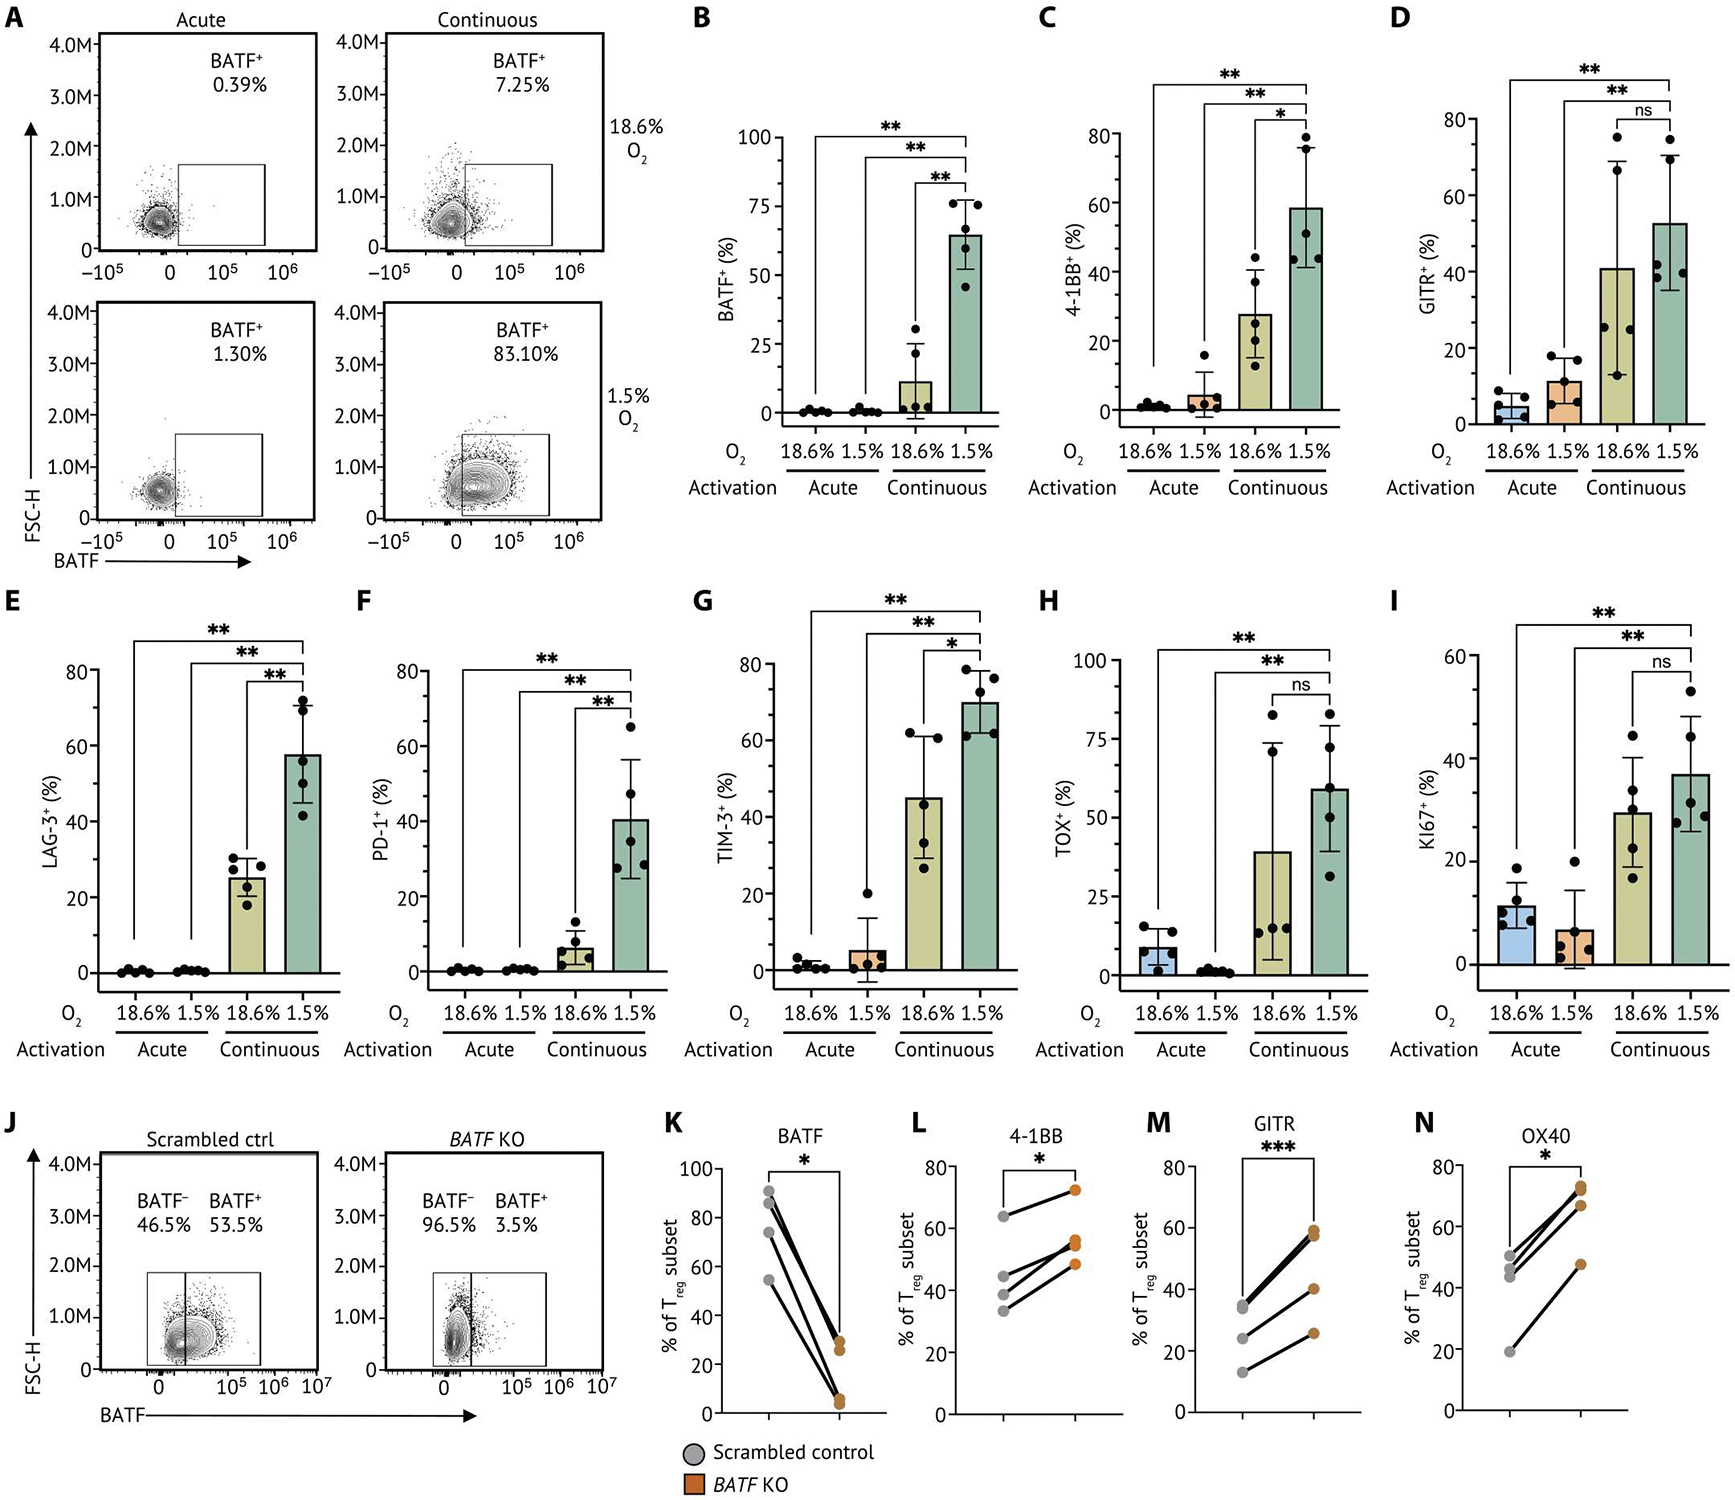
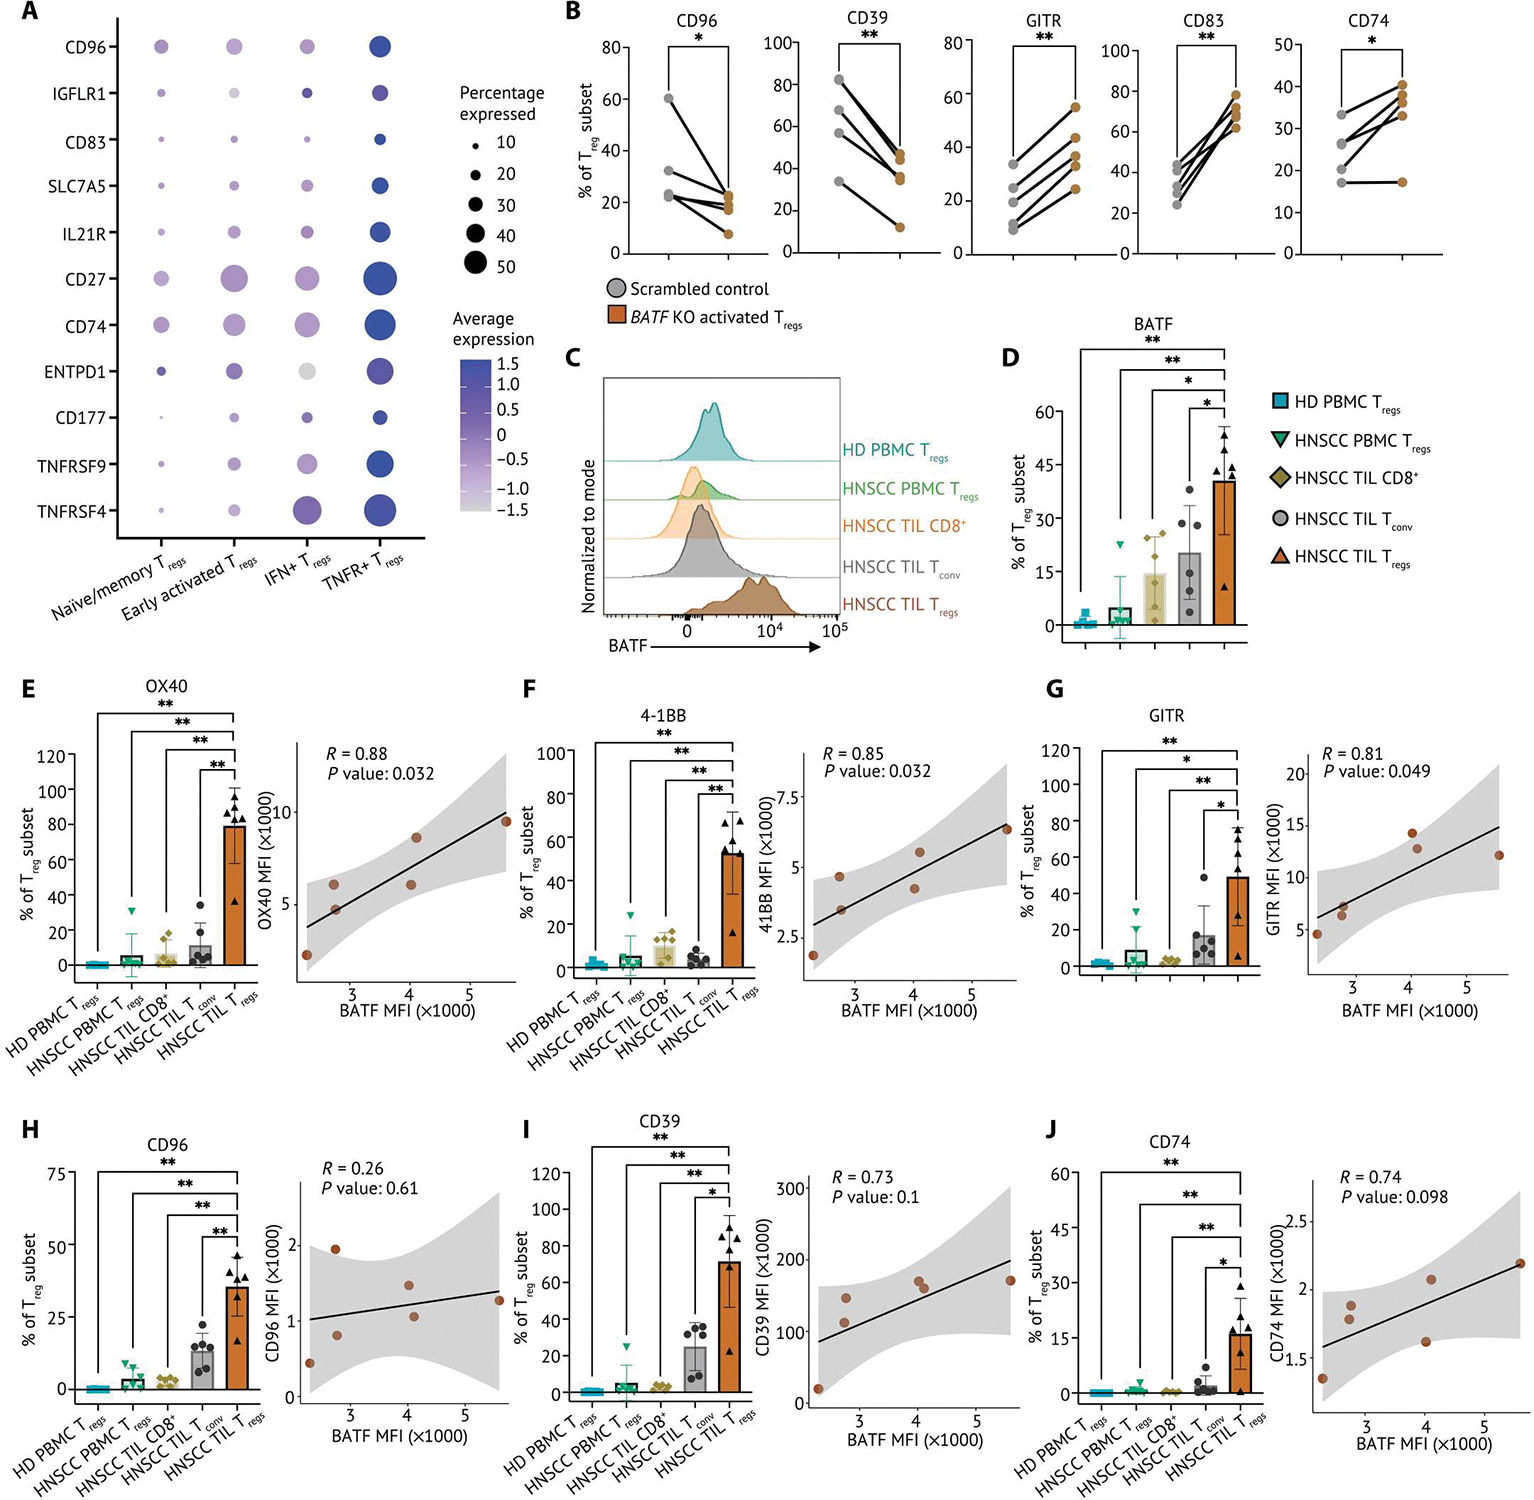
Human regulatory T cells (Tregs) are crucial regulators of tissue repair, autoimmune diseases, and cancer. However, it is challenging to inhibit the suppressive function of Tregs for cancer therapy without affecting immune homeostasis. Identifying pathways that may distinguish tumor-restricted Tregs is important, yet the transcriptional programs that control intratumoral Treg gene expression, and that are distinct from Tregs in healthy tissues, remain largely unknown. We profiled single-cell transcriptomes of CD4+ T cells in tumors and peripheral blood from patients with head and neck squamous cell carcinomas (HNSCC) and those in nontumor tonsil tissues and peripheral blood from healthy donors. We identified a subpopulation of activated Tregs expressing multiple tumor necrosis factor receptor (TNFR) genes (TNFR+ Tregs) that is highly enriched in the tumor microenvironment (TME) compared with nontumor tissue and the periphery. TNFR+ Tregs are associated with worse prognosis in HNSCC and across multiple solid tumor types. Mechanistically, the transcription factor BATF is a central component of a gene regulatory network that governs key aspects of TNFR+ Tregs. CRISPR-Cas9-mediated BATF knockout in human activated Tregs in conjunction with bulk RNA sequencing, immunophenotyping, and in vitro functional assays corroborated the central role of BATF in limiting excessive activation and promoting the survival of human activated Tregs. Last, we identified a suite of surface molecules reflective of the BATF-driven transcriptional network on intratumoral Tregs in patients with HNSCC. These findings uncover a primary transcriptional regulator of highly suppressive intratumoral Tregs, highlighting potential opportunities for therapeutic intervention in cancer without affecting immune homeostasis.


Conflict of interest statement

Competing interests: D.A.A.V. is cofounder and stockholder of Novasenta, Potenza, Tizona, and Trishula; stockholder of Oncorus and Werewolf; has patents licensed and royalties from BMS and Novasenta; scientific advisory board member of Tizona, Werewolf, F-Star, Bicara, Apeximmune, and T7/Imreg Bio; is a consultant for BMS, Incyte, Regeneron, Ono Pharma, and Avidity Partners; and obtained research funding from BMS and Novasenta. T.C.B. receives research funding for Alkermes and Pfizer and is a consultant for Walking Fish Therapeutics, iTeos Therapeutics, and BeSpoke Therapeutics. A.R.C. is a consultant for AboundBio. A.P. is an investigator in a research grant to UPMC from Novasenta. J.D.L. is an investigator in a research grant to UPMC from Novasenta. All other authors declare that they have no competing interests.

Figures

Fig. 1.
Fig. 1.. Intratumoral CD4+ T cells have distinct transcriptional signatures.
(A) Schematic of the experimental setup. Live Tconv and Tregs from HD blood and tonsil tissues were sequenced using 10X Genomics 3′ based scRNA-seq. scRNA-seq data were integrated with data from a previous study (19). We leveraged multiple bioinformatic approaches to identify cell types and states, infer drivers of differentiation, and reconstructed GRNs using SCENIC and causal MGM. (B) UMAP embedding and clustering of 51,195 CD4+ T cells from matched TILs and PBMCs from patients with HNSCC (n = 26), tonsil tissues from patients with tonsilitis (n = 5), tonsil tissues from patients with sleep apnea (n = 6), and HD PBMCs (n = 10). UMAP embedding of 51,195 CD4+ T cells were color-coded by cell type and cell origin. (C) Two-dimensional galaxy plots of CD4+ T cells were grouped by cell origins, and lighter color is indicative of a higher density of cells across sample groups. (D) A heatmap of gene signatures differentially expressed in HNSCC TIL Tregs compared with all other cells. The expression is scaled by transforming the gene expression in each population to zero mean, and unit SD is shown in the heatmap. (E) Selected gene sets that were highly enriched in subsets of Tregs were visualized on a heatmap. Tregs were grouped on the basis of the cell origin. The z-score of gene sets in each Treg subset was calculated by R package Singleseqgset. Similarly, the enrichment score is scaled by row. KEGG, Kyoto Encyclopedia of Genes and Genomes. PTEN, phosphatase and tensin homolog.
Fig. 2.
Fig. 2.. Intratumoral Tregs are heterogeneous in the HNSCC TME and regulated by distinct transcriptional programs.
(A) A UMAP embedding of 9688 Tregs across all samples. Thirteen clusters were identified by Louvian graph–based unbiased clustering. (B) Pseudotime was derived from RNA velocity and visualized on a UMAP embedding, which revealed a differentiation process across Treg clusters. (C) Tregs were annotated by cell state and visualized in a UMAP embedding. (D) Gene set enrichment analysis across Treg clusters identified distinct phenotypes of Tregs. Specifically, clusters 1 to 5 are associated with naïve/memory Treg phenotype, clusters 6 to 8 have an early activated Treg phenotype, clusters 9 to 13 exhibit an activated Treg phenotype, clusters 9 to 12 are enriched for TNFR member genes, and cluster 13 has IFN response genes and a TH1-like expression signature. The enrichment score is scaled by row. (E) Association of the enrichment of each Treg subpopulation with survival outcomes of patients with HNSCC was calculated and visualized on Kaplan-Meier curves. Hazard ratio (HR) is calculated by monovariate Cox proportional regression, and the P value is calculated by likelihood ratio test. (F) Scatterplots of correlation between the frequency of TNFR+ Tregs and CD8+ T cells, CD4+ Tconv, and NK cells. Pearson correlation coefficient (R) and P values (P) are calculated between TNFR+ Tregs and each cell type. The proportion of each type among all lymphocytes in the HNSCC TME is shown. (G) Violin plot of the TNFR+ Treg signature in other cell types in the HNSCC TME. (H) Multivariable analysis of the enrichment of TNFR+ Tregs and PFS outcomes.
Fig. 3.
Fig. 3.. An integrated BATF transcriptional network regulates key phenotypes of TNFR+ Tregs.
(A) The top five regulons differentially expressed in each Treg state were ranked by log2 fold change and visualized on a heatmap. The regulons were generated by using SCENIC with all Tregs (n = 9736) in the dataset. The regulon score was calculated by using AUCell in R, and the regulon score of each Treg subpopulation is scaled by row. The top five regulons were determined by their log2 fold change. (B) The GRN of TNFR+ Tregs. The GRN was constructed using directed MGM and FCI-MAX modeling with TFs and downstream targets from the top five regulons in TNFR+ Tregs. The direct connections between BATF and target genes are colored in red.
Fig. 4.
Fig. 4.. TNFRSF-activated Tregs are highly enriched in solid TME compared with nontumor tissues and associated with worse prognosis across solid tumors.
(A) A UMAP embedding of 1294 Tregs in TILs and PBMCs from patients with melanoma (n = 4), NSCLC (n = 4), and SCLC (n = 1). Six clusters were identified by Louvian graph–based unbiased clustering. (B) A stacked barplot of percentage of Tregs in each cluster showed that Tregs from lung cancer and melanoma were distributed across six clusters. (C) Pseudotime derived from RNA velocity was visualized in a UMAP embedding, suggesting that Tregs in cluster 6 were at later pseudotime and more terminally differentiated. (D) Tregs were annotated by cell state and visualized in a UMAP embedding based on the cell state–related canonical marker genes, gene sets, and pseudotime inference. (E) The relative expression of selected canonical marker genes is visualized on a heatmap. (F) The top five regulons differentially expressed in each Treg cluster ranked by log2 fold change were visualized on a heatmap. (G) A UMAP embedding of 7045 Tregs in TIL from patients with ovarian cancer (n = 5), lung cancer (n = 8), breast cancer (n = 14), and colorectal cancer (n = 7). Seven clusters were identified by unbiased clustering. (H) A stacked barplot of percentage of Tregs in each cluster highlights the distribution of Tregs from each tumor type. Clusters 6 and 7 were mixed with Tregs across tumor types. (I) Pseudotime inferred by Slingshot was visualized in a UMAP embedding. (J) Tregs were annotated by cell state and visualized in a UMAP embedding. (K) The relative expression of selected canonical marker genes is visualized on a heatmap. (L) The top five regulons differentially expressed in each Treg cluster ranked by log2 fold change were visualized on a heatmap. The gene expression and enrichment score are scaled by transforming the expression or enrichment score in each population to zero mean, and unit SD is shown in the heatmap. (M) Associations of the enrichment of each Treg subpopulation with survival outcomes of patients with NSCLC and melanoma were calculated and visualized on Kaplan-Meier curves. Hazard ratio is calculated by monovariate Cox proportional hazard regression, and the P value is calculated by likelihood ratio test. (N) The enrichment of TNFR+ Tregs visualized in box plots was inferred using Cibersortx on datasets from the TCGA and GTEx. The inferred proportion of TNFR+ Tregs among all cells within each tissue score is shown. A pairwise comparison between each tissue source is calculated by a nonparametric Wilcoxon signed rank test. P values: ****P ≤ 0.0001.
Fig. 5.
Fig. 5.. CRISPR/Cas9-RNP KO reveals that BATF regulates human activated Tregs by multiple signaling pathways.
(A and B) Human primary Tregs isolated from cord blood were CRISPR-edited and then cultured with TCR stimulation for 3 days. (A) Representative flow staining of Tregs showing BATF protein level in nontargeting scrambled control and unperturbed control Tregs. (B) The BATF expression by median fluorescence intensity (MFI) in Tregs (n = 8) is shown. Each dot indicates an individual replicate. Bars indicate the median of expression, and error bars represent 1 SD. (C to G) RNA-seq was conducted on BATF KO activated Tregs (n = 6) and scrambled control from the same donor. (C) PCA of the transcriptome of the scrambled control and BATF KO activated Tregs. Human activated Tregs were stratified by PC1. (D) Weightings of the genes that were the strongest drivers of PC1 were visualized on a bar plot. (E) Selected gene sets that were enriched in human BATF KO activated Tregs were visualized on a dot plot. Genes are differentially expressed in both TNFR+ Tregs from scRNA-seq and BATF KO activated Tregs in bulk RNA-seq selected as input to the gene set enrichment analysis. Dots are colored by the false discovery rate (FDR)–adjusted P value, and dot sizes are scaled by the number of significantly up-regulated genes within each gene set (<0.1% FDR). (F) The relative expression of the top 20 up/down-regulated genes differentially expressed in both TNFR+ Tregs and BATF KO activated Tregs were visualized on a heatmap. The gene expression is scaled by row. (G) Dot plots showing the expression levels of BCL2 and BID in BATF KO activated Tregs and scrambled controls from eight individual replicates. Data in (B) were analyzed by a ratio paired t test, and the FDR P values in (G) were calculated by Wald test. P values: **P < 0.01; ***P < 0.001, ****P < 0.0001. ns, not significant.
Fig. 6.
Fig. 6.. BATF modulates the suppressive function of human activated Tregs.
(A) Tabulation of FOXP3 (top) and CD25 expression (bottom) in BATF KO activated Tregs (n = 7) and scrambled control from the same donor. Data were reported as fold change normalized to marker MFI of nontargeting scrambled control groups. Each dot indicates an individual replicate. Bars indicate the median of expression, and error bars represent 1 SD. (B) In vitro microsuppression assay comparing BATF KO activated Tregs (n = 6) and scrambled control from the same donor are shown. (C) Representative CD8+ T cell proliferation in Fig. 6B at different conditions: no TCR stimulation (gray); 5-day TCR stimulation without coculture with Tregs (yellow); 5-day TCR stimulation with CD8:Treg ratios as 4:1 and 8:1. Cell number at each condition was normalized to the highest cell number in the plot. (D) The expression of ICOS on BATF KO activated Tregs and scrambled control were determined by flow cytometry. The percentage of Tregs expressing ICOS was summarized on a dot plot, and the MFI of ICOS on Tregs was summarized on a bar plot. Data were pooled from five individual replicates. (E) The expression of OX40 on BATF KO activated Tregs and scrambled control were visualized by represented flow cytometry plots from eight individual replicates. The percentage of Tregs expressing OX40 was summarized on a dot plot, and the MFI of OX40 on Tregs (n = 8) was summarized on a bar plot. (F) The expression of 4–1BB on BATF KO Tregs and scrambled control were visualized by represented flow cytometry plots from seven individual replicates. The percentage of Tregs expressing 4–1BB was summarized on a dot plot, and the MFI of 4–1BB in Tregs was summarized on a bar plot. (G to J) The expression of (G) LAG-3, (H) EBI3, (I) IL-10, and (J) NRP1 on BATF KO activated Tregs and scrambled control were visualized by represented flow cytometry plots from five individual replicates. The percentage of Tregs expressing marker genes and the MFI were summarized on a dot plot and a bar plot, respectively. Samples from the same donor were connected by solid lines. Each dot indicates an individual replicate. Bars indicate the median of expression, and error bars represent 1 SD. Data were pooled from five to eight individual replicates. Markers that have fewer replicates than others were subsequently incorporated into the flow panel as the study progressed. Data in (A) and (D) to (J) were analyzed by a ratio paired t test, and data in (B) were analyzed by two-way ANOVA test. P values: ns: P > 0.05; *P ≤ 0.05; **P ≤ 0.01; ***P ≤ 0.001, ****P ≤ 0.0001.
Fig. 7.
Fig. 7.. Human Tregs cultured with continuous TCR stimulation under hypoxia mimic intratumoral BATF-driven TNFR+ Treg phenotypes.
(A) Human primary Tregs isolated from cord blood were cultured in acute TCR stimulation (acute) in normoxia (20% O2), continuous TCR stimulation (continuous) in normoxia, acute stimulation in hypoxia (1.5% O2), and continuous stimulation in hypoxia. Representative flow cytometry plots of five individual replicates showing BATF protein level in Tregs with continuous TCR stimulation under normoxia and hypoxia. (B) A bar plot summarizing the percentage of Tregs expressing BATF identified in Tregs in each culture condition. The percentage of Tregs expressing 4–1BB (C), GITR (D), LAG-3 (E), PD-1 (F), TIM-3 (G), TOX (H), and KI67 (I) identified in TNFR+ Tregs (n = 5) was summarized on a bar plot. Each dot indicates an individual replicate. Bars indicate the median of expression, and error bars represent 1 SD. (J) BATF deletion was conducted by CRISPR RNP KO in human Tregs with continuous TCR stimulation under hypoxia at day 10. Representative flow cytometry plots of four individual replicates showing the proportion of Tregs expressing BATF after 48-hour repeated TCR stimulation. (K) Tabulation of the percentage of Tregs expressing BATF from four individual replicates. (L to N) The percentage of Tregs expressing 4–1BB, GITR, and OX40 was summarized on a dot plot. Samples from the same donor were connected by solid lines, and each dot indicates an individual replicate. Data were pooled from four individual replicates. Data in (B) to (I) were analyzed by a nonparametric Mann-Whitney U test, and data in (K) to (N) were analyzed by a ratio paired t test. P values: ns: P > 0.05; *P < 0.05; **P < 0.01; ***P < 0.001.
Fig. 8.
Fig. 8.. TNFR+ Tregs express BATF-regulated surface markers preferentially in the HNSCC TME.
(A) Relative expression of surface markers differentially expressed on TNFR+ Tregs and percentage of Treg subset in the single-cell HNSCC dataset were visualized on a dot plot. (B) Frequency of CD96, CD39, GITR, CD83, and CD74 expression determined by flow cytometry from control and BATF-null human activated Tregs from cord blood (n = 5). Samples from the same donor were connected by solid lines, and each dot indicates an individual replicate. (C) Matched TILs and PBMCs from patients with HNSCC (n = 6) and HD PBMC (n = 5) were stained for flow cytometry phenotyping. Representative flow plot of BATF expression in TILs and PBMCs from patients with HNSCC and HD PBMCs, normalized to mode scales as a percentage of the maximum count. (D) Tabular summary of percentage of cells expressing BATF from patients with HNSCC (n = 6) and HD PBMCs (n = 5). (E to J) The percentage of Tregs expressing surface markers identified in TNFR+ Tregs from matched TILs and PBMCs from patients with HNSCC (n = 6) and HD PBMCs (n = 5) is summarized on a bar plot. Each dot indicates an individual replicate. Bars indicate the median of expression, and error bars represent 1 SD. The coexpression of BATF expression and marker genes by MFI in HNSCC TIL Tregs was shown in scatterplots. The Pearson correlation coefficient (R) between the expression BATF and marker genes was calculated by the MFI in HNSCC TIL Tregs. The significance of Pearson correlation coefficient (P) was calculated by t test. Data in (B) were analyzed by a ratio paired t test, and data in (D) to (J) were analyzed by a nonparametric Mann-Whitney U test. P values: *P ≤ 0.05; **P ≤ 0.01.

References

    1. Vignali DA, Collison LW, Workman CJ, How regulatory T cells work. Nat. Rev. Immunol. 8, 523–532 (2008). - PMC - PubMed
    1. Bennett CL, Christie J, Ramsdell F, Brunkow ME, Ferguson PJ, Whitesell L, Kelly TE, Saulsbury FT, Chance PF, Ochs HD, The immune dysregulation, polyendocrinopathy, enteropathy, X-linked syndrome (IPEX) is caused by mutations of FOXP3. Nat. Genet. 27, 20–21 (2001). - PubMed
    1. Liu C, Workman CJ, Vignali DAA, Targeting regulatory T cells in tumors. FEBS J. 283, 2731–2748 (2016). - PubMed
    1. Scott EN, Gocher AM, Workman CJ, Vignali DAA, Regulatory T cells: Barriers of immune infiltration into the tumor microenvironment. Front. Immunol. 12, 702726 (2021). - PMC - PubMed
    1. Liu S, Foulkes WD, Leung S, Gao D, Lau S, Kos Z, Nielsen TO, Prognostic significance of FOXP3+ tumor-infiltrating lymphocytes in breast cancer depends on estrogen receptor and human epidermal growth factor receptor-2 expression status and concurrent cytotoxic T-cell infiltration. Breast Cancer Res. 16, 432 (2014). - PMC - PubMed

Publication types

MeSH terms

Substances