. 2023 Oct 27;51(19):10176-10193.
doi: 10.1093/nar/gkad750.

A multi-scale expression and regulation knowledge base for Escherichia coli

Affiliations

A multi-scale expression and regulation knowledge base for Escherichia coli

Cameron R Lamoureux et al. Nucleic Acids Res. .

Abstract

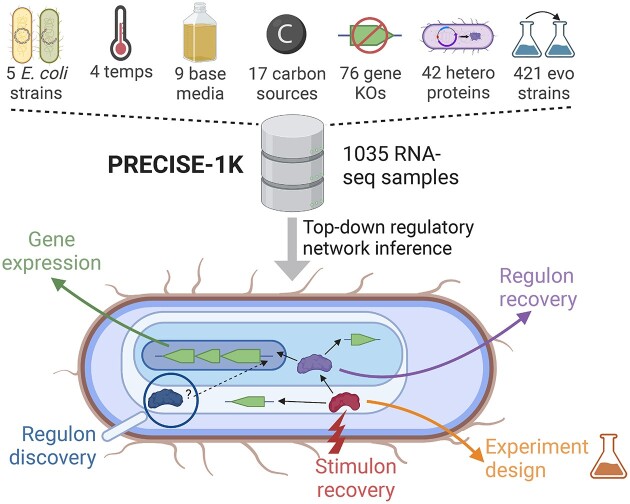
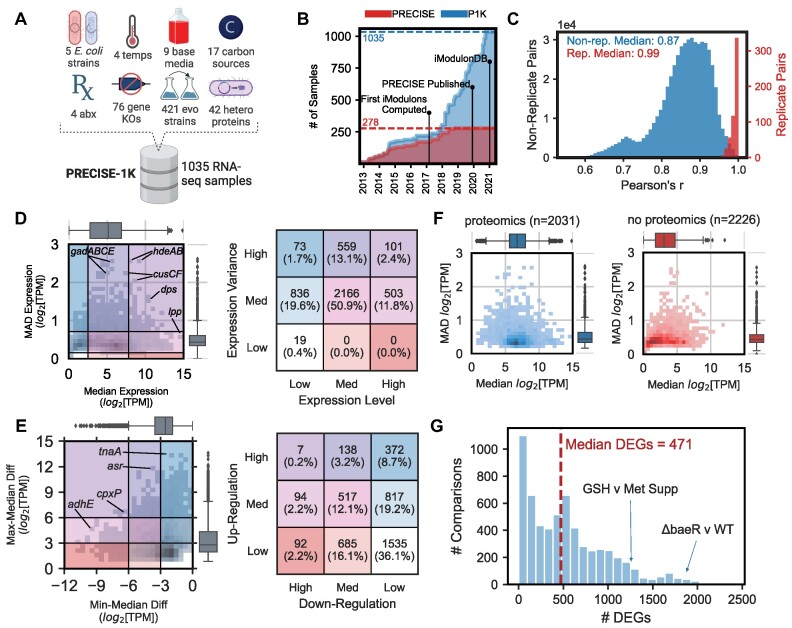
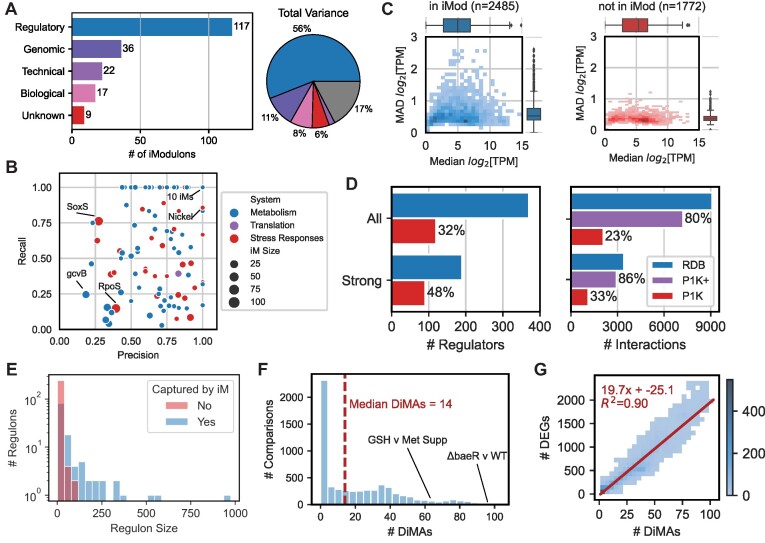
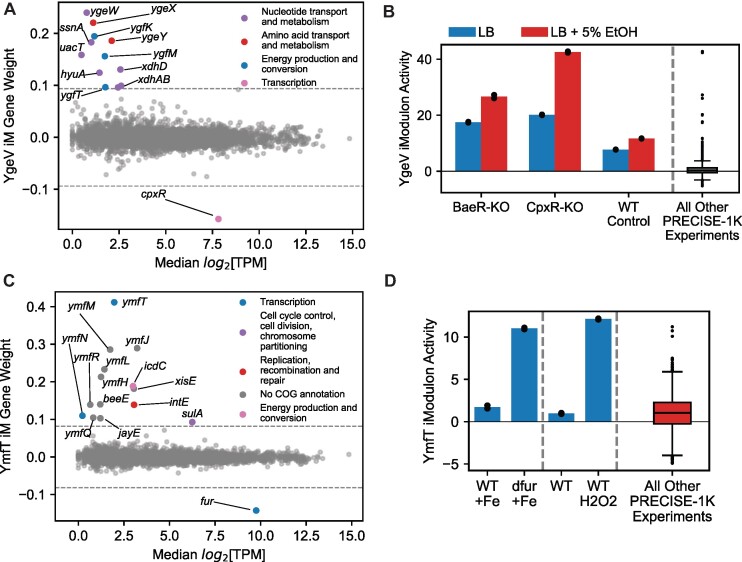
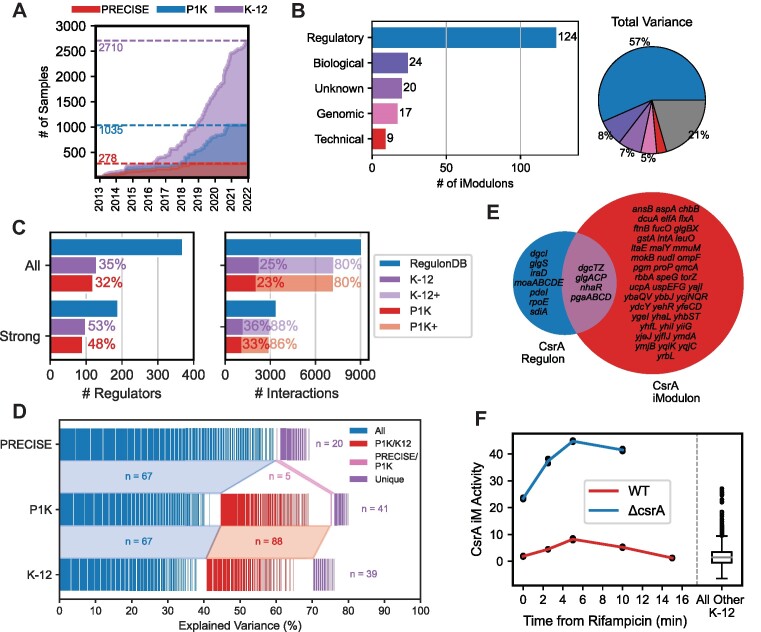
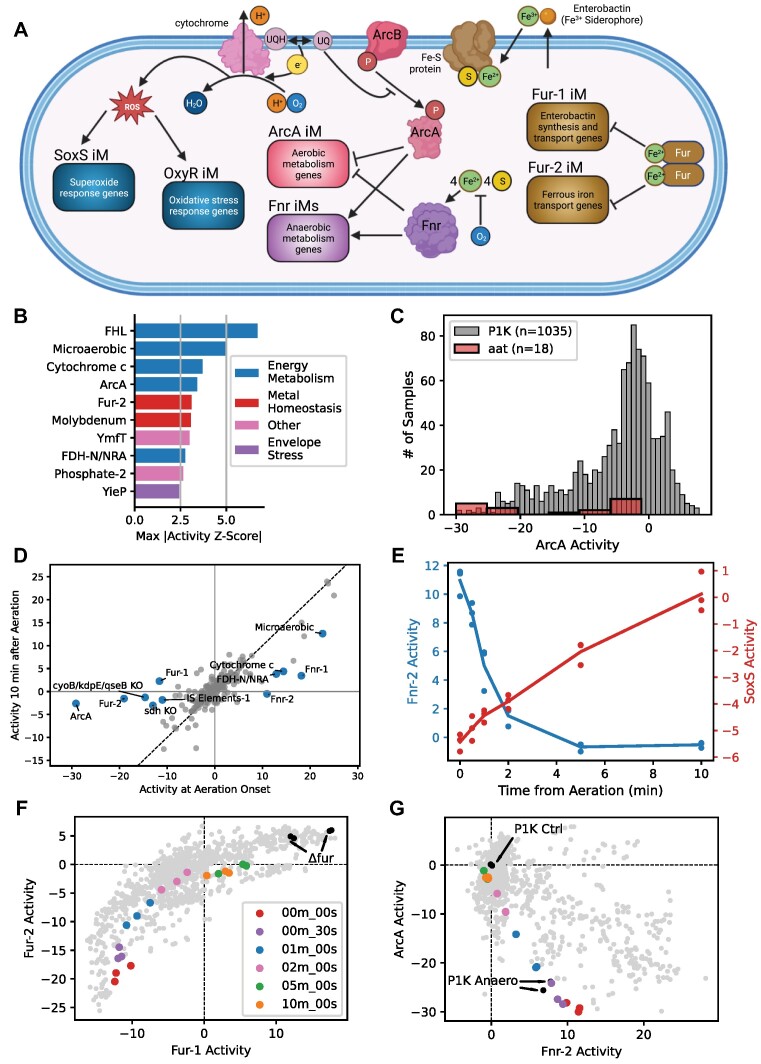
Transcriptomic data is accumulating rapidly; thus, scalable methods for extracting knowledge from this data are critical. Here, we assembled a top-down expression and regulation knowledge base for Escherichia coli. The expression component is a 1035-sample, high-quality RNA-seq compendium consisting of data generated in our lab using a single experimental protocol. The compendium contains diverse growth conditions, including: 9 media; 39 supplements, including antibiotics; 42 heterologous proteins; and 76 gene knockouts. Using this resource, we elucidated global expression patterns. We used machine learning to extract 201 modules that account for 86% of known regulatory interactions, creating the regulatory component. With these modules, we identified two novel regulons and quantified systems-level regulatory responses. We also integrated 1675 curated, publicly-available transcriptomes into the resource. We demonstrated workflows for analyzing new data against this knowledge base via deconstruction of regulation during aerobic transition. This resource illuminates the E. coli transcriptome at scale and provides a blueprint for top-down transcriptomic analysis of non-model organisms.


Figures

Graphical Abstract
Graphical Abstract
Figure 1.
Figure 1.
PRECISE-1K, a 1035-sample high-precision expression compendium, reveals expression trends in the E. coli transcriptome. (A) Overview of construction of PRECISE-1K compendium. Values indicate the number of unique categories for each condition (except evo strains). abx = antibiotics. (B) The growth in single-protocol transcriptomics samples contained in the PRECISE to PRECISE-1K databases. (C) Histogram of Pearson's r for both all replicate pairs and all non-replicate pairs (pairwise combinations of samples across projects that are not direct biological replicates). Samples included in PRECISE-1K are required to have replicate correlations of at least 0.95. (D) 2-D histogram of median expression level against median absolute deviation (MAD) of expression for all 4257 genes in PRECISE-1K. Table defines expression categories as per corresponding box color/location in histogram. For each axis, category splits are defined at median ± 1 standard deviation. (E) 2-D histogram of median-to-min expression difference against median-to-max expression difference for all 4257 genes in PRECISE-1K. Table defines regulatory categories as per corresponding box color/location in histogram. For each axis, low-to-medium split defined at 3 log2[TPM] units (8-fold change from median expression); medium-to-high split defined at 6 log2[TPM] units (32-fold change). (F) Median vs MAD expression 2D histogram, separated by availability of proteomics data in two large recent datasets (46,88). Blue = proteomics data available; red = no proteomics data available. (G) Histogram of the number of differentially expressed genes (DEGs) computed between condition pairs within the same project (n = 6103 pairs). GSH = glutathione, Met = methionine.
Figure 2.
Figure 2.
iModulons extracted from PRECISE-1K capture the transcriptional regulatory network. (A) A breakdown of PRECISE-1K iModulons by their annotation category: ‘Regulatory’ denotes significant enrichment of one or more known regulators; ‘Technical’ includes a single gene or technical artifact iModulon; ‘Genomic’ includes iModulons related to known genomic interventions (i.e. knockouts or segmental amplifications due to adaptive laboratory evolution); and ‘Biological’ includes iModulons containing genes of related function without significant regulator enrichment, or pointing to potential new regulons. Pie chart denotes iModulon annotation categories by percentage of variance explained. Gray wedge indicates variance unexplained by iModulons. (B) Summary of precision and recall for 117 regulatory iModulons. RegulonDB (http://regulondb.ccg.unam.mx) (31) regulons used as reference. (C) 2D histograms of median gene expression and median absolute deviation in gene expression by iModulon membership. (D) Comparison of regulators and regulatory interactions recovered by PRECISE-1K iModulons and available in RegulonDB. All = all evidence levels; Strong = only strong evidence interactions per RegulonDB; P1K+ = all interactions for which the corresponding regulator is captured by an iModulon. (E) Histogram of RegulonDB regulon sizes, colored depending on whether each RegulonDB regulon is or is not captured by at least one PRECISE-1K iModulon. (F) Histogram of the number of differential iModulon activities (DiMAs) computed between condition pairs within the same project (n = 6103; same as Figure 1G). (G) Comparison of number of DEGs and DiMAs for the same condition pairs. Linear best fit curve is shown in red, and indicates a ∼20-fold dimensionality reduction from DEGs to DiMAs. n = 4483 comparisons with non-zero DiMAs.
Figure 3.
Figure 3.
iModulons discover new regulons. (A) iModulon gene weights for the putative YgeV iModulon versus median log2[TPM]. (B) Activity of the YgeV iModulon in different media conditions. Each colored bar is the mean of two biological replicates (shown as individual black points). (C) iModulon gene weights for the putative YmfT iModulon vs. median log2[TPM]. (D) Activity of the YmfT iModulon in different media conditions. Each colored bar is the mean of two biological replicates (shown as individual black points).
Figure 4.
Figure 4.
iModulons stratify existing regulons by mode of binding. (A) Diagram of Class I and Class II CRP promoters. Arrow indicates transcription start site. σ = RNA polymerase (RNAP) sigma factor; σN and σC = sigma factor N- and C-terminal regions; β, β’, ω = RNAP core subunits; Ar1-3 = CRP activating regions (RNAP interaction sites). (B) iModulon phase plane between Crp-1 and Crp-2 iModulons. Colored points from samples involving partial and total CRP deletions. Ar regions correspond to panel A. Glyc = glycerol carbon source; fru = fructose; glc = glucose. (C) Histogram of CRP binding site locations for Crp-1 and Crp-2 iModulons. TSS = transcription start site of transcription unit for each gene. Data from RegulonDB. (D) Simulated binding curve for CRP Class I and Class II promoters. Each point indicates a particular CRP concentration. Binding modeled as 10× tighter at Class II versus Class I promoters.
Figure 5.
Figure 5.
Adding public K-12 data to PRECISE-1K highlights PRECISE-1K’s stability. K-12 is a combined dataset composed of PRECISE-1K (1035 samples) plus all publicly-available high-quality RNA-seq data for E. coli K-12 (1675 samples). (A) The accumulation of high-quality RNA-seq data for K-12 over time. (B) K-12 iModulons by their annotation category (see Figure 2A legend). Pie chart denotes iModulon annotation categories by percentage of variance explained. The 194 annotated iModulons together explain 81% of the variance. Gray wedge indicates variance unexplained by iModulons. (C) Comparison of regulators and regulatory interactions recovered by K-12 and available in RegulonDB. All = all evidence levels; Strong = only strong evidence interactions per RegulonDB; K-12+ = all interactions for which the corresponding regulator is captured by the K-12 Dataset. P1K values from Figure 2D included for comparison. (D) Comparison of iModulons from three RNA-seq datasets: PRECISE(1); PRECISE-1K (this paper); and public K-12. Each small rectangle represents an iModulon for the corresponding dataset. Pairwise Pearson correlations were performed between PRECISE and P1K iModulons, and between P1K and K-12 iModulons; iModulons with correlations over 0.3 were considered to be the same iModulon (median correlation between PRECISE and P1K iModulons is 0.68; between P1K and K-12 is 0.70). Blue = iModulon exists in all three datasets; pink = iModulon only exists in PRECISE/PRECISE-1K; red = iModulon in PRECISE-1K/K-12 only; purple = iModulon unique to dataset. Explained variance is within each dataset (i.e. PRECISE iModulons explain ∼70% of variance in PRECISE, P1K iModulons explain ∼83% of variance in PRECISE-1K, etc.). iModulons are ordered by which dataset(s) they appear in, and sorted in decreasing order of explained variance within each dataset appearance category. (E) Overlap between the CsrA regulon per RegulonDB and the CsrA iModulon. (F) Activity of the CsrA iModulon after arrest of transcription initiation via addition of rifampicin (data from Potts et al (66)).
Figure 6.
Figure 6.
PRECISE-1K and iModulons provide key insight for assessing systems-level transcriptome changes for new data. For all graphs in this figure, the example new data comes from the public K-12 Dataset AAT (67) (anaerobic-aerobic transition) (not in PRECISE-1K, but in public K-12 metadata) which took 6 time-point samples of E. coli from 0 to 10 min after aeration of a previously anaerobic chemostat culture. (A) Schematic highlighting selected iModulons and systems involved in aerobic transition. (B) Top 10 regulatory iModulons by maximum activity difference between within-aat and PRECISE-1K activity (z-scored). For example, z-score of 5 for ‘Microaerobic’ iModulon indicates that the maximum activity of this iModulon amongst aat samples was 5 standard deviations from the mean activity of this iModulon in PRECISE-1K. (C) Histogram of iModulon activity across all PRECISE-1K samples and in new aat project (ArcA as example). (D) Differential iModulon activity (DiMA) plot comparing iModulon activities at aeration onset and 10 min after aeration. iModulons with significant activity differences between the two time points are in blue and labeled (see Methods for DiMA details). (E) iModulon activity by time from aeration for Fnr-2 and SoxS iModulons. (F) Phase plane comparing activities of Fur iModulons for all PRECISE-1K samples (gray) and aat samples (colored). Black dots indicate PRECISE-1K samples with fur knocked out. (G) Phase plane comparing activities of Fnr-2 and ArcA iModulons. aat color scheme same as (F).

Similar articles

Cited by

References

    1. Sastry A.V., Gao Y., Szubin R., Hefner Y., Xu S., Kim D., Choudhary K.S., Yang L., King Z.A., Palsson B.O.. The Escherichia coli transcriptome mostly consists of independently regulated modules. Nat. Commun. 2019; 10:5536. - PMC - PubMed
    1. Ziemann M., Kaspi A., El-Osta A.. Digital expression explorer 2: a repository of uniformly processed RNA sequencing data. Gigascience. 2019; 8:giz022. - PMC - PubMed
    1. Leader D.P., Krause S.A., Pandit A., Davies S.A., Dow J.A.T.. FlyAtlas 2: a new version of the Drosophila melanogaster expression atlas with RNA-seq, miRNA-seq and sex-specific data. Nucleic Acids Res. 2018; 46:D809–D815. - PMC - PubMed
    1. ENCODE Project Consortium An integrated encyclopedia of DNA elements in the human genome. Nature. 2012; 489:57–74. - PMC - PubMed
    1. GTEx Consortium Human genomics. The Genotype-Tissue Expression (GTEx) pilot analysis: multitissue gene regulation in humans. Science. 2015; 348:648–660. - PMC - PubMed

Publication types

MeSH terms

Substances