. 2023 Oct 27;51(19):10681-10699.
doi: 10.1093/nar/gkad742.

TERRA expression is regulated by the telomere-binding proteins POT-1 and POT-2 in Caenorhabditis elegans

Affiliations

TERRA expression is regulated by the telomere-binding proteins POT-1 and POT-2 in Caenorhabditis elegans

Caterina Manzato et al. Nucleic Acids Res. .

Abstract

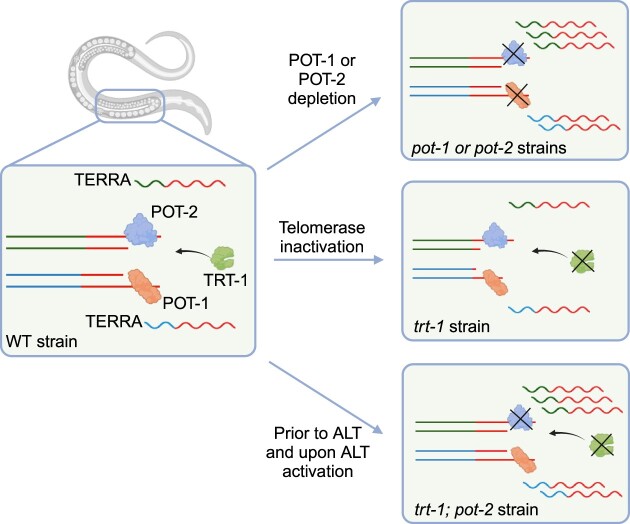
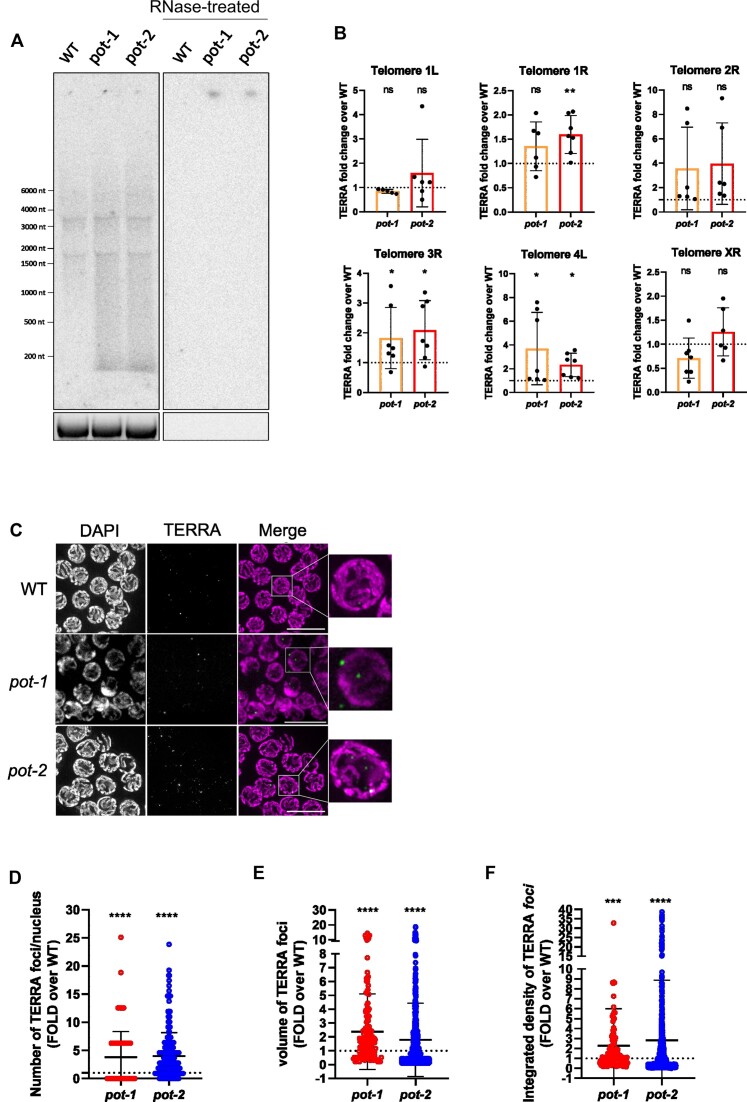
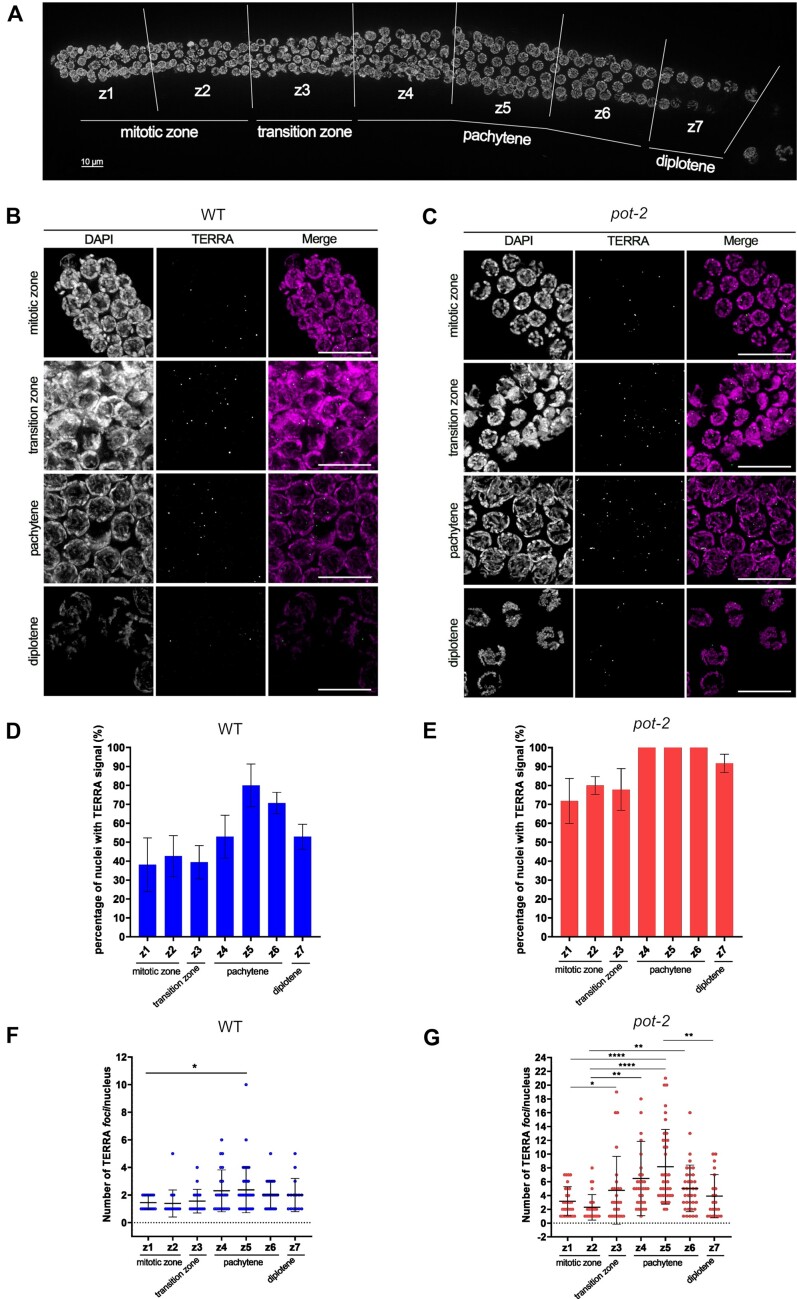
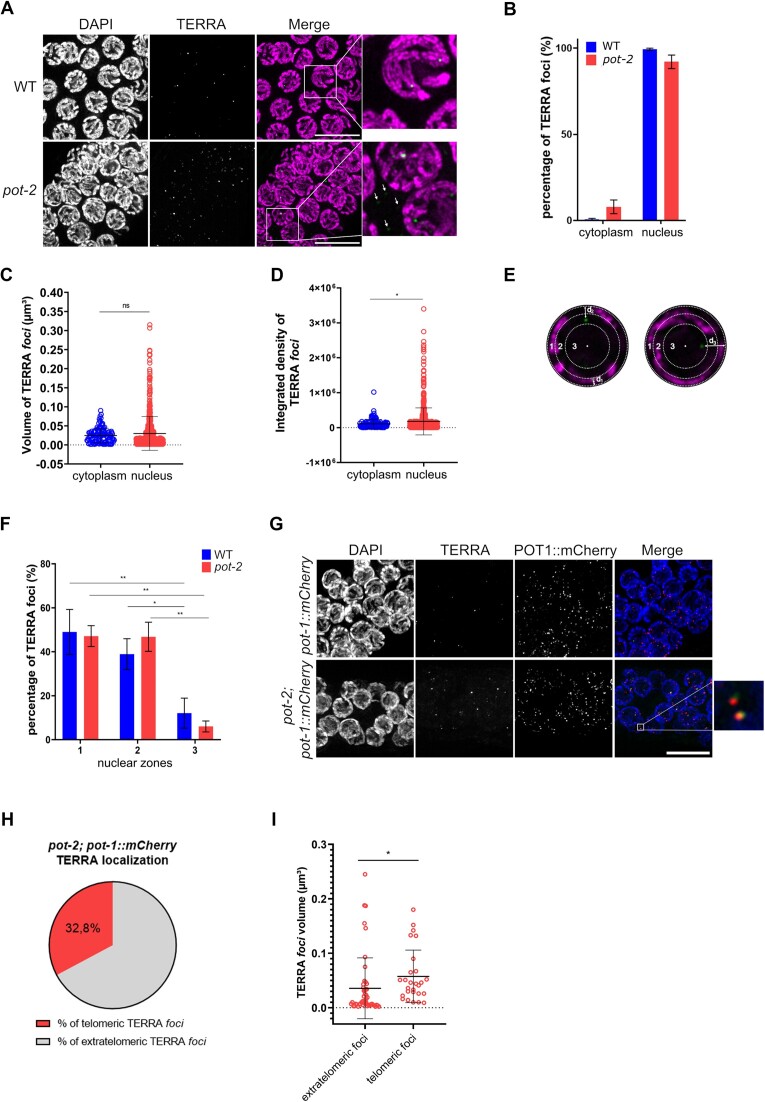
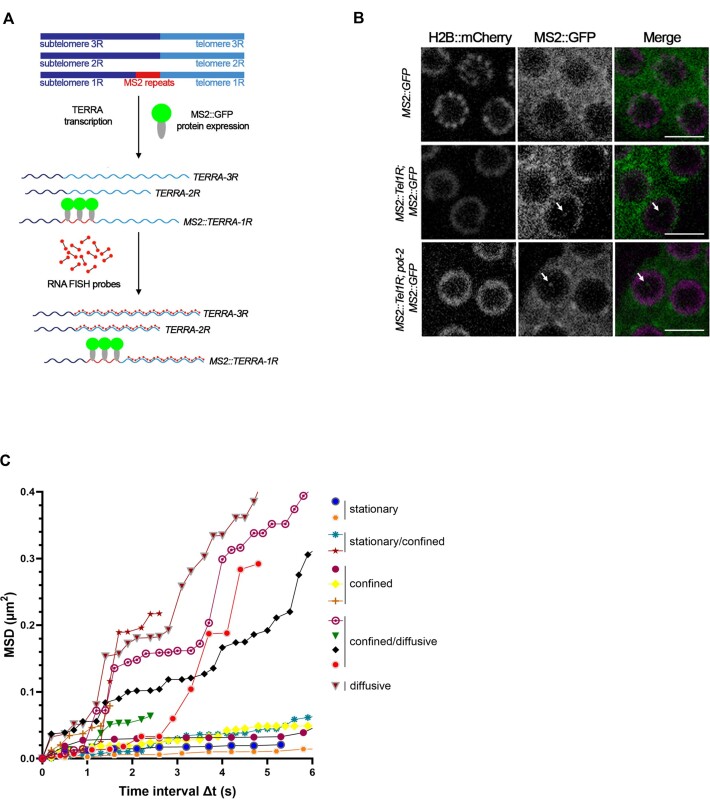
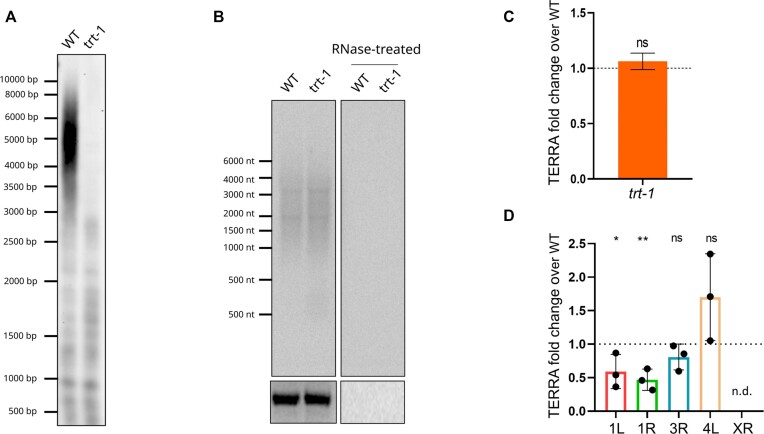
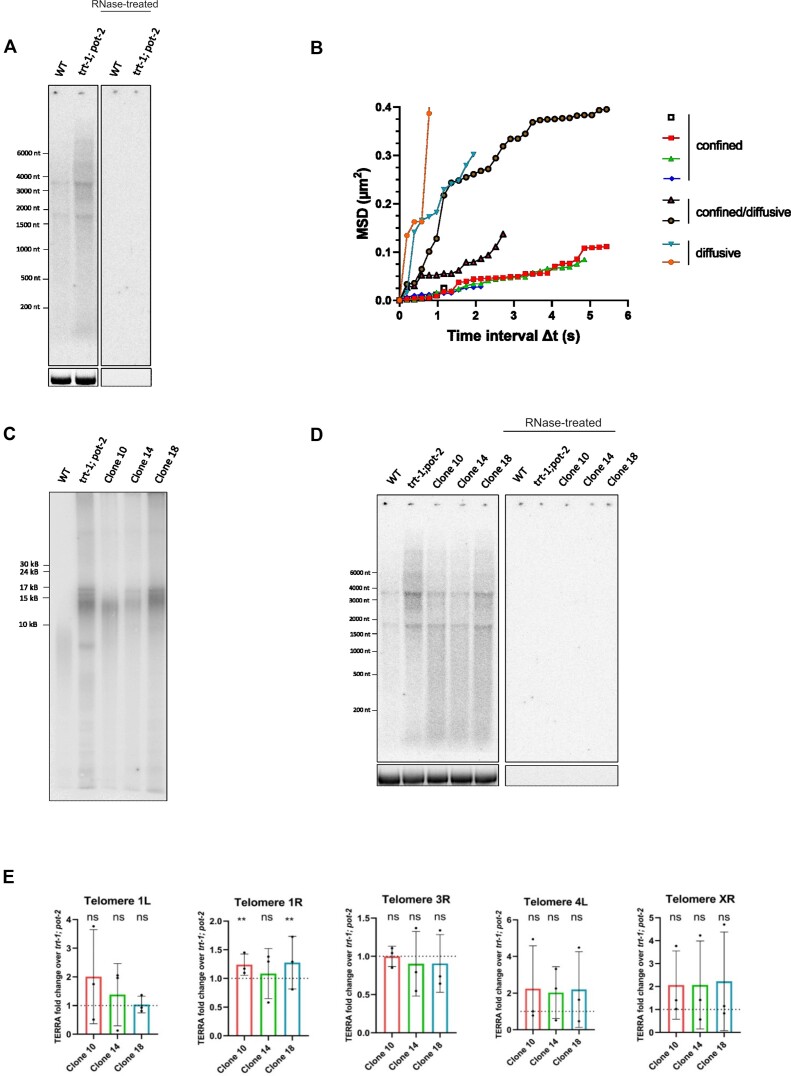
Several aspects of telomere biology are regulated by the telomeric repeat-containing RNA TERRA. While TERRA expression is conserved through evolution, species-specific mechanisms regulate its biogenesis and function. Here we report on the expression of TERRA in Caenorhabditis elegans. We show that C. elegans TERRA is regulated by the telomere-binding proteins POT-1 and POT-2 which repress TERRA in a telomere-specific manner. C. elegans TERRA transcripts are heterogeneous in length and form discrete nuclear foci, as detected by RNA FISH, in both postmitotic and germline cells; a fraction of TERRA foci localizes to telomeres. Interestingly, in germ cells, TERRA is expressed in all stages of meiotic prophase I, and it increases during pachytene, a stage in meiosis when homologous recombination is ongoing. We used the MS2-GFP system to study the spatiotemporal dynamics of single-telomere TERRA molecules. Single particle tracking revealed different types of motilities, suggesting complex dynamics of TERRA transcripts. Finally, we unveiled distinctive features of C. elegans TERRA, which is regulated by telomere shortening in a telomere-specific manner, and it is upregulated in the telomerase-deficient trt-1; pot-2 double mutant prior to activation of the alternative lengthening mechanism ALT. Interestingly, in these worms TERRA displays distinct dynamics with a higher fraction of fast-moving particles.


Figures

Graphical Abstract
Graphical Abstract
Figure 1.
Figure 1.
Detection of TERRA in C. elegans. (A) Northern blot analyses of TERRA from wild type (WT), pot-1 and pot-2 strains. Bottom image shows 18S rRNA band upon gel run. RNase A-treated samples were loaded as control for the specificity of the signal. This experiment was repeated five times obtaining similar results. (B) RT-qPCR analyses of TERRA expression from the indicated telomeres. Values shown represent 2–ΔCt absolute values. Data is shown as fold change over the WT strain and represents mean ± SD from at least six independent biological replicates. Blank and minus reverse transcriptase controls did not produce measurable Ct values. Unpaired t-test was used to assess the statistical significance. P-values = *: <0.05, **: <0.01, ns: not significant. (C) Detection of TERRA by RNA FISH analyses in germline cells of WT, pot-1 and pot-2 organisms. Nuclei were stained by DAPI. A maximal projection of a z-stack experiment is shown. Scale bar: 10 μm. (D–F) Quantification of the TERRA foci number (D), volumes (E) and integrated density (F) per nucleus detected by RNA FISH in germline cells of WT, pot-1 and pot-2 organisms. Data is shown as fold over WT and represents mean ± SD from two independent experiments. Two separate analyses were performed for pot-2 versus WT and pot-1 versus WT. A total of four gonads for pot-2 and its WT control were analyzed in two experiments, accounting for a total of 241 and 305 nuclei analyzed for pot-2 and its WT, respectively; while a total of four gonads for pot-1 and three gonads for its WT control were analyzed in two additional experiments, accounting for 368 nuclei for pot-1 and 725 nuclei for its WT, respectively. Unpaired t-test with Welch's correction was used to assess the statistical significance. P-values = ***: ≤0.001, ****: ≤0.0001.
Figure 2.
Figure 2.
TERRA expression increases in pachytene cells during meiotic prophase I. (A) Low magnification image of a wild type gonad stained with DAPI depicting the seven zones of the meiotic prophase I. (B, C) Detection of TERRA by RNA FISH in the indicated meiotic zones of the germline of WT (B) and pot-2 (C) organisms. Nuclei were stained by DAPI. Scale bar: 10 μm. (D, E) Quantification of the number of nuclei positive to TERRA signal in the different meiotic zones of WT (D) and pot-2 (E) organisms. Data is shown as percentage of TERRA-positive nuclei and represent mean ± SD from two independent experiments. At least 240 nuclei were assessed in each experiment for each strain. Brown-Forsythe ANOVA test and the Games-Howell's multiple comparison test indicated no significant differences between zones for both strains. (F, G) Quantification of the number of TERRA foci per nucleus detected by RNA FISH in the indicated meiotic zones of the germline from WT (F) and pot-2 (G) organisms. Data shown represents mean ± SD from two independent experiments. 240 nuclei were assessed in each experiment for each strain. Statistical analyses were performed using One-way Brown-Forsythe ANOVA test with column factor (difference between zones 1–7). P-values = **: ≤0.01 (F), P = ****: ≤0.0001 (G). Game-Howell's multiple comparison test (difference between single zones). P-values = *: ≤0.05, **: ≤0.01, ***: ≤0.001, ****: ≤0.0001
Figure 3.
Figure 3.
TERRA transcripts are mainly nuclear and localize at telomeres. (A) Detection of TERRA by RNA FISH analyses of pachytene germ cells of WT and pot-2 organisms. Inset of the WT strain image shows representative nuclear TERRA foci. Inset of the pot-2 strain image shows nuclear and cytoplasmic TERRA foci, the latter are indicated by white arrows. Nuclei were stained by DAPI. Scale bar: 5 μm. (B) Quantification of the TERRA foci detected in the nucleus or the cytoplasm in mid-pachytene cells of wild type and pot-2 organisms. Data is shown as percentage of foci and represent mean ± SD from two independent experiments. Four gonads per genotype were analyzed, accounting for a total 131 nuclei for pot-2 and 139 nuclei for wild type. (C, D) Quantification of nuclear and cytoplasmic TERRA foci volumes (C) and integrated density (D) in germline cells of pot-2 organisms. Data shown represents mean ± SD from two independent experiments, as in (B). Unpaired t-test with Welch's correction was used to assess the statistical significance. P-value = *: ≤0.05. (E) Representative images of nuclei showing TERRA foci localizing in the three nuclear concentric zones, as assessed by calculation of the distance of the center of each focus to the nuclear edge (d). A single plane of a 3D analysis is displayed in each image. (F) Quantification of the TERRA foci detected in each of the three nuclear zones in mid-pachytene germ cells of WT and pot-2 organisms. Data is shown as percentage of foci and represent mean ± SD from two independent experiments. At least 9 nuclei were assessed for each strain in each experiment. Two-way ANOVA with Tukey's multiple comparison test was used for statistical analyses. Column factor (difference between zones 1, 2 and 3) p-value= ***: ≤0.001. Multiple comparison tests P-value = *: ≤0.05, **: ≤0.01. (G) Detection of TERRA by RNA FISH and telomeres by IF for POT1-mCherry in mid-pachytene germ cells of pot-1::mCherry and pot-2; pot-1:mCherry strains. Nuclei were stained by DAPI. Scale bar: 10 μm. Insets show telomeric TERRA foci defined as TERRA foci colocalizing with POT-1::mCherry foci. (H) Quantification of the number of telomeric or extratelomeric TERRA foci, as detected by RNA FISH/IF, shown as percentage of the total number of TERRA foci detected in mid-pachytene germ cells of pot-2; pot-1::mCherry strain. A total number of 82 TERRA foci were analyzed from 5 different gonads in two independent experiments. (I) Quantification of the volumes of extratelomeric and telomeric TERRA foci in mid-pachytene germ cells of the pot-2 mutant organisms. Data represents mean ± SD from two independent experiments. At least 12 nuclei were assessed in each experiment. Unpaired t-test was used to assess the statistical significance. P-value = *: ≤0.05.
Figure 4.
Figure 4.
Visualization of the dynamics of single-telomere TERRA molecules in living organisms. (A) Schematic depiction of three C. elegans chromosome ends with MS2 sequences (red) integrated at subtelomere 1R, resulting in the expression of endogenous subtelomere 1R TERRA transcripts tagged with three MS2 stem loops (MS2::TERRA-1R). MS2::TERRA-1R transcripts are bound by GFP-fused MS2 coat proteins (MS2::GFP) enabling the visualization of single-telomere TERRA molecules in living cells. The use of TERRA RNA FISH probes (dumbbells with red edges) allows the visualization of TERRA molecules expressed from all telomeres in fixed cells. Only three telomeres are shown for simplicity. (B) Live imaging of germline cells shows TERRA-MS2-GFP foci (indicated by white arrows) in MS2::Tel1R; MS2::GFP and MS2::Tel1R; pot-2; MS2::GFP strains, but not in the MS2::GFP control strain. Imaging of the H2B::mCherry signal enabled the visualization of the nuclei. Scale bar: 5 μm. (C) Mean-square displacement (MSD) of tracked TERRA-MS2-GFP particles versus time. The tracking of 12 TERRA MS2-GFP particles in live MS2::Tel1R; pot-2; MS2::GFP organisms from three independent experiments is shown. Imaging was performed in streaming using a spinning disc microscope.
Figure 5.
Figure 5.
TERRA expression is regulated by telomere shortening in a telomere-specific manner. (A) Telomere restriction fragment analysis by Southern blotting of HinfI-digested genomic DNA extracted from WT and trt-1 strain at F14. (B) Northern blot analysis of TERRA from WT and trt-1 (F14) strains. Bottom image shows 18S rRNA band upon gel run. The experiment was repeated three independent times obtaining similar results. (C) Quantification of northern blots analyses of TERRA from WT and trt-1 strains. N = 3. (D) RT-qPCR analyses of TERRA expression from the indicated telomeres in trt-1 mutant strain (F14). Data is shown as fold change over the WT strain and represents mean and SD from three independent experiments. Two-way ANOVA with Tukey's multiple comparison test was used for statistical analyses. Column factor P-value = ***: ≤0.001. Multiple comparison tests P-value = *: ≤0.05, **: ≤0.01. n.d. = not detectable.
Figure 6.
Figure 6.
TERRA levels and spatiotemporal dynamics are altered in trt-1; pot-2 double mutant. ALT-like strains maintain upregulated TERRA expression compared to WT. (A) Northern blot analysis of TERRA from WT and trt-1; pot-2 double mutant (F16). Bottom image shows 18S rRNA band upon gel run. The experiment was performed four times obtaining similar results. (B) Mean-square displacement (MSD) of tracked TERRA-MS2-GFP particles versus time. The tracking of 8 TERRA MS2-GFP particles in live MS2::Tel1R; trt-1; pot-2; MS2::GFP organisms from four independent experiments is shown. Imaging was performed in streaming using a spinning disc microscope. (C) Telomere restriction fragment analysis by pulsed-field gel electrophoresis (PFGE) coupled with Southern blotting of HinfI-digested genomic DNA extracted from WT, trt-1; pot-2 (F10), and three independent trt-1; pot-2 ALT lines, clone 10, clone 14 and clone 18 (F90). The experiment was repeated three independent times obtaining similar results. (D) Northern blot analysis of TERRA from WT, trt-1; pot-2 double mutant (F16) and three independent trt-1; pot-2 ALT lines, clone 10, clone 14 and clone 18 (F90). Bottom image shows 18S rRNA band upon gel run. The experiment was repeated three independent times obtaining similar results. (E) RT-qPCR analyses of TERRA from the indicated telomeres in trt-1; pot-2 (F10), and three trt-1; pot-2 ALT-like clones (F90). Data is shown as fold change over the trt-1; pot-2 strain and represents mean and SD from three independent experiments. Two-way ANOVA with Tukey's multiple comparison test was used for statistical analyses. Column factor (difference between ALT-like clones) p-value = ns: not significant. Multiple comparison tests showed significant difference for telomere 1R TERRA expression between clones 10 and 18, compared to the trt-1; pot-2 parental line. P-value = **: ≤0.01.

Similar articles

Cited by

References

    1. Maciejowski J., de Lange T.. Telomeres in cancer: tumour suppression and genome instability. Nat. Rev. Mol. Cell Biol. 2017; 18:175–186. - PMC - PubMed
    1. Jain D., Cooper J.P.. Telomeric strategies: means to an end. Annu. Rev. Genet. 2010; 44:243–269. - PubMed
    1. McElligott R., Wellinger R.J.. The terminal DNA structure of mammalian chromosomes. EMBO J. 1997; 16:3705–3714. - PMC - PubMed
    1. de Lange T. Shelterin-mediated telomere protection. Annu. Rev. Genet. 2018; 52:223–247. - PubMed
    1. Sfeir A., de Lange T.. Removal of shelterin reveals the telomere end-protection problem. Science. 2012; 336:593–597. - PMC - PubMed

Publication types

MeSH terms