

To identify biomarkers associated with the transfer of diabetes combined with cancer in human genes using bioinformatics analysis
- PMID: 37713834
- PMCID: PMC10508432
- DOI: 10.1097/MD.0000000000035080
To identify biomarkers associated with the transfer of diabetes combined with cancer in human genes using bioinformatics analysis
Abstract
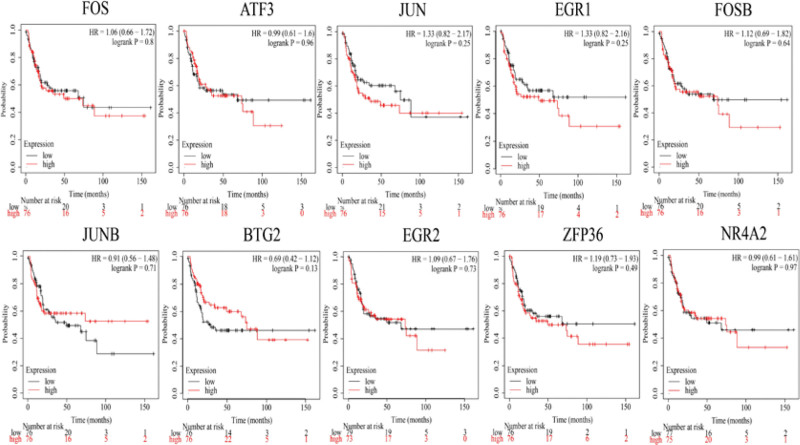
Currently, the incidence of diabetes mellitus is increasing rapidly, particularly in China, and its pathogenesis is still unclear. The goal of this study was to find meaningful biomarkers of metastasis in patients with diabetes and cancer using bioinformatic analysis in order to predict gene expression and prognostic importance for survival. We used the Differentially Expressed Gene, Database for Annotation Visualization and Integrated Discovery, and Gene Set Enrichment Analyses databases, as well as several bioinformatics tools, to explore the key genes in diabetes. Based on the above database, we ended up with 10 hub genes (FOS, ATF3, JUN, EGR1, FOSB, JUNB, BTG2, EGR2, ZFP36, and NR4A2). A discussion of the 10 critical genes, with extensive literature mentioned to validate the association between the 10 key genes and patients with diabetes and cancer, to demonstrate the importance of gene expression and survival prognosis. This study identifies several biomarkers associated with diabetes and cancer development and metastasis that may provide novel therapeutic targets for diabetes combined with cancer patients.
Copyright © 2023 the Author(s). Published by Wolters Kluwer Health, Inc.
Conflict of interest statement
The authors have no conflicts of interest to disclose.
Figures


Similar articles
-
Screening and Identification of Hub Genes in the Development of Early Diabetic Kidney Disease Based on Weighted Gene Co-Expression Network Analysis.Front Endocrinol (Lausanne). 2022 Jun 3;13:883658. doi: 10.3389/fendo.2022.883658. eCollection 2022. Front Endocrinol (Lausanne). 2022. PMID: 35721731 Free PMC article.
-
The initial expression alterations occurring to transcription factors during the formation of breast cancer: Evidence from bioinformatics.Cancer Med. 2022 Mar;11(5):1371-1395. doi: 10.1002/cam4.4545. Epub 2022 Jan 17. Cancer Med. 2022. PMID: 35037412 Free PMC article.
-
Identification of differentially expressed genes and signaling pathways with Candida infection by bioinformatics analysis.Eur J Med Res. 2022 Mar 21;27(1):43. doi: 10.1186/s40001-022-00651-w. Eur J Med Res. 2022. PMID: 35314002 Free PMC article.
-
Identification of key hub genes in knee osteoarthritis through integrated bioinformatics analysis.Sci Rep. 2024 Sep 28;14(1):22437. doi: 10.1038/s41598-024-73188-z. Sci Rep. 2024. PMID: 39341952 Free PMC article.
-
Common gene signatures and key pathways in hypopharyngeal and esophageal squamous cell carcinoma: Evidence from bioinformatic analysis.Medicine (Baltimore). 2020 Oct 16;99(42):e22434. doi: 10.1097/MD.0000000000022434. Medicine (Baltimore). 2020. PMID: 33080677 Free PMC article.
References
-
- Zhang LW, Ruan MH, Liu JL, et al. . Progress on research and development in diabetes mellitus. Yi Chuan. 2022;44:824–39. - PubMed
-
- Writing Committee of the Report on Cardiovascular Health and Diseases in China. Report on Cardiovascular Health and Diseases in China 2021: an updated summary. Biomed Environ Sci. 2022;35:573–603. - PubMed
MeSH terms
Substances
Grants and funding
LinkOut - more resources
Full Text Sources
Medical
Miscellaneous
