. 2023 Sep 14;186(19):4216-4234.e33.
doi: 10.1016/j.cell.2023.08.013.

Modular pooled discovery of synthetic knockin sequences to program durable cell therapies

Affiliations

Modular pooled discovery of synthetic knockin sequences to program durable cell therapies

Franziska Blaeschke et al. Cell. .

Abstract

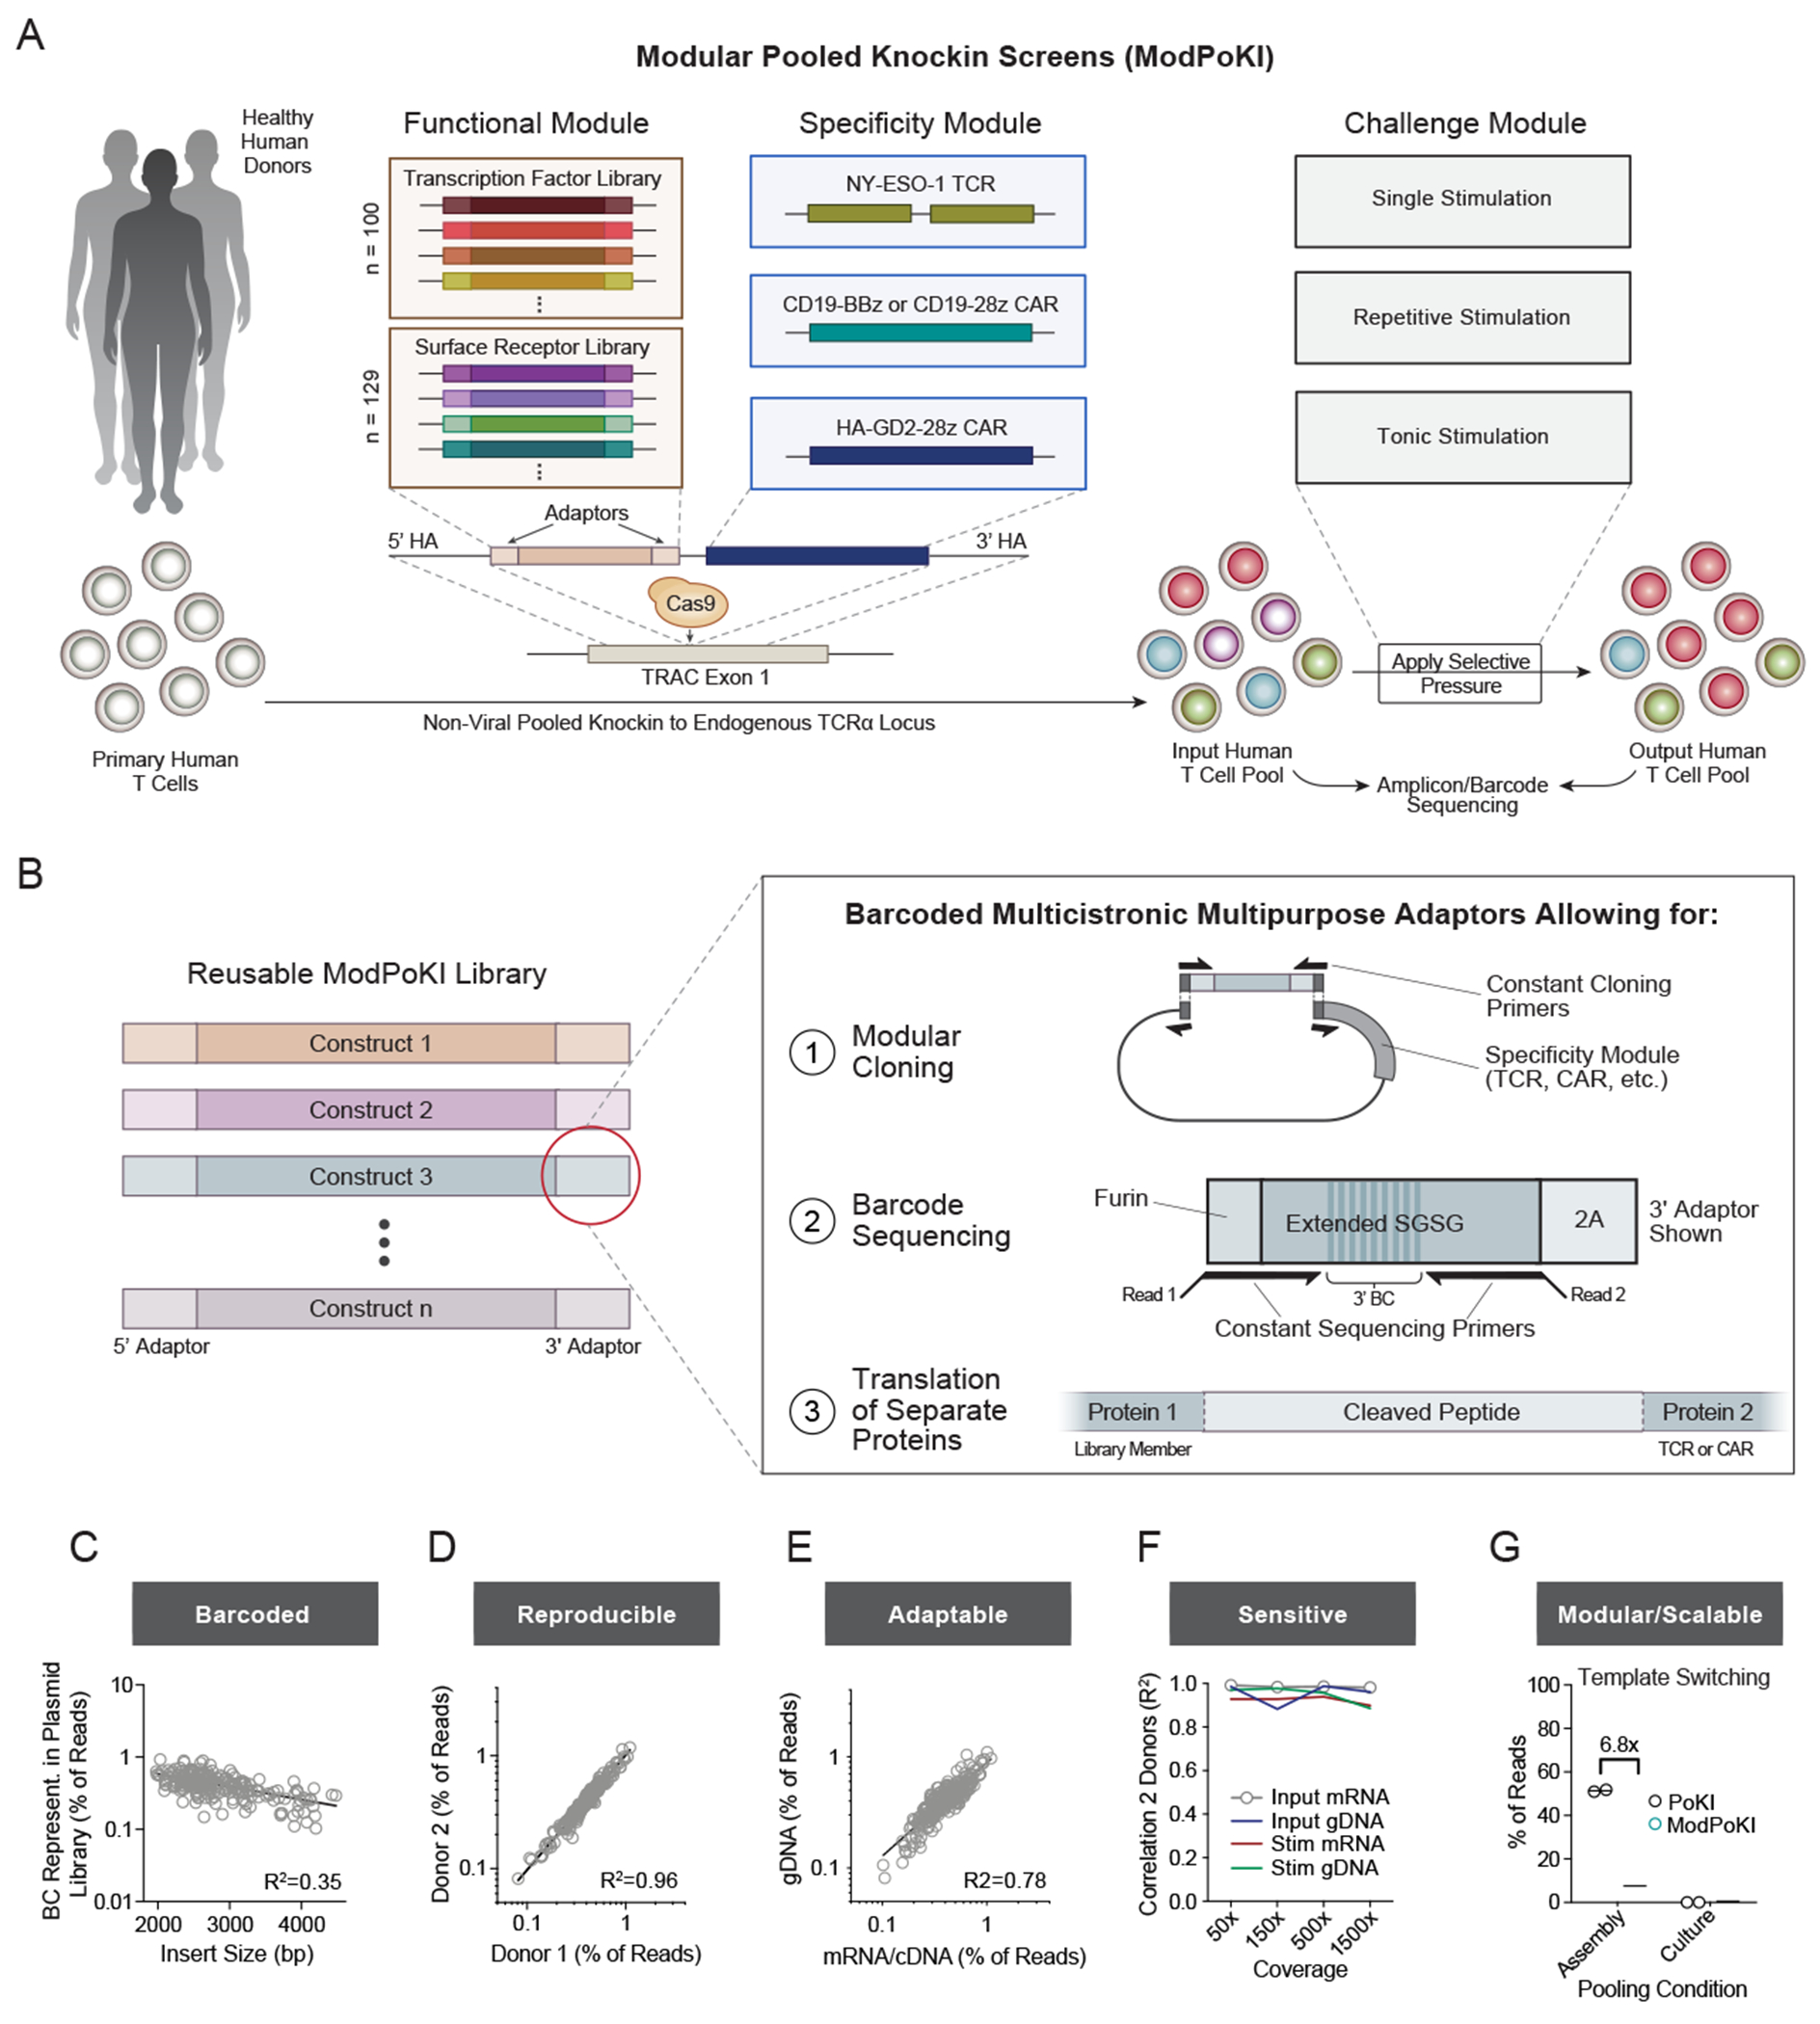
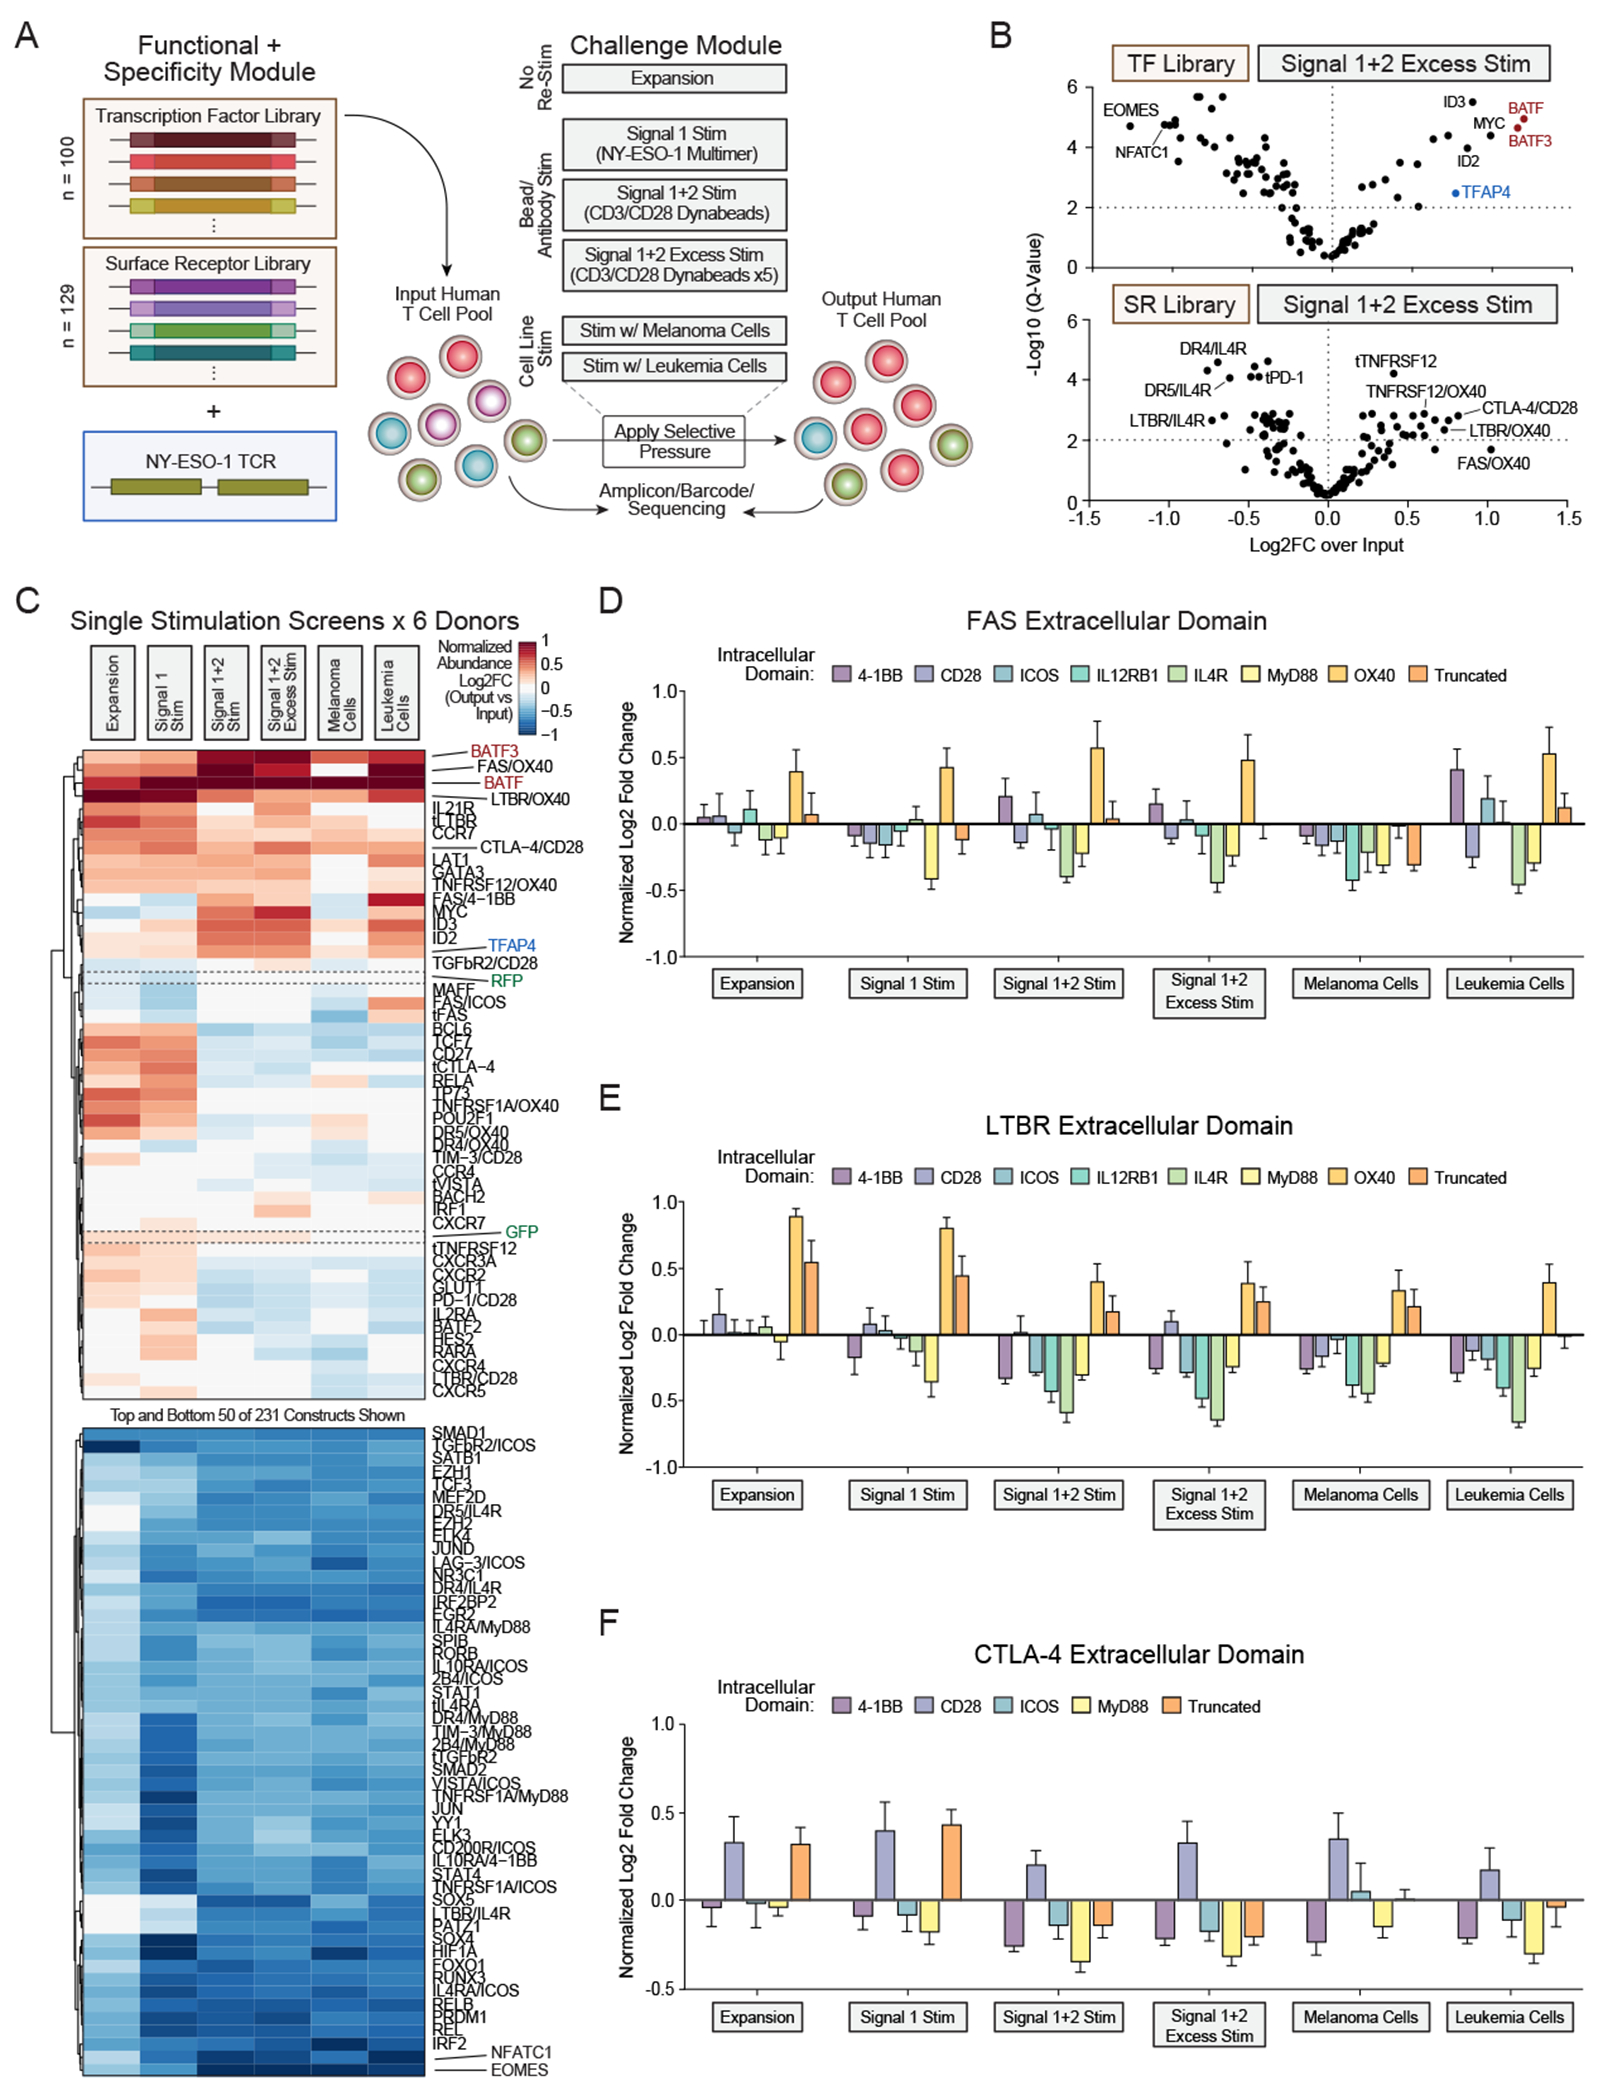
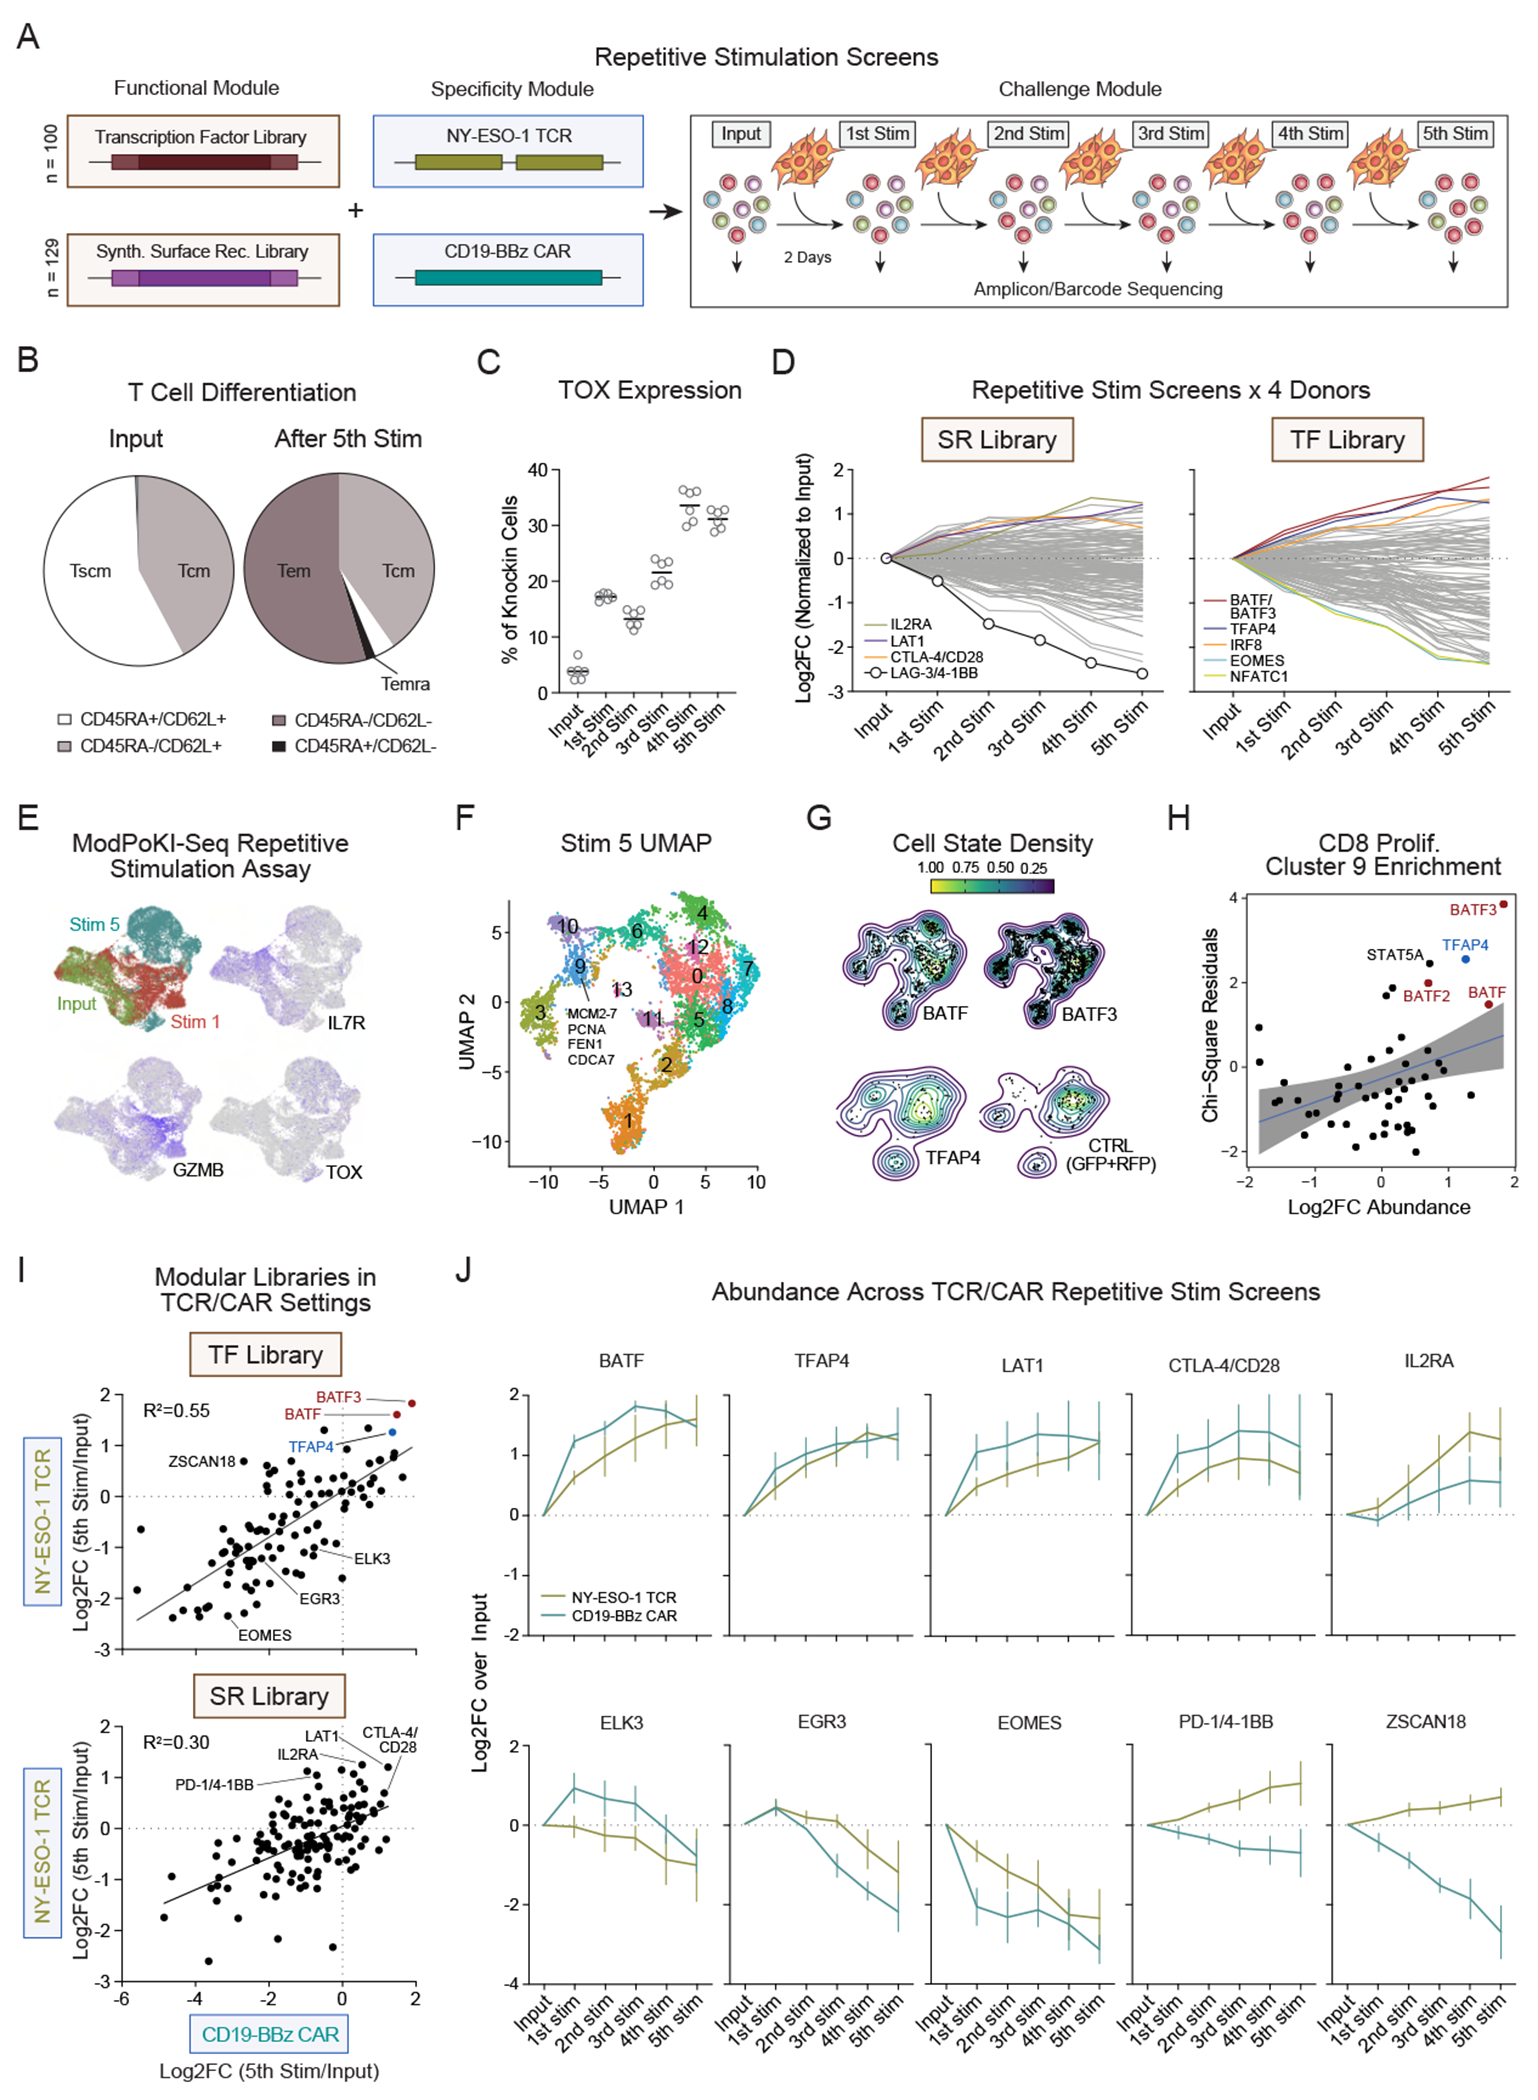
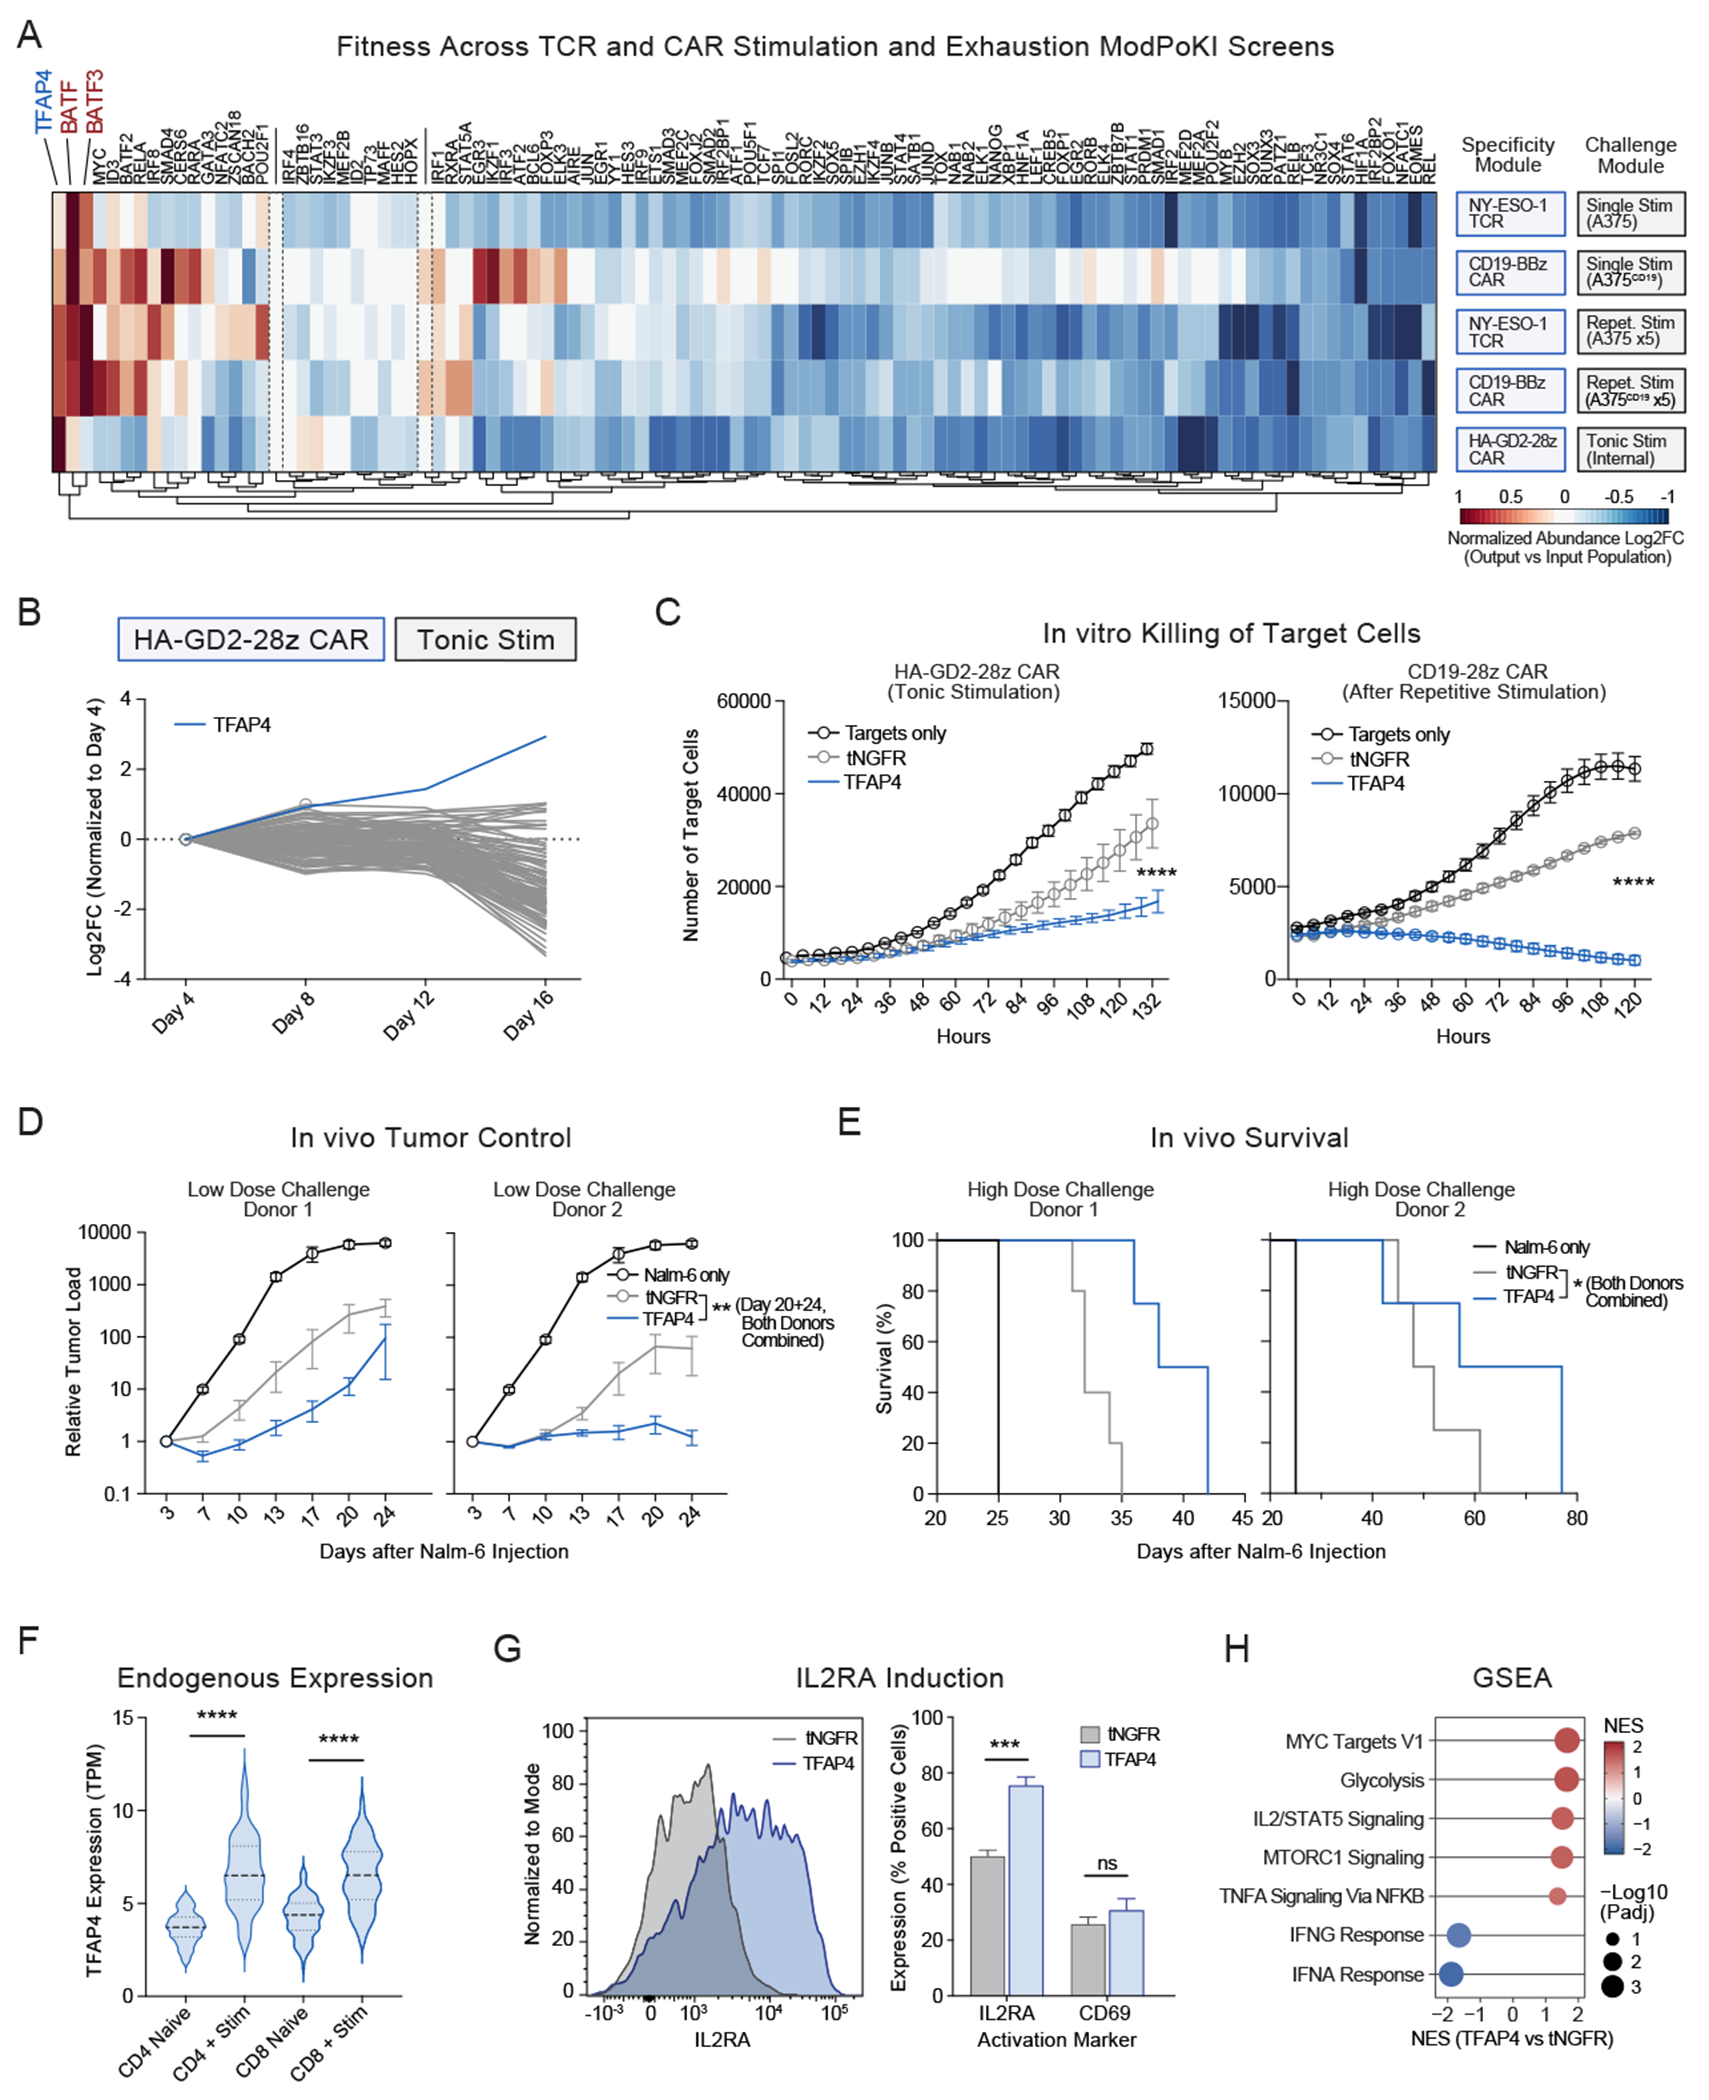
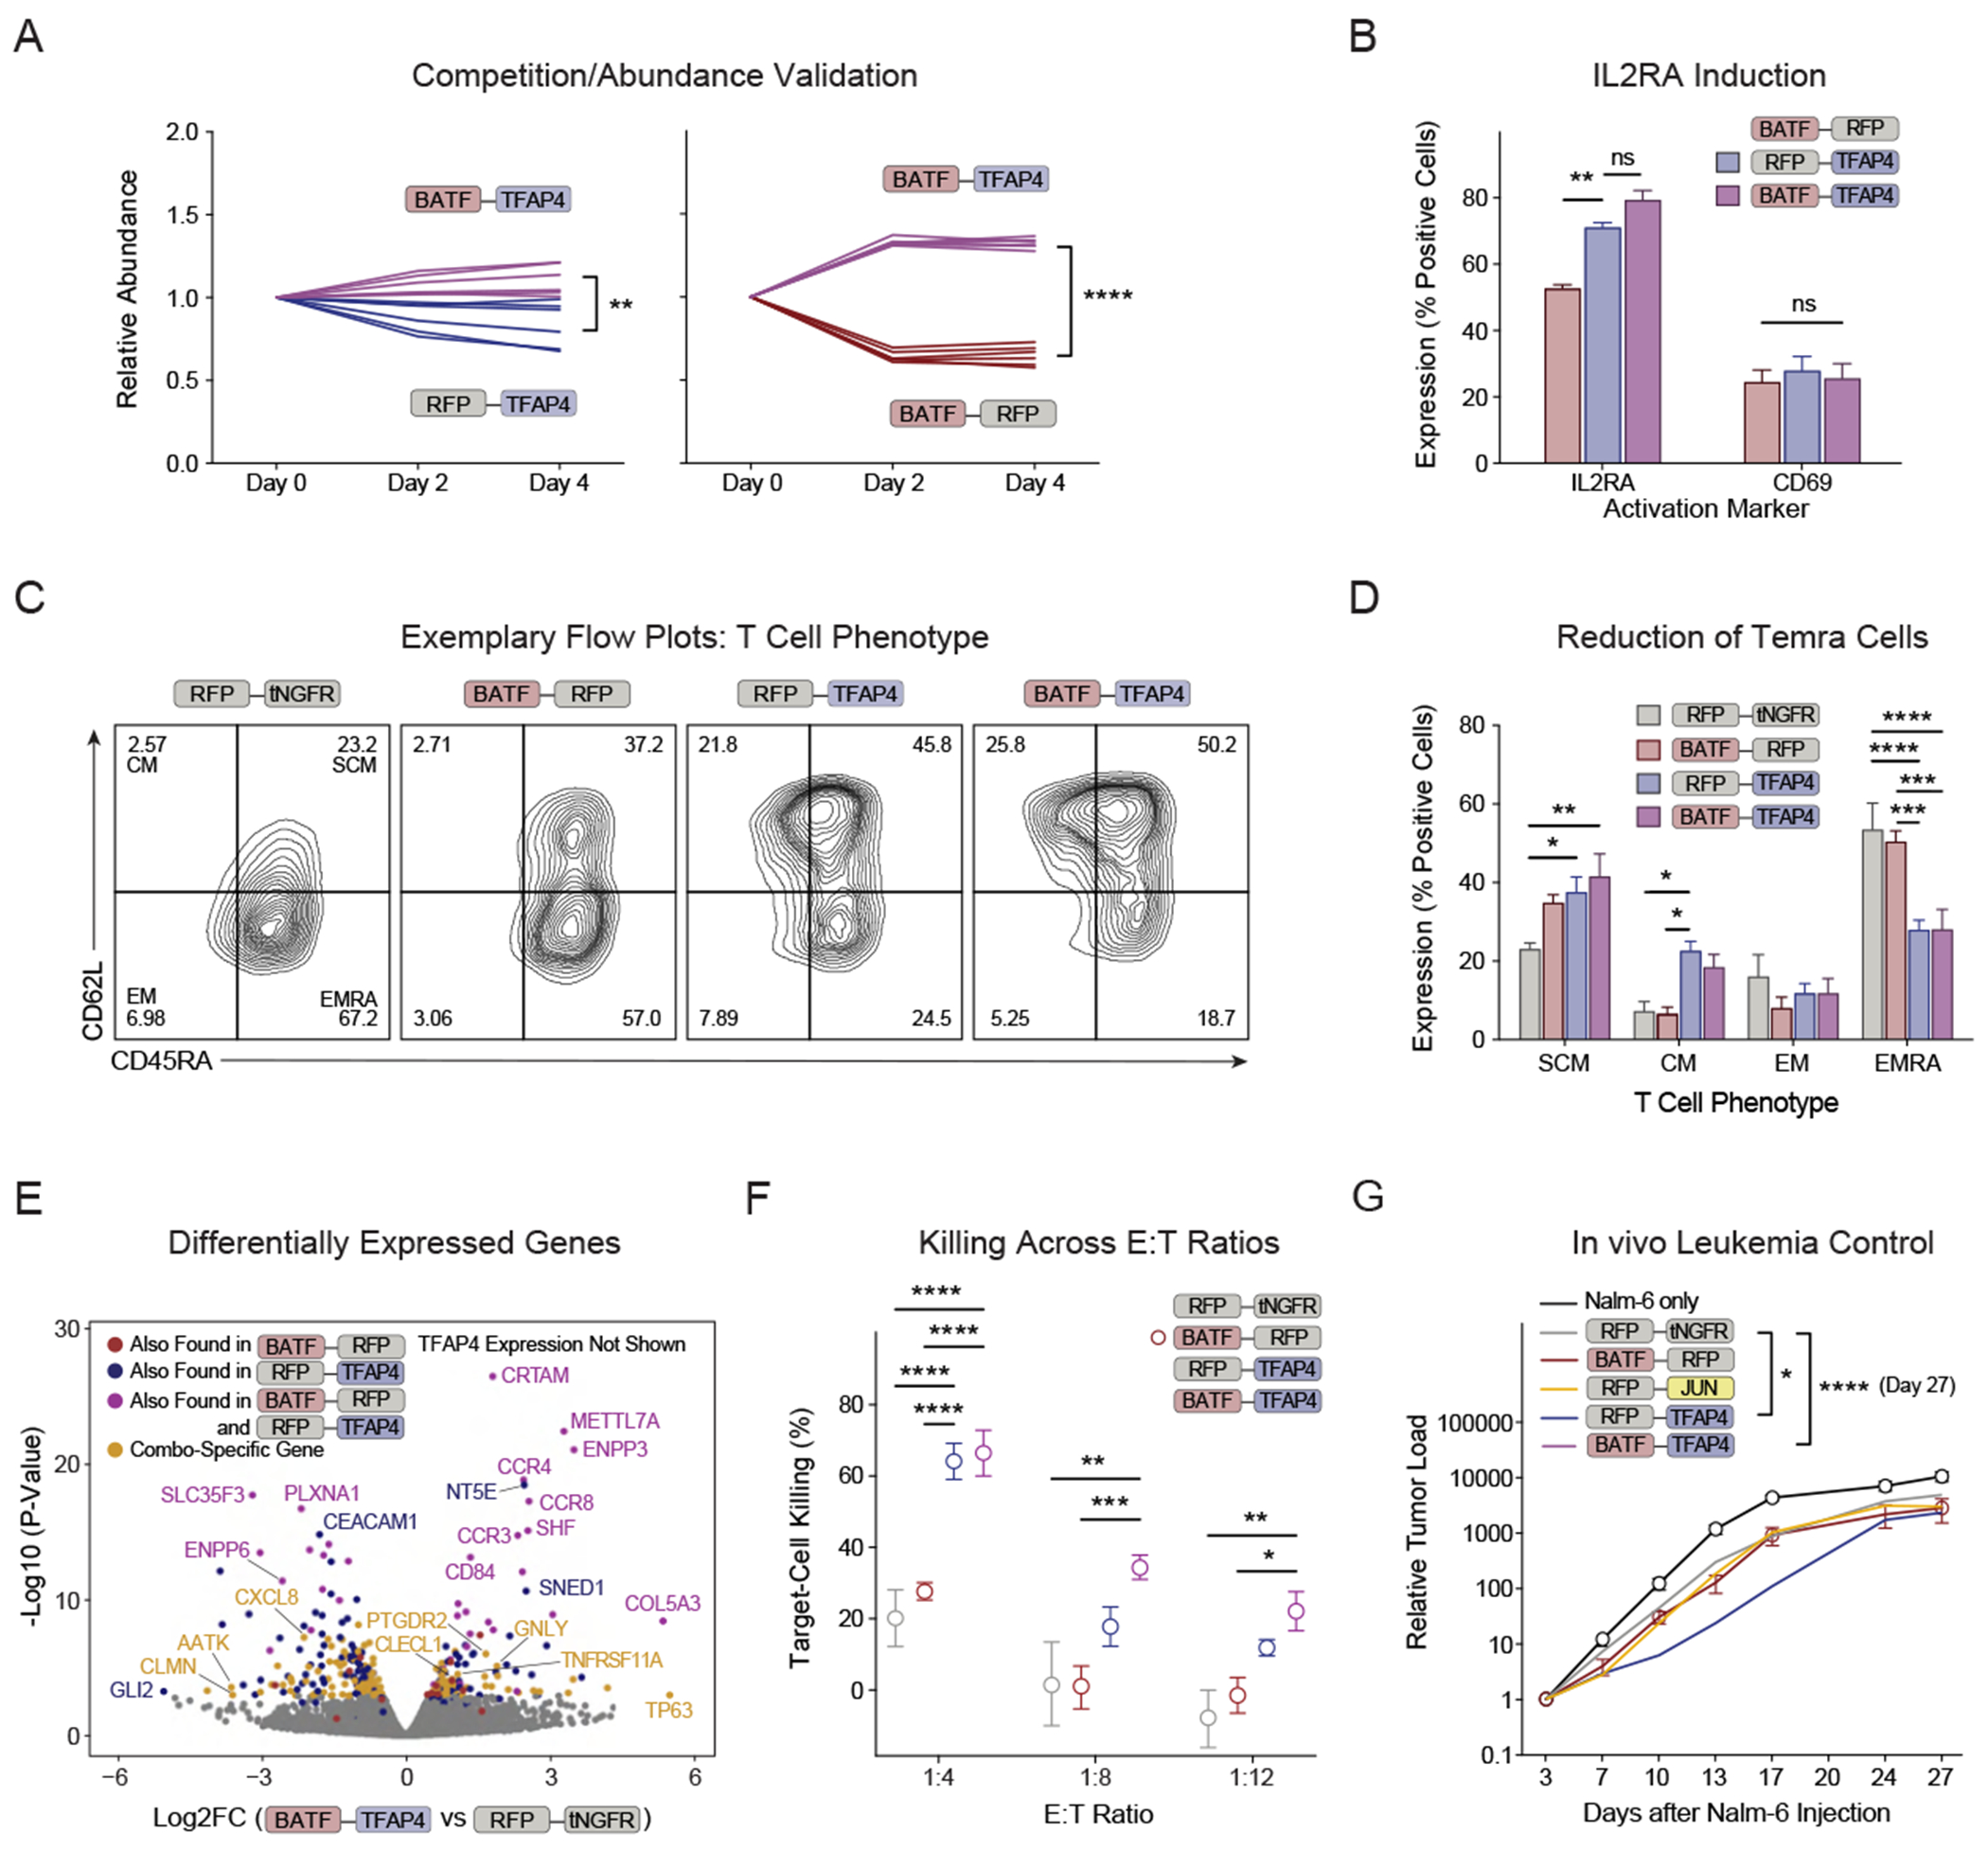
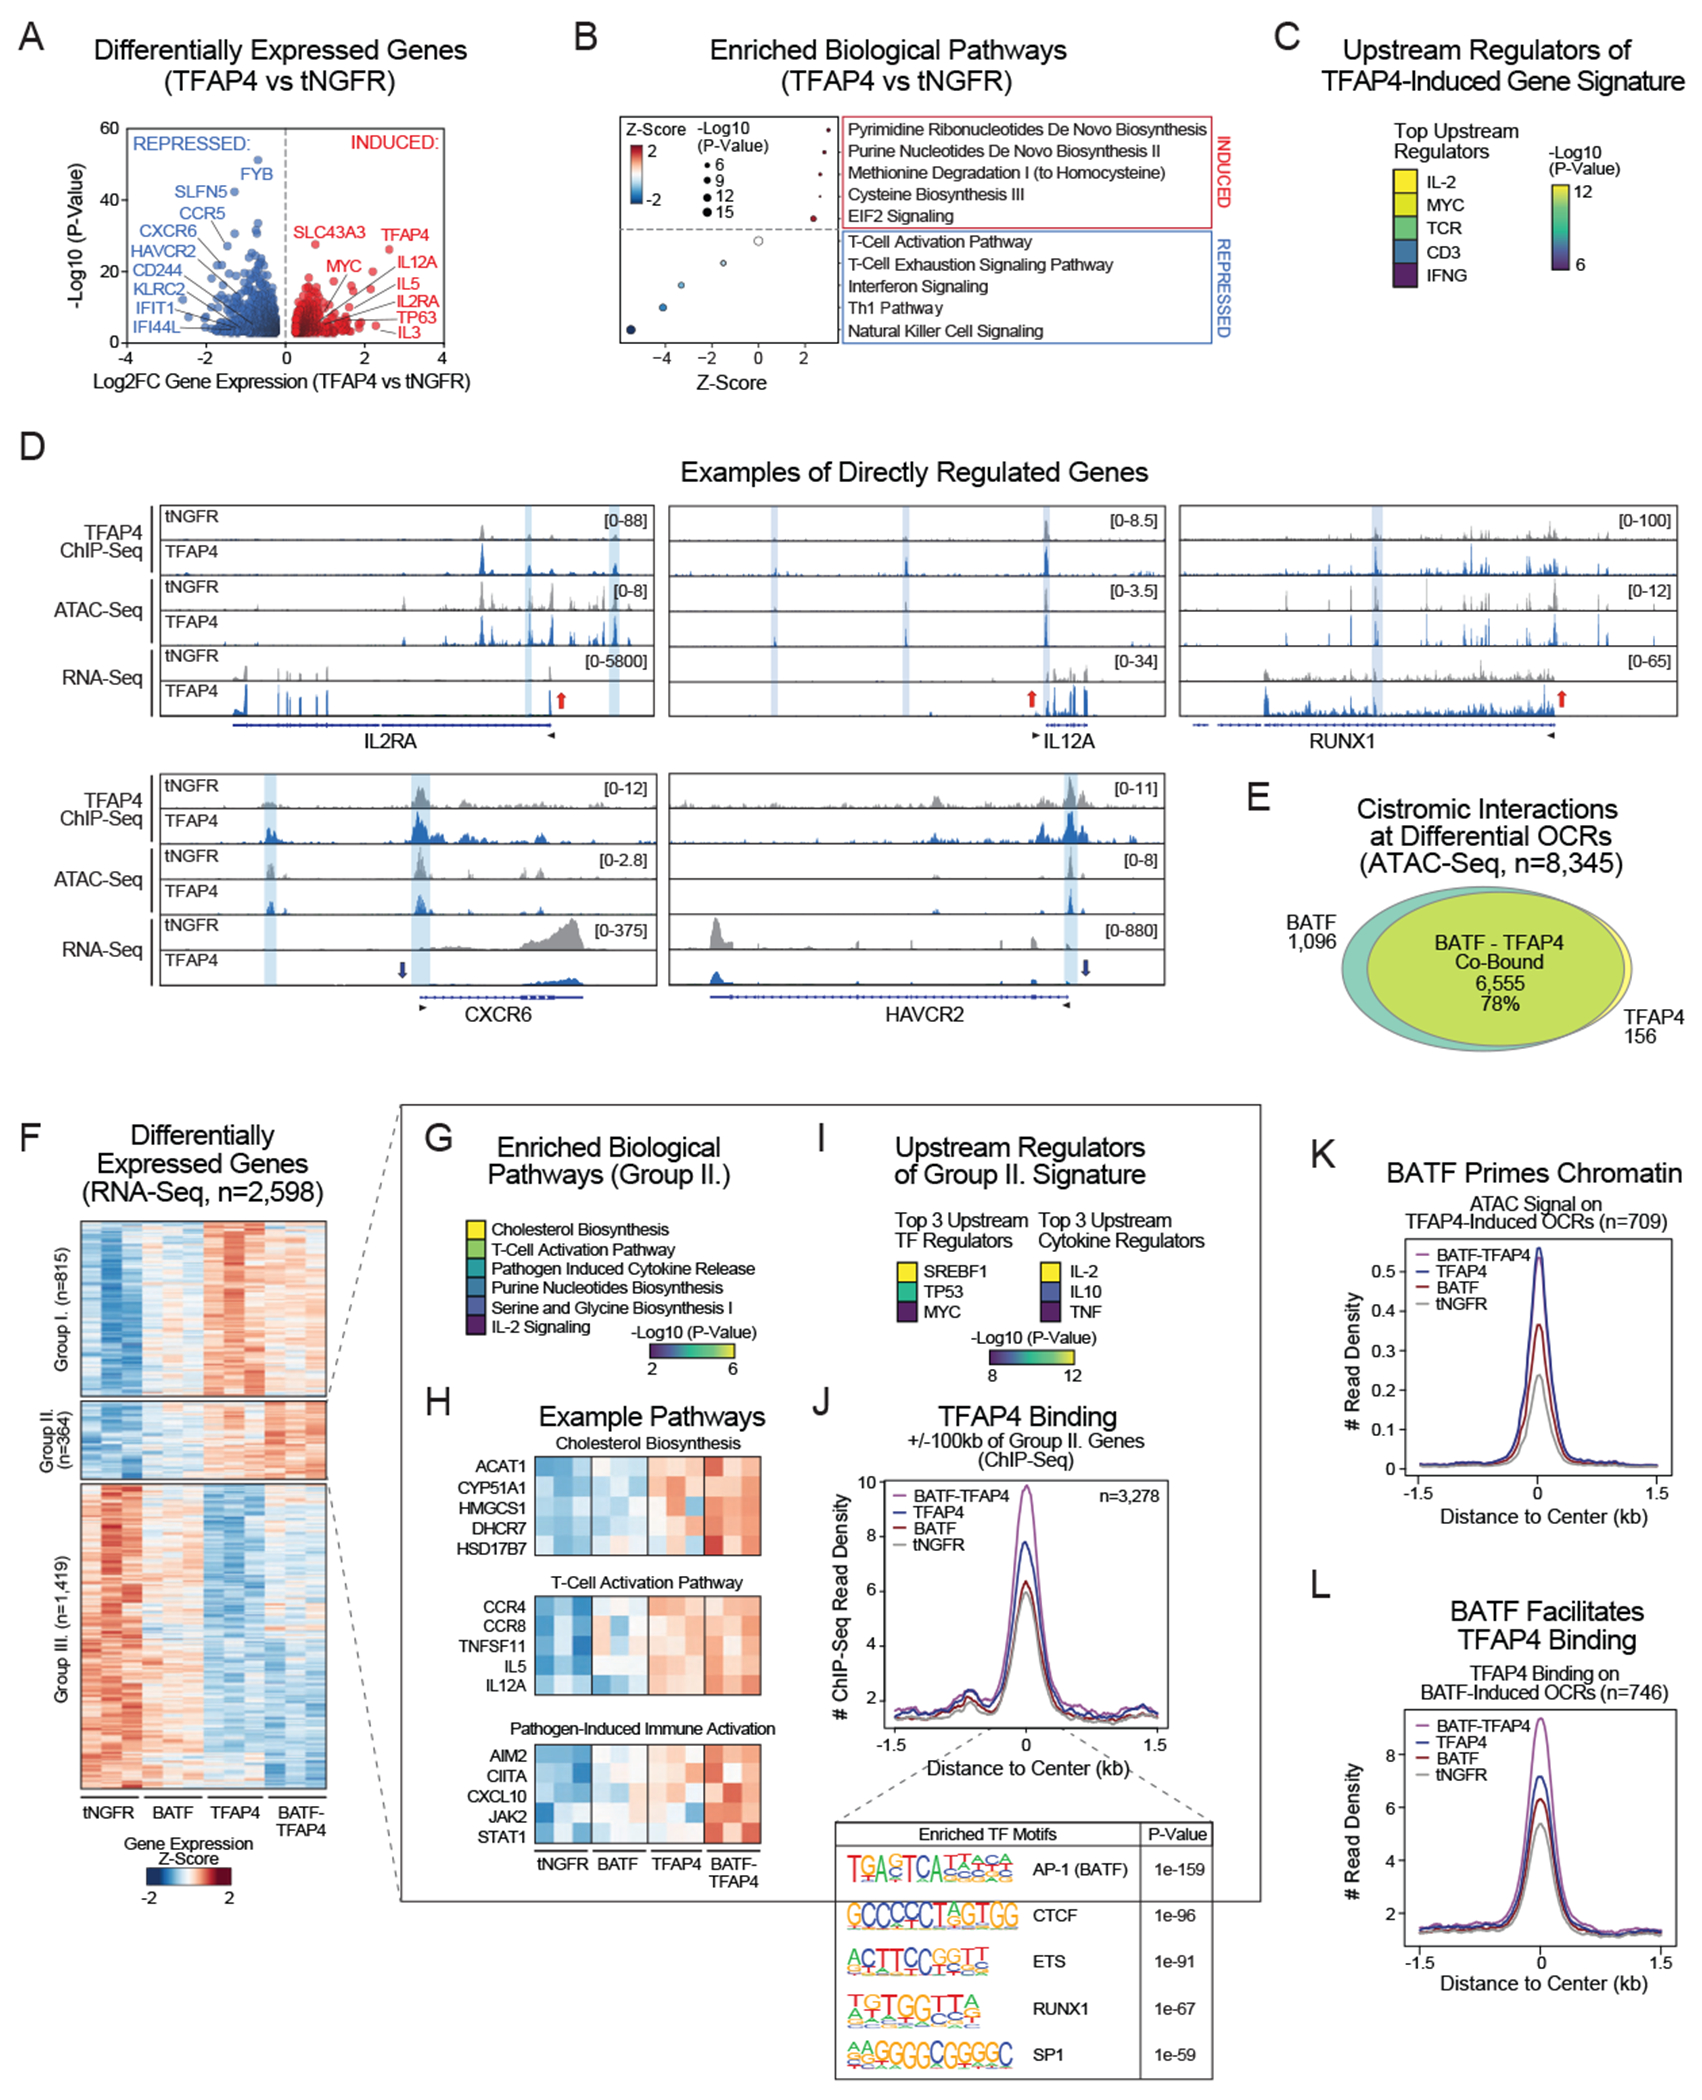
Chronic stimulation can cause T cell dysfunction and limit the efficacy of cellular immunotherapies. Improved methods are required to compare large numbers of synthetic knockin (KI) sequences to reprogram cell functions. Here, we developed modular pooled KI screening (ModPoKI), an adaptable platform for modular construction of DNA KI libraries using barcoded multicistronic adaptors. We built two ModPoKI libraries of 100 transcription factors (TFs) and 129 natural and synthetic surface receptors (SRs). Over 30 ModPoKI screens across human TCR- and CAR-T cells in diverse conditions identified a transcription factor AP4 (TFAP4) construct that enhanced fitness of chronically stimulated CAR-T cells and anti-cancer function in vitro and in vivo. ModPoKI's modularity allowed us to generate an ∼10,000-member library of TF combinations. Non-viral KI of a combined BATF-TFAP4 polycistronic construct enhanced fitness. Overexpressed BATF and TFAP4 co-occupy and regulate key gene targets to reprogram T cell function. ModPoKI facilitates the discovery of complex gene constructs to program cellular functions.

Keywords: CRISPR; chimeric antigen receptor; chronic stimulation; human T cells; immunotherapy; knockins; pooled screens; synthetic surface receptor; transcription factor.


Conflict of interest statement

Declaration of interests F.B. received research awards (Gilead and Kite and Bristol Myers Squibb Foundation Immunonkologie). E.S. was an advisor for Arsenal Biosciences. J.E. is a compensated co-founder at Mnemo Therapeutics and compensated scientific advisor to Cytovia Therapeutics. J.E. owns stocks in Mnemo Therapeutics and Cytovia Therapeutics. J.E. has received a consulting fee from Casdin Capital. The Eyquem lab has received research support from Cytovia Therapeutics and Takeda. T.L.R. is a compensated co-founder, member of the scientific advisory board, and previously worked as the CSO of Arsenal Biosciences. A.T.S. is a founder of Immunai and Cartography Biosciences and receives research funding from Allogene Therapeutics and Merck Research Laboratories. C.T.M. is a compensated Bio+Health Venture Fellow at Andreessen Horowitz. C.J.Y. is founder for and holds equity in DropPrint Genomics (now ImmunAI) and Survey Genomics, a scientific advisory board member for and holds equity in Related Sciences and ImmunAI, a consultant for and holds equity in Maze Therapeutics, and a consultant for TReX Bio, HiBio, ImYoo, and Santa Ana. C.J.Y. has received research support from Chan Zuckerberg Initiative, Chan Zuckerberg Biohub, Genentech, BioLegend, ScaleBio, and Illumina. A.M. is a co-founder of Arsenal Biosciences, Spotlight Therapeutics, and Survey Genomics, serves on the boards of directors at Spotlight Therapeutics and Survey Genomics, is a board observer (and former member of the board of directors) at Arsenal Biosciences, is a member of the scientific advisory boards of Arsenal Biosciences, Spotlight Therapeutics, Survey Genomics, NewLimit, Amgen, Tenaya, and Lightcast, owns stock in Arsenal Biosciences, Spotlight Therapeutics, NewLimit, Survey Genomics, PACT Pharma, Tenaya, and Lightcast and has received fees from Arsenal Biosciences, Spotlight Therapeutics, Survey Genomics, NewLimit, 23andMe, PACT Pharma, Juno Therapeutics, Tenaya, Lightcast, GLG, Gilead, Trizell, Vertex, Merck, Amgen, Genentech, AlphaSights, Rupert Case Management, Bernstein, and ALDA. A.M. is an investor in and informal advisor to Offline Ventures and a client of EPIQ. The Marson laboratory received research support from Juno Therapeutics, Epinomics, Sanofi, GlaxoSmithKline, Gilead, and Anthem. T.L.R., F.B., A.M., R.A., Y.Y.C., C.T.M., and E.S. are listed on patent applications related to this work.

Figures

Figure 1.
Figure 1.. ModPoKI Screens to Identify Therapeutic Candidates
(A) Schematic illustration of the ModPoKI platform. (B) Barcoded multicistronic adaptors allowed for modular cloning, barcode-sequencing and translation of separate proteins. A furin sequence was included to help remove 2A residues from the upstream gene product., (C) Barcode representation in the plasmid library (100 TFs, 129 SRs). N = 2 replicates. Indicated insert size does not include homology arms. (D) Sequencing of the 5’ BC from gDNA after ModPoKI was reproducible across n = 2 human donors (7 days after electroporation). (E) Correlation between gDNA and mRNA/cDNA barcode-sequencing for one exemplary donor (7 days after electroporation). The second donor confirmed strong correlation (R2=0.76). (F) Donors were highly correlated across cell coverage ranges, sequencing strategies and experimental conditions (input cells (day 7 after electroporation) vs cells after 4 days of CD3/CD28 bead-stimulation (day 11)). (G) A pilot two-member library of the NY-ESO-1 TCR plus GFP vs RFP was pooled at the plasmid assembly stage or after separate electroporation (Figure S1I). T cells were sorted for TCR knockin and GFP or RFP positivity. Percentage of correctly assigned barcodes was determined by amplicon-sequencing (3’ barcode of mRNA/cDNA). The amount of template switching was calculated, extrapolated for an n > 200-member library and compared to the previous PoKI version. Bars represent mean. N = 2 donors. Panels C-F include data from NY-ESO-1 TCR TF and SR libraries. R2 was calculated using nonlinear regression (semilog (C) or log-log line model (D-F), GraphPad Prism).
Figure 2.
Figure 2.. Single Stimulation ModPoKI Screens Reveal Known and Previously Undescribed Candidates
(A) ModPoKI screens were performed in primary human T cells using the NY-ESO-1 TCR TF and SR libraries. Signal 1 Stim = anti-CD3 antibody, Signal 1+2 Stim = CD3/CD28 beads (1:1 bead:cell ratio), Signal 1+2 Excess Stim = CD3/CD28 beads (5:1 bead:cell ratio), Melanoma Cells = A375s, Leukemia Cells = Nalm-6 (overexpressing HLA-A2/NY-ESO-1). (B) Amplicon/barcode-sequencing was performed before and after excessive CD3/CD28 stimulation to determine log2FC in construct abundance (after vs before stim). FDR was calculated using the Benjamini-Krieger-Yekutieli method. (C) Representation of T-cell constructs was evaluated prior to and after different stimulation conditions. (D-F) Effect of the intracellular domains of FAS, LTBR and CTLA-4 switch receptors was analyzed. N = 6 donors (B-F). Mean + SEM log2FC over input population is shown. Log2FC was normalized to abundance of RFP/GFP controls and to fit on a scale from −1 to +1 for comparability (C-F).
Figure 3.
Figure 3.. ModPoKI Screens Identify Highly Functional T-Cell Constructs after Repetitive Stimulation
(A) Schematic illustration of the repetitive stimulation screens. (B) Control T cells (tNGFR NY-ESO-1 TCR) were generated and subjected to repetitive stimulation to evaluate T-cell phenotype. (C) Intranuclear expression of TOX was measured by flow cytometry (tNGFR NY-ESO-1 TCR). Bars represent mean. (D) ModPoKI T cells were generated using the NY-ESO-1 TCR SR and TF libraries. Average log2FC of construct abundance compared to input population is shown. (E) The TF library (with NY-ESO-1 TCR) was knocked into T cells and single-cell RNA-sequencing with barcode-sequencing (ModPoKI-Seq) was performed. UMAP shows overexpression of hallmark genes at the input stage, after one and five stimulations with targets. (F) Semi-supervised clustering of single cells based on gene expression after five stimulations. Cluster 9 cells expressed hallmarks of proliferating CD8 cells. Highlighted hallmark genes were derived from top 30 differentially expressed genes. (G) Density plot of top candidates compared to control knockins (GFP,RFP) after five stimulations. (H) Chi-square residuals for cluster 9 enrichment (proliferating CD8 cells, threshold >30 cells/knockin after 5 stimulations) were compared to abundance log2FC in bulk screens. N = 2 donors for ModPoKI-Seq screen, n = 4 donors for bulk screens. Enrichment of KIs in other clusters is depicted in Figure S4D. (I) CD19-BBz CAR TF and SR libraries were generated by pooled assembly. Repetitive stimulation CAR screening hits were compared to TCR screening hits. Nonlinear regression (line model, GraphPad Prism) was used to determine R2. (J) Abundance log2FC (output vs input) was compared between CAR vs TCR repetitive stimulation screens. Mean + SEM shown. N = 2 donors in technical triplicates (B-C), n = 4 donors (D), n = 2 donors (E-G), n = 4 donors for TCR screens and n = 3 donors for CAR screens (I-J).
Figure 4.
Figure 4.. ModPoKI across Dysfunction Screens Nominates Candidate TFAP4
(A) ModPoKI screens with the TF library were performed in NY-ESO-1 TCR and CD19-BBz CAR (single or repetitive stimulation) or HA-GD2-28z CAR (tonic stimulation) T cells. As the HA-GD2-28z CAR provides tonic stimulation, HA-GD2-28z CAR T cells were cultured without addition of targets. Abundance log2FC is shown. Heatmap was normalized based on controls (RFP/GFP) and to fit on a scale from −1 to +1. N ≥ 3 donors/screen. (B) Log2FC in the HA-GD2-28z CAR screen shows strong progressive enrichment of TFAP4 KI cells. Mean of n = 4 donors. (C) Single knockin of the HA-GD2-28z or CD19-28z CAR with TFAP4 or control (tNGFR) was performed and cancer-cell killing was analyzed (Incucyte). CD19-28z CARs were pre-stimulated with targets five times. N = 2 donors/experiment in technical triplicates (HA-GD2-28z CAR) or quadruplicates (CD19-28z CAR). Two-way ANOVA was performed including Holm-Sidak’s test as described in the Methods. Significance at last timepoint (TFAP4 vs tNGFR) is shown; E:T ratio 1:4 (left) and 1:1 (right panel). (D) NSG mice were challenged with 0.5e6 Nalm-6/GFP/Luc/GD2 cells and treated with 1e6 HA-GD2-28z CAR+ T cells. Cancer growth was analyzed by bioluminescence imaging. Two T-cell donors are shown (5 mice/donor/construct). Multiple unpaired t-test (TFAP4 vs tNGFR) with Holm-Sidak’s test was performed (both donors combined). (E) NSG mice were challenged with 1e6 Nalm-6/GFP/Luc/GD2 cells and treated with 3e6 HAGD2-28z CAR+ T cells. Survival analysis for mice treated with CAR-T cells from two donors is shown (≥4 mice/donor/construct). COX regression was performed (TFAP4 vs tNGFR, both donors combined). (F) Expression of endogenous TFAP4 in naïve vs activated T cells in published RNA-seq data (https://dice-database.org/). Unpaired t-test was performed. (G) IL2RA and CD69 expression on HA-GD2-28z CAR-T cells was analyzed on day 8 after electroporation. Multiple t-test was performed including Holm Sidak’s test. N = 2 donors in technical duplicates. (H) RNA-sequencing of HA-GD2-28z CAR-T cells with TFAP4 or tNGFR KI was performed 7 days after electroporation. N = 2 donors. Mean + SEM shown (C-D, G).
Figure 5.
Figure 5.. Combinatorial ModPoKI Screens Uncover Efficient TF Combinations
(A) Schematic illustration of combinatorial ModPoKI to screen ~10,000 TF combinations. (B) Barcode-sequencing of the TFxTF plasmid library showed size-dependent representation, but confirmed that >99% of constructs were represented after pooled assembly. (C) Knockin percentage of combinatorial constructs was analyzed in the cell pool on day 4 after electroporation by barcode-sequencing and showed >99% representation of the ~10,000 constructs. (D) The TFxTF combinatorial library in combination with the HA-GD2-28z CAR was knocked into primary human T cells. Cells were sorted on day 4 and 16 after electroporation and log2FC in barcode abundance was assessed. Statistics were calculated using DESeq2. To create the volcano plot, the two possible construct orientations (e.g., BATF-TFAP4 and TFAP4-BATF) were combined. The right panel shows data for various KI combinations (barcodes for constructs with both orientations included as bars x two donors). N = 2 donors (C-D). Linear regression was performed (lm function, RStudio) (B-C).
Figure 6.
Figure 6.. Combinatorial BATF-TFAP4 Knockin Induces Favorable T-Cell Programs
(A) Competitive fitness assays with combinatorial knockin constructs (HA-GD2-28z CAR) were performed (data normalized to day 0, unpaired t-test performed on day 4). (B) Activation marker expression was analyzed on HA-GD2-28z CARs 8 days after electroporation. 2-way ANOVA with Holm-Sidak’s correction was performed. (C) Exemplary flow cytometry for phenotypic markers 14 days after electroporation. (D) Phenotypic analysis of combinatorial KI HA-GD2-28z CARs 14 days after electroporation. 2-way ANOVA with Holm-Sidak’s correction was performed. (E) Differentially expressed genes in BATF-TFAP4 compared to RFP-tNGFR control KI HA-GD2-28z CARs were analyzed by RNA-seq 14 days after electroporation. The most differentially expressed gene was TFAP4 (not shown, log2FC 5.0, padj 6.03E-77). The color indicates if the respective gene was also found among the most differentially expressed genes when comparing TFAP4-RFP vs control, BATF-RFP vs control or in both of these comparisons. Highlighted in yellow are genes that were differentially expressed selectively in BATF-TFAP4 vs RFP-tNGFR KI. N = 2 donors. (F) Combinatorial KI HA-GD2-28z CARs were co-cultured with Nalm-6/GFP/Luc/GD2 cells and target-cell killing was analyzed (Incucyte). Reduced number of replicates for RFP-tNGFR condition was due to low cell counts (Figures S10D–E). 2-way ANOVA with Holm-Sidak’s correction was performed as described in the Methods. (G) NSG mice were injected with 0.5e6 Nalm-6/GFP/Luc/GD2 cells and treated with 1e6 HA-GD2-28z CAR+ cells. Leukemic load was determined by bioluminescence imaging. N = 2 T-cell donors, 2-5 mice/donor/group. Donors are shown separately in Figure S10F. 2-way ANOVA with Holm Sidak’s test was performed to compare all constructs against the control (RFP-tNGFR) (both donors combined). N = 2 donors in technical duplicates (B, D) or triplicates (A, F). Mean (+ SEM) shown (A-B, D, F-G).
Figure 7.
Figure 7.. BATF Facilitates TFAP4-Mediated Epigenomic Reprogramming
(A) Differentially expressed genes in RNA-seq of TFAP4 vs tNGFR HA-GD2-28z CAR-T cells 14 days after electroporation. (B) Pathway analysis of the differentially expressed genes by QIAGEN Ingenuity Pathway Analysis (IPA). Top 5 enriched pathways are shown for induced/repressed genes. (C) Upstream regulator analysis of the TFAP4 KI-regulated gene signature by QIAGEN IPA. Top 5 hits are shown. (D) Examples of ChIP-/ATAC-/RNA-seq tracks at genomic loci regulated by TFAP4 KI. (E) Venn diagram depicts genome occupancy of BATF and/or TFAP4 (CHIP-seq) at differential open chromatin regions (OCRs). (F) Heatmap depicts the differentially expressed genes across indicated conditions. Gene groups were defined by k-means clustering and describe distinct expression patterns: Group I. Induced by TFAP4 KI and dampened by BATF KI; Group II. Induced by TFAP4 KI and potentiated by BATF-TFAP4 KI; Group III. Repressed by both TFAP4 and BATF. (G) Pathway analysis of Group II genes by QIAGEN IPA. Top 5 enriched pathways are shown. (H) Gene expression heatmaps depict example genes from the top 3 biological pathways (panel G). (I) Upstream regulator analysis of the Group II gene signature by QIAGEN IPA. Top 3 TF and cytokine hits are shown. (J) Metagene plot of normalized TFAP4 ChIP-seq signal at TFAP4 peaks +/−100kb around transcription start sites of Group II genes with corresponding motif analysis. (K) Metagene plot of normalized ATAC-seq signal at TFAP4 KI-induced OCRs. (L) Metagene plot of normalized TFAP4 ChIP-seq signal at BATF KI-induced OCRs. (A, E-F) FDR < 0.05, log2FC ≥ 0.5. (A-D) include TFAP4 vs tNGFR single KI HA-GD2-28z CARs. (E) summarizes data from all ChIPseq conditions (TFAP4, BATF, tNGFR single KI and BATF-TFAP4 combinatorial KI HA-GD2-28z CARs). (F-I) include RNA-seq from RFP-tNGFR (“tNGFR”), BATF-RFP (“BATF”), RFP-TFAP4 (“TFAP4”) and BATF-TFAP4 HA-GD2-28z CARs. (J+L) show ChIP-seq data from TFAP4, BATF and tNGFR single KI and BATF-TFAP4 combinatorial KI HA-GD2-28z CARs. (K) shows ATACseq from RFP-tNGFR (“tNGFR”), BATF-RFP (“BATF”), RFP-TFAP4 (“TFAP4”) and BATF-TFAP4 HA-GD2-28z CARs. N = 3 donors.

Similar articles

Cited by

References

    1. Esensten JH, Bluestone JA, and Lim WA (2017). Engineering Therapeutic T Cells: From Synthetic Biology to Clinical Trials. Annu Rev Pathol 12, 305–330. 10.1146/annurev-pathol-052016-100304. - DOI - PMC - PubMed
    1. Fesnak AD, June CH, and Levine BL (2016). Engineered T cells: the promise and challenges of cancer immunotherapy. Nat Rev Cancer 16, 566–581. 10.1038/nrc.2016.97. - DOI - PMC - PubMed
    1. June CH, and Sadelain M (2018). Chimeric Antigen Receptor Therapy. N Engl J Med 379, 64–73. 10.1056/NEJMra1706169. - DOI - PMC - PubMed
    1. Delgoffe GM, Xu C, Mackall CL, Green MR, Gottschalk S, Speiser DE, Zehn D, and Beavis PA (2021). The role of exhaustion in CAR T cell therapy. Cancer Cell 39, 885–888. 10.1016/j.ccell.2021.06.012. - DOI - PubMed
    1. Schietinger A, Delrow JJ, Basom RS, Blattman JN, and Greenberg PD (2012). Rescued tolerant CD8 T cells are preprogrammed to reestablish the tolerant state. Science 335, 723–727. 10.1126/science.1214277. - DOI - PMC - PubMed

Publication types