. 2023 Oct 10;56(10):2373-2387.e8.
doi: 10.1016/j.immuni.2023.08.018. Epub 2023 Sep 14.

Antigen receptor signaling and cell death resistance controls intestinal humoral response zonation

Affiliations

Antigen receptor signaling and cell death resistance controls intestinal humoral response zonation

Fiona Raso et al. Immunity. .

Abstract

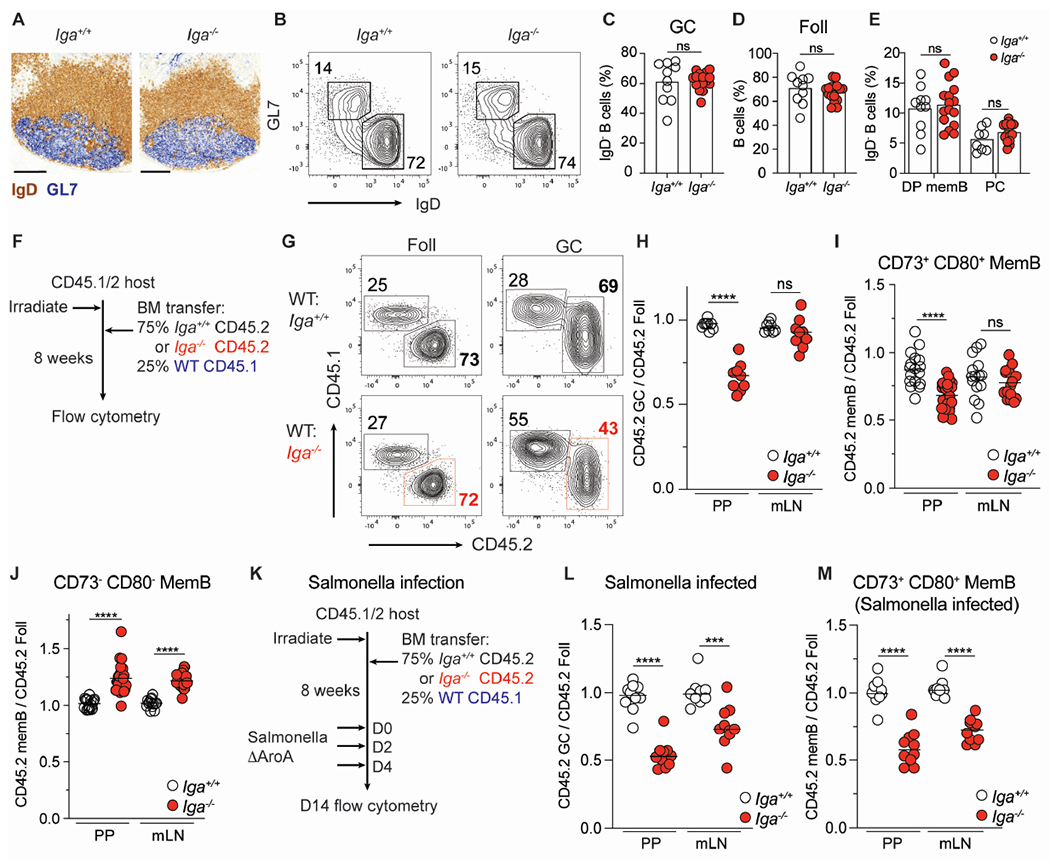
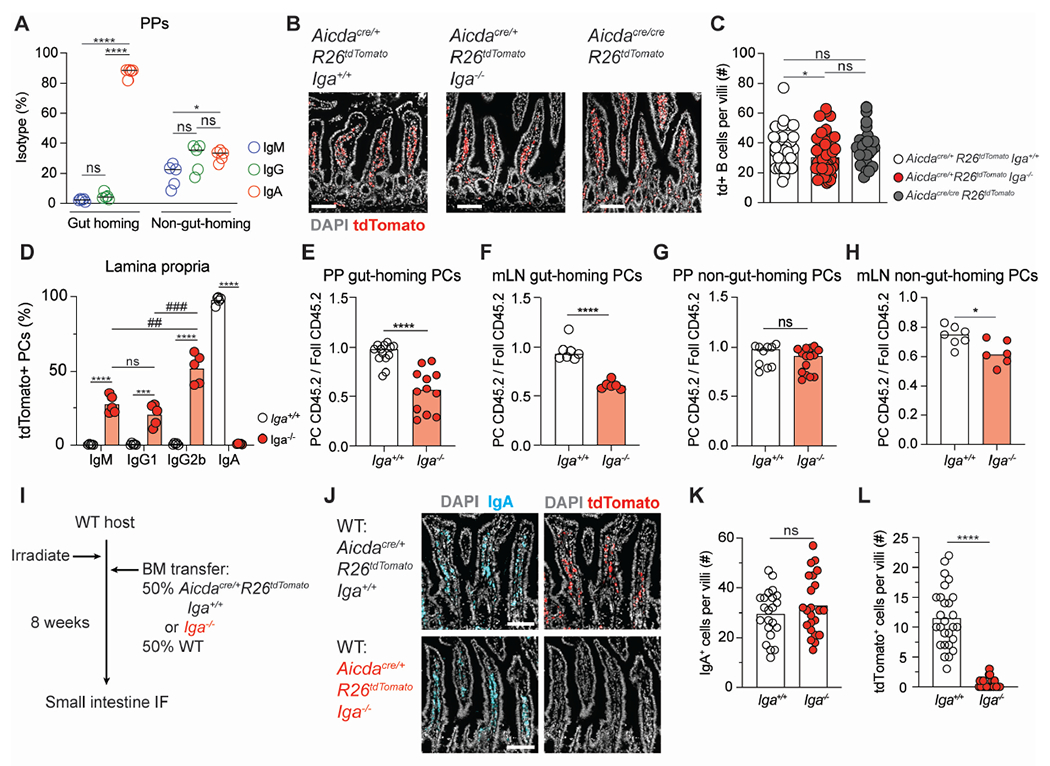
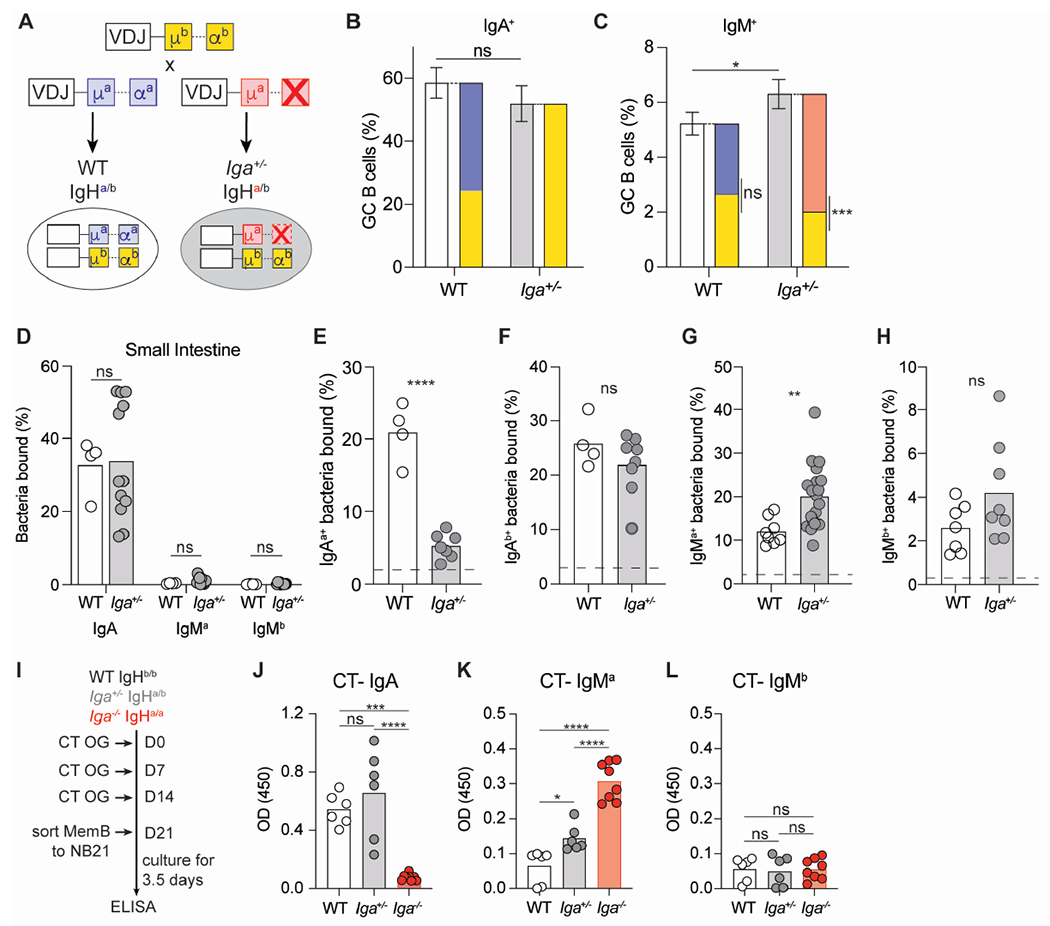
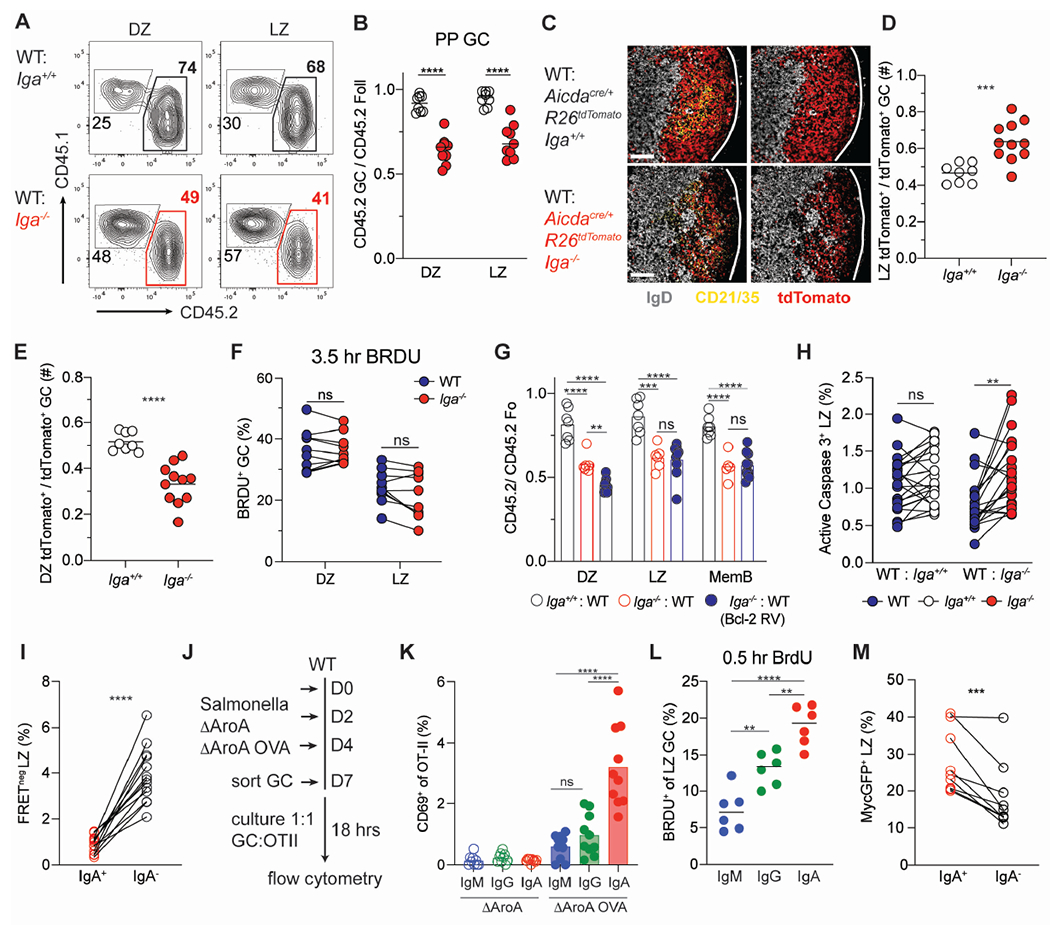
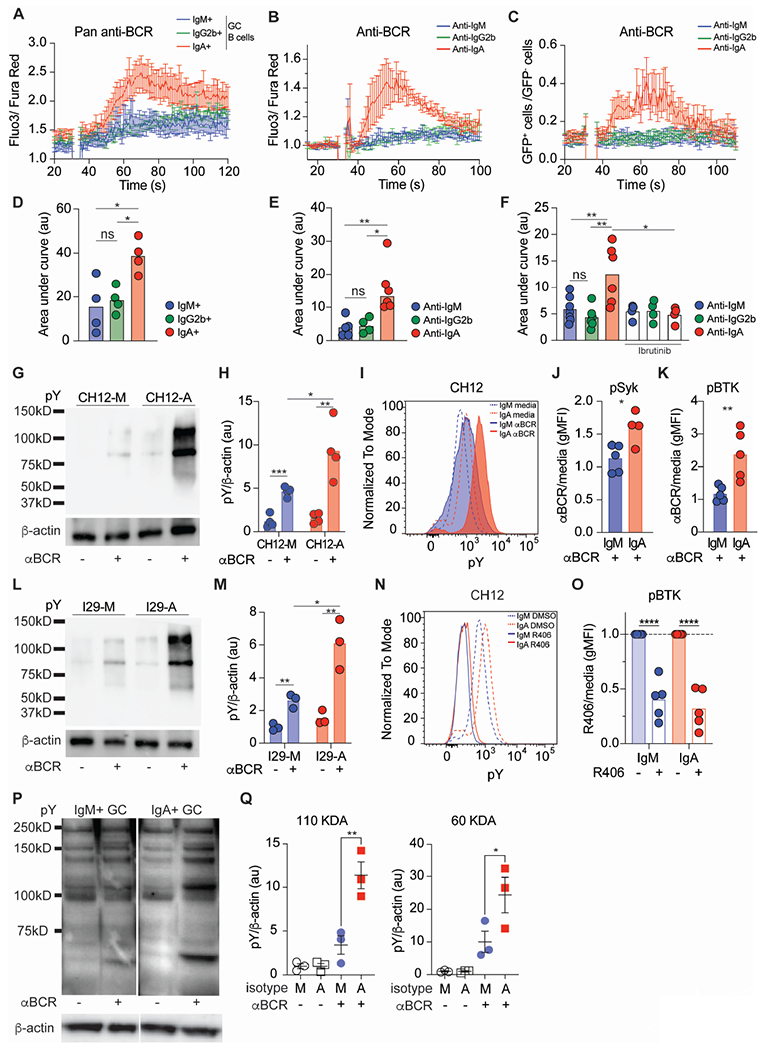
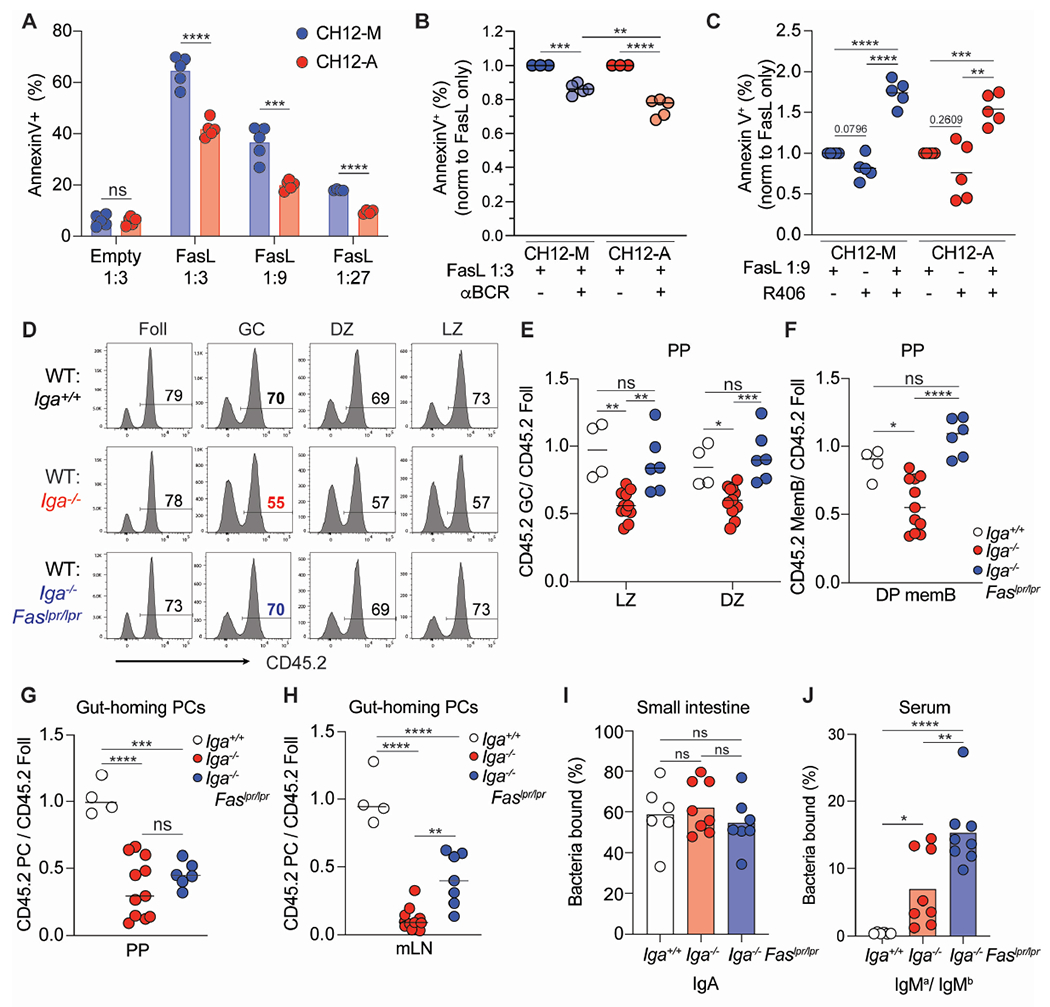
Immunoglobulin A (IgA) maintains commensal communities in the intestine while preventing dysbiosis. IgA generated against intestinal microbes assures the simultaneous binding to multiple, diverse commensal-derived antigens. However, the exact mechanisms by which B cells mount broadly reactive IgA to the gut microbiome remains elusive. Here, we have shown that IgA B cell receptor (BCR) is required for B cell fitness during the germinal center (GC) reaction in Peyer's patches (PPs) and for generation of gut-homing plasma cells (PCs). We demonstrate that IgA BCR drove heightened intracellular signaling in mouse and human B cells, and as a consequence, IgA+ B cells received stronger positive selection cues. Mechanistically, IgA BCR signaling offset Fas-mediated death, possibly rescuing low-affinity B cells to promote a broad humoral response to commensals. Our findings reveal an additional mechanism linking BCR signaling, B cell fate, and antibody production location, which have implications for how intestinal antigen recognition shapes humoral immunity.

Keywords: B cell receptor; Fas; IgA; Peyer's patch; germinal center; gut homing.


Conflict of interest statement

Declaration of interests The authors declare no competing interests.

Figures

Figure 1.
Figure 1.. IgA+ B cells dominate the germinal center reaction and are preferentially selected into the memory compartment.
(A-E) Steady state, co-housed, 8–12-week-old Iga+/+ and Iga−/− mice. (A) Frozen PP sections from Iga+/+ and Iga−/− mice stained with immunohistochemistry antibodies against IgD (brown) and GL7 (blue). Scale bars, 200 μm. (B) Representative plot of PP GC (GL7+ IgD) and Foll (GL7 IgD+) B cells in Iga+/+ and Iga−/− mice. Gated on live CD138 B cells. (C) PP GC B cells as percentage of activated (IgD) B cells. (D) PP Foll B cells as percentage of B cells. (E) CD73+ CD80+ (DP) MemB, PCs as percentage of activated B cells. (F) Iga−/− mixed BM chimera experimental set up for (G-J). (G) Representative CD45 staining on Foll and GC B cells in mixed BM chimeras. (H) Ratio of frequency of CD45.2 GC B cells to CD45.2 Foll B cells in PP and mLN. (I, J) Ratio of frequency of CD45.2 DP memB cells (I) or CD45.2 CD73 CD80 (DN) MemB cells (J) to CD45.2 Foll B cells in PP and mLN. (K) Salmonella infection experimental setup in Iga−/− mixed BM chimera for (L-M). (L) Ratio of frequency of CD45.2 GC B cells to CD45.2 Foll B cells in PP and mLN of Salmonella infected chimeras. (M) Ratio of frequency of CD45.2 DP MemB cells to CD45.2 Foll B cells in PP and mLN of Salmonella infected chimeras. Data from at least 3 independent experiments with 2-3 mice per group (A-M). Each symbol represents one mouse. ns=not significant; ***p < 0.0005; ****p < 0.0001; Unpaired two-tailed Student’s t-test. See also Figure S1.
Figure 2.
Figure 2.. IgA is required for efficient plasma cell homing to the intestinal lamina propria.
(A) Isotypes of gut-homing (α4β7+ CCR9+) and non-gut homing PCs from PPs of WT mice treated with FTY-720 for seven days. IgG is defined as IgG1+ or IgG2b+. (B) Representative immunofluorescence of small intestinal villi from Aicdacre/+ Rosa26Stop-tdTomato Iga+/+, Aicdacre/+ Rosa26Stop-tdTomato Iga−/−, Aicdacre/cre Rosa26Stop-tdTomato mice stained with DAPI (gray) and tdTomato (red). Scale bars, 100 μm. (C) Quantification of multiple images as in (B). Number of tdTom+ cells per villi. (D) Isotype staining in Aicdacre/+ Rosa26Stop-tdTomato Iga+/+ and Aicdacre/+ Rosa26Stop-tdTomato Iga−/− lamina propria. Gated on CD98+ B220 CD4 PCs. (E, F) Ratio of frequency of CD45.2 gut-homing PCs to CD45.2 Foll B cells from PPs (E) or mLN (F) of mixed BM chimeras. (G, H) Ratio of frequency of CD45.2 non-gut-homing PCs to CD45.2 Foll B cells from PPs (G) or mLN (H) of mixed BM chimeras. (I) Aicdacre/+ Rosa26Stop-tdTomato Iga+/+ mixed BM chimera experimental set up for (J-L). (J) Representative immunofluorescence of small intestinal villi stained for DAPI (gray), IgA (cyan), and tdTomato (red) in WT: Aicdacre Rosa26Stop-tdTomato Iga+/+ or Iga−/− mixed BM chimeras. Scale bars, 100 μm. (K, L) Quantification of multiple images as in (J). Number of IgA+ cells (K) or tdTom+ cells (L) per villi. Data from 2 independent experiments with 2-3 mice per group (A, C, D, K, L). Data from at least 3 independent experiments with 3-5 mice per group (E-H). Each symbol represents one mouse. (C, K, L) Each symbol represents one villi with at least 5 villi quantified per image. ns=not significant, *p < 0.005; ##p < 0.001; ***, ###p < 0.0005; ****p < 0.0001. Unpaired two-tailed Student’s t-test in E-H, K, L. One way ANOVA was used in A(*), C(*), and D(#) . See also Figure S2.
Figure 3.
Figure 3.. IgA is dominant in activated B cells of intrinsic chimera mice.
(A) Breeding setup for WT IgHa/b and Iga+/− IgHa/b mice. (B, C) Percentage of IgA+ (B) and IgM+ (C) GC B cells in PPs. Solid bars represent indicated total isotype in GC; stacked bars represent allotypic isotype in GC of WT and Iga+/− mice. (D) Percentage of endogenously coated small intestinal bacteria with indicated antibodies. (E, F) Percentage of intestinal commensal from μMT mice stained by IgAa (E) or IgAb (F) antibodies from Iga+/+ or Iga+/− serum. (G, H) Percentage of intestinal commensal bacteria from μMT mice stained by IgMa (G) or IgMb (H) antibodies from Iga+/+ or Iga+/− serum. Dashed line represents unstained μMT bacteria in E-H. (I) Experimental setup for cholera toxin(CT) oral immunization and subsequent MemB cell in vitro culture with NB21 feeder cells. (J, K, L) ELISA OD for CT specific IgA (J), IgMa (K), and IgMb (L) antibodies detected in MemB supernatant 3.5 days after in vitro culture. Data from at least 3 independent experiments with 2-3 mice per group (B-H). Data from 4 independent experiments with 1-3 mice per group (J-L). ns=not significant, *p < 0.005; **p < 0.001; ***p < 0.0005; ****p < 0.0001; Unpaired two-tailed Student’s t-test in B-H. One way ANOVA in J-L. See also Figure S2.
Figure 4.
Figure 4.. IgA+ B cells exhibit higher cell death resistance and experience stronger T cell-dependent help in GC LZ.
(A) Representative CD45 staining on PP GC LZ (CXCR4lo CD86hi) and DZ (CXCR4hi CD86hi) B cells in mixed BM chimeras. (B) Ratio of frequency of CD45.2 DZ or LZ B cells to CD45.2 Foll B cells in PP of mixed BM chimeras. (C) Representative PP immunofluorescence stained for DAPI (gray), tdTomato (red) and CD21/35 (cyan), in WT: Aicdacre/+ Rosa26Stop-tdTomato Iga+/+ or Iga−/− mixed BM chimeras. Scale bars, 100 μm. Lines indicate GC edges with LZ oriented on left, DZ right. (D, E) Guantification of multiple images as in (C). Ratio of frequency of tdTom+ cells in LZ (D) or DZ (E) to total TdTom+ GC B cells. (F) Percentage of BrdU+ DZ or LZ GC B cells in PPs of Iga−/− :WT mixed BM chimeras after 3.5 hour BrdU pulse. (G) Ratio of frequency of indicated CD45.2 B cells to CD45.2 Foll B cells in PP of WT Bcl2: Iga−/− Bcl2 retroviral mixed BM chimeras. (H) Percentage of active caspase3+ LZ GC B cells in mixed BM chimeras. (I) Percentage of FRET negative LZ IgA+ and IgA cells from Rosa26INDIA PPs. (J) Experimental set up for Salmonella ΔAroA infection and in vitro GC antigen presentation in (K). (K) Percentage of CD69+ CD4+ OT-II T cells co-cultured with indicated GC B cell isotype. PP GC subsets were sorted according to isotype expression (IgG = IgG1+ or IgG2b+). Mice were infected with Salmonella ΔAroA expressing or not expressing OVA (ΔAroA or ΔAroAOVA). Each symbol is the average of technical replicates from one mouse. (L) Percentage of BrdU+ LZ GC B cells in PPs for indicated isotypes after 30-minute BrdU pulse. GC subsets were gated according to isotype expression (IgG = IgM IgA). (M) Percentage of cMycGFP+ LZ IgA+ and IgA B cells from cMyc-GFP PPs Data are from at least 3 independent experiments with at least 3 mice per group (B, F, H, I, M, K). Data are from 2 experiments with 2-3 mice per group (C-E, G, L). ns=not significant, **p < 0.001; ***p < 0.0005; ****p < 0.0001. Unpaired two-tailed Student’s t-test in B, D, E, F, H, I, M. One-way ANOVA in G, K, L. See also Figure S3.
Figure 5.
Figure 5.. Enhanced BCR signaling in murine and human IgA+ GC B cells.
(A) Compiled calcium traces for IgM, IgG2b, and IgA PP GC B cells (defined as isotype negative populations) stimulated with pan anti-BCR. (B) Compiled calcium traces for Aicdacre/+ Rosa26Stop-tdTomato/+ PP GC B cells stimulated with indicated anti-BCR isotypes. (C) Compiled calcium traces from Aicdacre/+ Rosa26Stop-tdTomato/gCAMP PP GC B cells stimulated with indicated anti-BCR isotypes. Shown as ratio of frequency of gCAMP-GFP+ to gCAMP-GFP cells per second. (D) Area under the curve(AUC) of individual calcium traces calculated between 50 and 100 seconds for (A). (E) AUC of individual calcium traces calculated between 40 and 100 seconds for (B). (F) AUC of individual calcium traces calculated between 40 and 100 seconds for (C) Indicated samples were pre-treated with ibrutinib prior to anti-BCR stimulation. (G) Representative pY and β-actin western blots for CH12 cells stimulated with anti-BCR. (H) Quantitative analysis from (G) of pY normalized to β-actin. (I) Representative histogram of pY in CH12 cells after BCR stimulation. (J, K) pSyk (J) or pBTK (K) gMFI normalized to untreated(media) in CH12 cells after anti-BCR. (L) Representative pY and β-actin western blot for I29 cells stimulated with anti-BCR. (M) Quantitative analysis from (L) of pY normalized to β-actin. (N) Representative pY histogram in CH12 cells after R406 incubation. (O) pBTK gMFI normalized to untreated(media) after R406 incubation in CH12 cells. (P) Representative pY and β-actin western blots from GC human tonsils of indicated isotypes after anti-BCR stimulation. Sorted as isotype negative populations. (Q) Quantitative analysis from (P) of pY normalized to β-actin. A, D, H are compiled data from 4 independent experiments. B, C, E, F, J, K, O, Q are compiled data from at least 3 independent experiments. ns=not significant, *p < 0.005; **p < 0.001; ***p < 0.0005; ****p < 0.0001. Unpaired two-tailed Student’s t-test in J, K, O. One-way ANOVA in D, E, F, H, M, Q. See also Figure S4 and S5.
Figure 6.
Figure 6.. IgA+ GC B cells are more resistant to Fas-dependent counter selection.
(A) Percentage of dead (defined as annexinV+) CH12 cells 5 hours after incubation with FasL vesicles at indicated dilutions. (B) Percentage of dead CH12 cells after BCR stimulation and incubation with FasL vesicles. Data is normalized to FasL vesicles alone. (C) Percentage of dead CH12 cells after incubation with R409 and FasL vesicles. Data is normalized to FasL vesicles alone. (D) Representative histograms of CD45 staining on mixed BM chimeras for indicated B cell populations. (E) Ratio of frequency of CD45.2 LZ or DZ B cells to CD45.2 Foll B cells in PPs of mixed BM chimeras. (F) Ratio of frequency of CD45.2 DP memory B cells to CD45.2 Foll B cells from PPs of mixed BM chimeras. (G, H) Ratio of frequency of CD45.2 gut-homing PCs to CD45.2 Foll B cells from PPs(G) and mLN(H) of mixed BM chimeras. (I, J) Mixed BM chimeras using μMT hosts to track antibodies using allotypic isotypes. (I) Percentage of endogenously coated small intestinal bacteria with IgA. (J) Percentage of intestinal commensal from μMT mice stained by IgMa or IgMb antibodies from mixed BM serum. Percentage shown as IgMa/IgMb ratio. A-C are compiled data from at least 3 independent experiments. E-J are compiled data from 3 independent experiments with 1-3 mice per group (E-H) or 2-3 mice per group (I,J). ns=not significant, *p < 0.005; **p < 0.001; ***p < 0.0005; ****p < 0.0001. Unpaired two-tailed Student’s t-test in A. One-way ANOVA in B, C, E-J. See also Figure S6.

References

    1. Catanzaro JR, Strauss JD, Bielecka A, Porto AF, Lobo FM, Urban A, Schofield WB, and Palm NW (2019). IgA-deficient humans exhibit gut microbiota dysbiosis despite secretion of compensatory IgM. Scientific Reports 9, 1–10. 10.1038/s41598-019-49923-2. - DOI - PMC - PubMed
    1. Fadlallah J, El-Kafsi H, Sterlin D, Juste C, Parizot C, Dorgham K, Autaa G, Gouas D, Almeida M, Lepage P, et al. (2018). Microbial ecology perturbation in human IgA deficiency. Science Translational Medicine 10, eaan1217. 10.1126/scitranslmed.aan1217. - DOI - PubMed
    1. Suzuki K, Meek B, Doi Y, Muramatsu M, Chiba T, Honjo T, and Fagarasan S (2004). Aberrant expansion of segmented filamentous bacteria in IgA-deficient gut. P Natl Acad Sci Usa 101, 1981–1986. 10.1073/pnas.0307317101. - DOI - PMC - PubMed
    1. Hand TW, and Reboldi A (2021). Production and Function of Immunoglobulin A. Annu. Rev. Immunol 39, 695–718. 10.1146/annurev-immunol-102119-074236. - DOI - PubMed
    1. Savilahti E, Klemola T, Carlsson B, Mellander L, Stenvik M, and Hovi T (1988). Inadequacy of musocal IgM antibodies in selective IgA deficiency: Excretion of attenuated polio viruses is prolonged. J Clin Immunol 8, 89–94. 10.1007/bf00917895. - DOI - PubMed

Publication types

LinkOut - more resources