. 2023 Oct 5;30(10):1368-1381.e6.
doi: 10.1016/j.stem.2023.08.010. Epub 2023 Sep 14.

Allele-specific expression reveals genetic drivers of tissue regeneration in mice

Affiliations

Allele-specific expression reveals genetic drivers of tissue regeneration in mice

Katya L Mack et al. Cell Stem Cell. .

Abstract

In adult mammals, skin wounds typically heal by scarring rather than through regeneration. In contrast, "super-healer" Murphy Roths Large (MRL) mice have the unusual ability to regenerate ear punch wounds; however, the molecular basis for this regeneration remains elusive. Here, in hybrid crosses between MRL and non-regenerating mice, we used allele-specific gene expression to identify cis-regulatory variation associated with ear regeneration. Analyzing three major cell populations (immune, fibroblast, and endothelial), we found that genes with cis-regulatory differences specifically in fibroblasts were associated with wound-healing pathways and also co-localized with quantitative trait loci for ear wound-healing. Ectopic treatment with one of these proteins, complement factor H (CFH), accelerated wound repair and induced regeneration in typically fibrotic wounds. Through single-cell RNA sequencing (RNA-seq), we observed that CFH treatment dramatically reduced immune cell recruitment to wounds, suggesting a potential mechanism for CFH's effect. Overall, our results provide insights into the molecular drivers of regeneration with potential clinical implications.

Keywords: fibroblasts; fibrosis; gene expression analysis; genetics; genomics; regeneration; wound healing.


Conflict of interest statement

Declaration of interests The authors declare no competing interests.

Figures

Figure 1:
Figure 1:. MRL ear wounds uniquely heal in an accelerated and regenerative fashion.
A. Gross photographs (first two columns) at postoperative day (POD) 2 and 90 of CAST (“normal healer”) and MRL (“super healer”) mice. Hematoxylin and eosin (H&E) histology (third column) of ear wounds at POD 90. Green dotted lines indicate border of wound site; blue overlay indicates cartilage; blue arrow highlights regenerating cartilage in MRL ear wounds. See also Fig. S1. B. Wound curves for CAST and MRL ear wounds showing closure over time. C. Gross photographs (first two columns) of splinted excisional dorsal wounds in CAST and MRL mice; white dotted lines indicate fibrotic scar “bare area.” H&E staining (third column) of POD 14 wounds and unwounded skin. D. Wound curves for CAST and MRL dorsal wounds reflecting rate of re-epithelialization over time. Points represent mean values and error bars represent standard error of the mean. B, D. *P < 0.05, **P < 0.01 (Student’s t-test). n = 6 wounds in three biological replicates.
Figure 2:
Figure 2:. RNA-seq of key wound cell types from CAST x MRL hybrid mice cluster by wound type and allele.
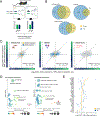
A. Sampling scheme for RNA-seq libraries. MRL and CAST were crossed to produce F1 hybrids for allele-specific expression analysis. Each adult F1 mouse underwent both dorsal excisional and ear punch wounding. On POD 7, wound tissue was harvested, cell populations were isolated via fluorescence-activated cell sorting (FACS), and RNA was extracted for bulk RNA-seq. B. Heatmap of the most variable genes (1,000) following regularized log2 transformation of allele-specific read counts. Hierarchical clustering groups samples by cell population (immune [n=8 libraries], endothelial [n=6], fibroblast [n=6]), allele (MRL [‘M’] vs. CAST [‘C’] and wound site (ear [‘E’] vs. dorsal [‘D’]). C. Principal component analysis of allele-specific read counts. Allele-specific samples separated into distinct clusters by wound site (ear vs. dorsal) and allele (MRL vs. CAST) for each cell population (see also Fig. S2A).
Figure 3:
Figure 3:. Analysis of differential allele-specific expression (diffASE) reveals cis-regulatory divergence unique to MRL ear wounds.
A. Schematic example of diffASE between MRL and CAST in ear and dorsal wounds. Blue and green solid boxes represent gene regulatory regions affecting transcription of the MRL or CAST allele, respectively, of a given gene; transcription levels from each allele are represented by blue and green wavy lines. In the context of a dorsal wound (where MRL and CAST phenotypes are similar), expression is the same from the MRL vs. CAST allele. In contrast, in ear wounds, the presence of a context-specific (i.e., wound-related) transcription factor (TF; grey circle) reveals ASE through differences in the sequence of the MRL vs. CAST regulatory elements (which respond differentially to the TF). Overall, this results in a pattern of diffASE, where allele-specific expression is unique to ear wounds (exemplified in bottom panel bar graphs). B. Venn diagrams showing number of genes with ASE in ear wounds (blue region), dorsal wounds (yellow region), or both (overlapping region) in each analyzed wound cell type (see also Fig. S2C for overlap between cell types). C. Scatterplots for each cell type comparing distribution of allelic ratios between dorsal and ear wounds. Colored points represent genes with diffASE (gold points are genes with a larger difference between CAST and MRL alleles in the ear; blue points are genes with a larger difference between CAST and MRL alleles in the dorsum). See also Fig. S2B. D. Gene set enrichment analysis for genes with evidence of diffASE in fibroblasts, which are highly enriched for gene ontology (GO) categories (left) and mutant phenotypes (right) related to wound healing and injury responses. Such enrichment patterns were unique to fibroblasts (the end cellular mediators of scarring/fibrosis) and not seen in endothelial or immune cells. E. Specific genes associated with mutant phenotypes or GO terms related to responses to injury and wound healing with diffASE in fibroblasts (full gene list in Tables S4, S5). Yellow circles represent fold changes between alleles in the dorsum; blue circles represent fold changes in the ear.
Figure 4:
Figure 4:. Integration of diffASE with QTL fine-mapping study identifies Cfh as a candidate gene for driving the MRL regenerative healing phenotype.
A. LOD scores vs. chromosome position for ear hole closure from Cheverud et al. 2014. Red circles indicate the positions of genetic markers closest to genes identified as having diffASE in fibroblasts. B. Distribution of mean LOD scores of permuted gene sets (20,000 permutations). Red line indicates the mean LOD score of genetic markers closest to the fibroblast diffASE gene set. C. Cfh, which is associated with the gene ontology term for wound healing (GO:0042060) and falls within a fine-mapped region for ear closure, shows ear wound-specific ASE specific to fibroblasts in CAST × MRL hybrids. In fibroblasts, we see significant upregulation of the MRL allele relative to the CAST allele in ear wounds, in contrast to dorsal wounds where the expression of these alleles are similar (n=10 libraries). Point are log2 fold changes from individual libraries. *diffASE q < 0.05 (DESeq2 Wald test).
Figure 5:
Figure 5:. CFH treatment leads to partial regeneration and enhanced healing of dorsal wounds in wildtype mice.
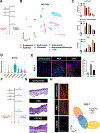
A. Schematic of MRL and CAST dermal fibroblast culture from dorsal and ear skin. B. Left, fluorescent histology of cultured MRL and CAST dorsal and ear fibroblasts with immunohistochemical (IHC) staining for complement factor H (CFH) and DAPI nuclear counterstain. Right, quantification of CFH expression across in vitro conditions. C. Schematic of MRL and CAST dorsal and ear wounding for histology. D. Fluorescent histology (left) and quantification (right) of IHC staining of wounds for CFH (with DAPI nuclear counterstain). E. Schematic of wildtype mouse dorsal splinted wounding with local wound treatment with either recombinant CFH protein or phosphate-buffered saline (PBS; vehicle control) (see Methods for full details and dosing). F. Left, gross photographs of control (−CFH) and CFH-treated (+CFH) wounds; black dotted outline indicates healed wound region. Right, wound curve reflecting rate of re-epithelialization of −CFH vs. +CFH wounds over time. G. Picrosirius red connective tissue histology of −CFH and +CFH wounds and unwounded skin (UW). H. T-distributed stochastic neighbor embedding (t-SNE) plot of quantified extracellular matrix (ECM) ultrastructural parameters, based on picrosirius red histology of unwounded skin and POD 14 wounds (G), showing overall similarities/differences in ECM ultrastructure between conditions. Each dot represents quantified parameters from one histologic image. I. Hematoxylin and eosin (H&E) histology of POD 14 wounds and skin (n=3). Yellow dotted lines denote borders of healed wounds; white arrows indicate putative regenerating dermal appendages (hair follicles or glands) in +CFH wounds. J. Dermal thickness quantified from histology of wounds and skin. B, C, F, J. *P < 0.05 (Student’s t-test). Scale bar; B, 40μm, D, 150μm, G, 40μm, I, 250μm. See also Figs. S3, S4.
Figure 6:
Figure 6:. CFH treatment reduces scarring through Cxcl2 inhibition in dorsal skin wounds.
A. Schematic of CFH and PBS treatment scRNA-seq experiment (n=12 wounds in six biological replicates for each condition and timepoint). B. UMAP of all cells captured from scRNA-seq experiments colored by cell type. C. Bar graphs showing proportions of Neutrophils (top), Macrophages & Monocytes (middle) and T cells (bottom) across all timepoints and treatment groups (Blue: Unwounded; Red: PBS; Black: CFH). D. Violin plot of Cxcl2 expression by postoperative day and treatment group in fibroblasts. E. Immunostaining of CXCL2 in unwounded, PBS-, and CFH-treated wounds at POD 7 with quantification right (*p < 0.05). F. Schematic of CXCL2 receptor inhibitor (CXCR2i) treatment experiment. G. H&E analysis of unwounded, PBS-, and CXCR2i-treated wounds at POD 7 (n=3 wounds). (Yellow dotted lines show wound borders) H. Representative Picrosirius red analysis of unwounded, PBS-, and CXCR2i-treated wounds at POD 7 and UMAP quantification right. Scale bar; A, 150 μm, B, 250 μm, C, 40 μm. See also Figs. S5,S6.

References

    1. Bayat A, McGrouther DA, and Ferguson MW (2003). Skin scarring. BMJ 326, 88–92. 10.1136/bmj.326.7380.88. - DOI - PMC - PubMed
    1. desJardins-Park HE, Gurtner GC, Wan DC, and Longaker MT (2022). From Chronic Wounds to Scarring: The Growing Health Care Burden of Under- and Over-Healing Wounds. Adv Wound Care (New Rochelle) 11, 496–510. 10.1089/wound.2021.0039. - DOI - PMC - PubMed
    1. Clark LD, Clark RK, and Heber-Katz E (1998). A new murine model for mammalian wound repair and regeneration. Clin Immunol Immunopathol 88, 35–45. 10.1006/clin.1998.4519. - DOI - PubMed
    1. Heydemann A (2012). The super super-healing MRL mouse strain. Front Biol (Beijing) 7, 522–538. 10.1007/s11515-012-1192-4. - DOI - PMC - PubMed
    1. Blankenhorn EP, Bryan G, Kossenkov AV, Clark LD, Zhang XM, Chang C, Horng W, Pletscher LS, Cheverud JM, Showe LC, and Heber-Katz E (2009). Genetic loci that regulate healing and regeneration in LG/J and SM/J mice. Mamm Genome 20, 720–733. 10.1007/s00335-009-9216-3. - DOI - PMC - PubMed

Publication types

LinkOut - more resources