

Ceramide synthase 6 (CerS6) is upregulated in alcohol-associated liver disease and exhibits sex-based differences in the regulation of energy homeostasis and lipid droplet accumulation
- PMID: 37714377
- PMCID: PMC10561121
- DOI: 10.1016/j.molmet.2023.101804
Ceramide synthase 6 (CerS6) is upregulated in alcohol-associated liver disease and exhibits sex-based differences in the regulation of energy homeostasis and lipid droplet accumulation
Abstract
Objective: Alcohol-associated liver disease (ALD) is the leading cause of liver-related mortality worldwide. Current strategies to manage ALD focus largely on advanced stage disease, however, metabolic changes such as glucose intolerance are apparent at the earliest stage of alcoholic steatosis and increase the risk of disease progression. Ceramides impair insulin signaling and accumulate in ALD, and metabolic pathways involving ceramide synthase 6 (CerS6) are perturbed in ALD during hepatic steatosis. In this study, we aimed to investigate the role of CerS6 in ALD development and the relevance of CerS6 to human ALD.
Methods: C57BL/6 WT and CerS6 KO mice of both sexes were fed either a Lieber-DeCarli control (CON) or 15% ethanol (EtOH) diet for six weeks. In vivo metabolic tests including glucose and insulin tolerance tests (GTT and ITT) and energy expenditure were performed. The mice were euthanized, and serum and liver lipids and liver histology were examined. For in vitro studies, CerS6 was deleted in human hepatocytes, VL17A and cells were incubated with EtOH and/or C16:0-ceramides. RNAseq analysis was performed in livers from mice and human patients with different stages of ALD and diseased controls.
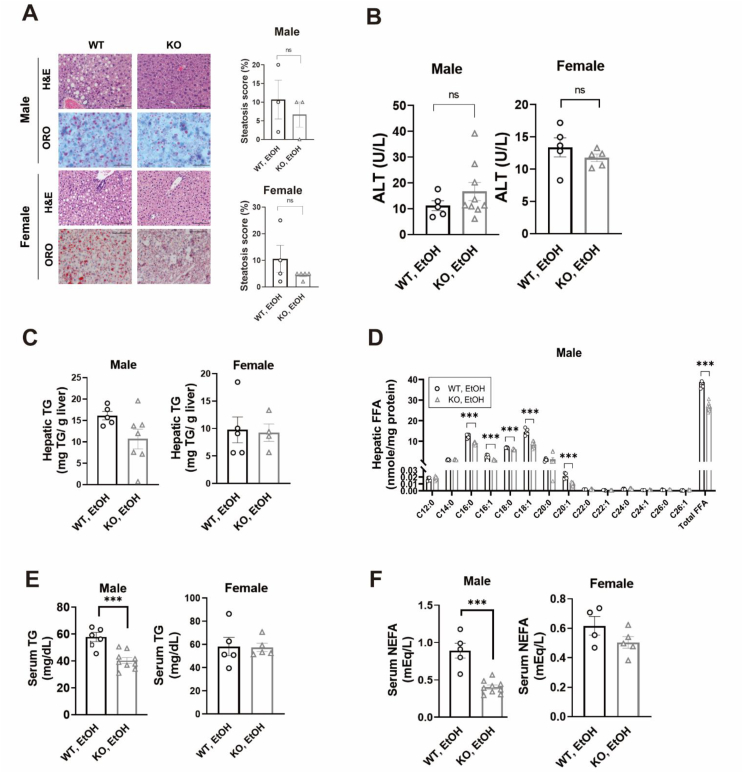
Results: After six weeks on an EtOH diet, CerS6 KO mice had reduced body weight, food intake, and %fat mass compared to WT mice. Energy expenditure increased in both male and female KO mice, however, was only statistically significant in male mice. In response to EtOH, WT mice developed mild hepatic steatosis, while steatosis was ameliorated in KO mice as determined by H&E and ORO staining. KO mice showed significantly decreased long-chain ceramide species, especially C16:0-ceramides, in the serum and liver tissues compared to WT mice. CerS6 deletion decreased serum TG and NEFA only in male not female mice. CerS6 deletion improved glucose tolerance and insulin resistance in EtOH-fed mice of both sexes. RNAseq analysis revealed that 74 genes are significantly upregulated and 66 genes are downregulated by CerS6 deletion in EtOH-fed male mice, with key network pathways including TG biosynthetic process, positive regulation of lipid localization, and fat cell differentiation. Similar to RNAseq results, absence of CerS6 significantly decreased mRNA expression of lipid droplet associated proteins in EtOH-fed mice. In vitro, EtOH stimulation significantly increased PLIN2 protein expression in VL17A cells while CerS6 deletion inhibited EtOH-mediated PLIN2 upregulation. C16:0-ceramide treatment significantly increased PLIN2 protein expression compared to CON. Notably, progression of ALD in humans was associated with increased hepatic CerS6 expression.
Conclusions: Our findings demonstrate that CerS6 deletion improves glucose homeostasis in alcohol-fed mice and exhibits sex-based differences in the attenuation of EtOH-induced weight gain and hepatic steatosis. Additionally, we unveil that CerS6 plays a major role as a regulator of lipid droplet biogenesis in alcohol-induced intra-hepatic lipid droplet formation, identifying it as a putative target for early ALD management.
Keywords: Alcohol-associated liver disease; CerS6; Ceramide; Insulin resistance; perilipin2.
Copyright © 2023 The Authors. Published by Elsevier GmbH.. All rights reserved.
Conflict of interest statement
Declaration of Competing Interest RC receives research support from Intercept Pharmaceuticals and Merck, Inc.
Figures


Similar articles
-
Absence of perilipin 2 prevents hepatic steatosis, glucose intolerance and ceramide accumulation in alcohol-fed mice.PLoS One. 2014 May 15;9(5):e97118. doi: 10.1371/journal.pone.0097118. eCollection 2014. PLoS One. 2014. PMID: 24831094 Free PMC article.
-
A novel role for ceramide synthase 6 in mouse and human alcoholic steatosis.FASEB J. 2018 Jan;32(1):130-142. doi: 10.1096/fj.201601142R. Epub 2017 Sep 1. FASEB J. 2018. PMID: 28864659 Free PMC article.
-
Temporal effects of ethanol consumption on energy homeostasis, hepatic steatosis, and insulin sensitivity in mice.Alcohol Clin Exp Res. 2013 Jul;37(7):1091-9. doi: 10.1111/acer.12075. Epub 2013 Feb 7. Alcohol Clin Exp Res. 2013. PMID: 23398239 Free PMC article.
-
Drinks like a fish: using zebrafish to understand alcoholic liver disease.Alcohol Clin Exp Res. 2011 May;35(5):826-9. doi: 10.1111/j.1530-0277.2010.01407.x. Epub 2011 Feb 1. Alcohol Clin Exp Res. 2011. PMID: 21284674 Free PMC article. Review.
-
The Role of Ceramide in the Pathogenesis of Alcoholic Liver Disease.Alcohol Alcohol. 2016 May;51(3):251-7. doi: 10.1093/alcalc/agv119. Epub 2015 Oct 28. Alcohol Alcohol. 2016. PMID: 26511776 Review.
Cited by
-
Common Bean Suppresses Hepatic Ceramide Metabolism in a Mouse Model of Metabolic Dysfunction-Associated Steatotic Liver Disease.Nutrients. 2024 Sep 21;16(18):3196. doi: 10.3390/nu16183196. Nutrients. 2024. PMID: 39339796 Free PMC article.
-
Ceramide kinase suppresses ferroptosis and protects against alcohol-associated liver disease through the p38 MAPK-HSPB1 pathway.Hepatol Commun. 2025 Jun 19;9(7):e0731. doi: 10.1097/HC9.0000000000000731. eCollection 2025 Jul 1. Hepatol Commun. 2025. PMID: 40536506 Free PMC article.
-
Transcriptomics, lipidomics, and single-nucleus RNA sequencing integration: exploring sphingolipids in MASH-HCC progression.Cell Biosci. 2025 Mar 8;15(1):34. doi: 10.1186/s13578-025-01362-5. Cell Biosci. 2025. PMID: 40057751 Free PMC article.
References
-
- Andersen B.N., Hagen C., Faber O.K., Lindholm J., Boisen P., Worning H. Glucose tolerance and B cell function in chronic alcoholism: its relation to hepatic histology and exocrine pancreatic function. Metab Clin Exp. 1983;32(11):1029–1032. - PubMed
-
- Scorletti E., Carr R.M. A new perspective on NAFLD: focusing on lipid droplets. J Hepatol. 2022;76(4):934–945. - PubMed
MeSH terms
Substances
Grants and funding
LinkOut - more resources
Full Text Sources
Medical
Molecular Biology Databases
Research Materials
Miscellaneous
