

Gut microbiome is associated with asthma and race in children with food allergy
- PMID: 37714436
- PMCID: PMC10872992
- DOI: 10.1016/j.jaci.2023.07.024
Gut microbiome is associated with asthma and race in children with food allergy
Abstract
Background: The composition of the gut microbiome has been associated with development of atopic conditions such as food allergy (FA) and asthma. African American or Black children with FA have higher rate of asthma compared to their White counterparts.
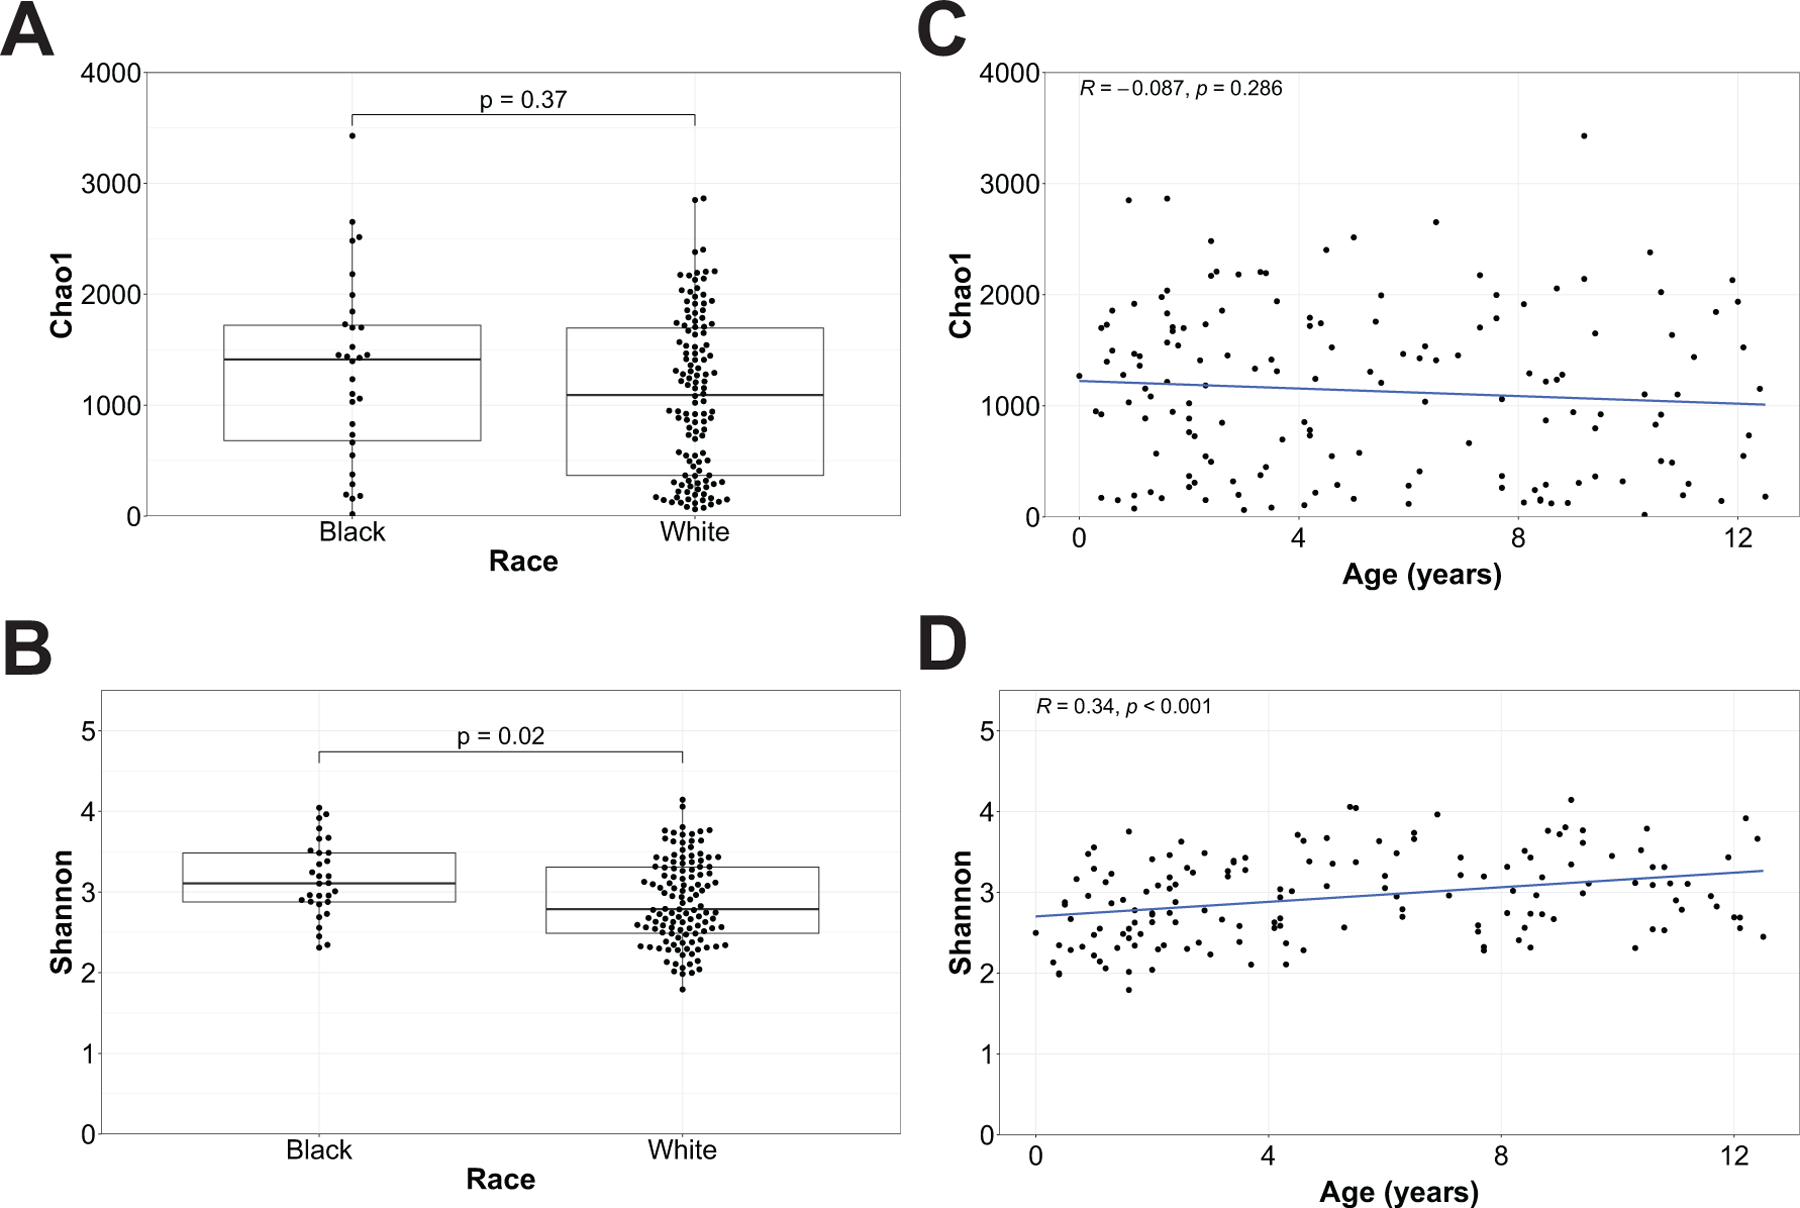
Objective: We sought to investigate whether the diversity and relative abundance (RA) of gut microbiota is different between children with FA from different racial backgrounds living in the same cities. Furthermore, we aimed to understand whether the difference in the gut microbiota is associated with asthma in children with FA.
Methods: We analyzed and compared the stool microbiome of a cohort of Black and White children with FA by shotgun genomic sequencing.
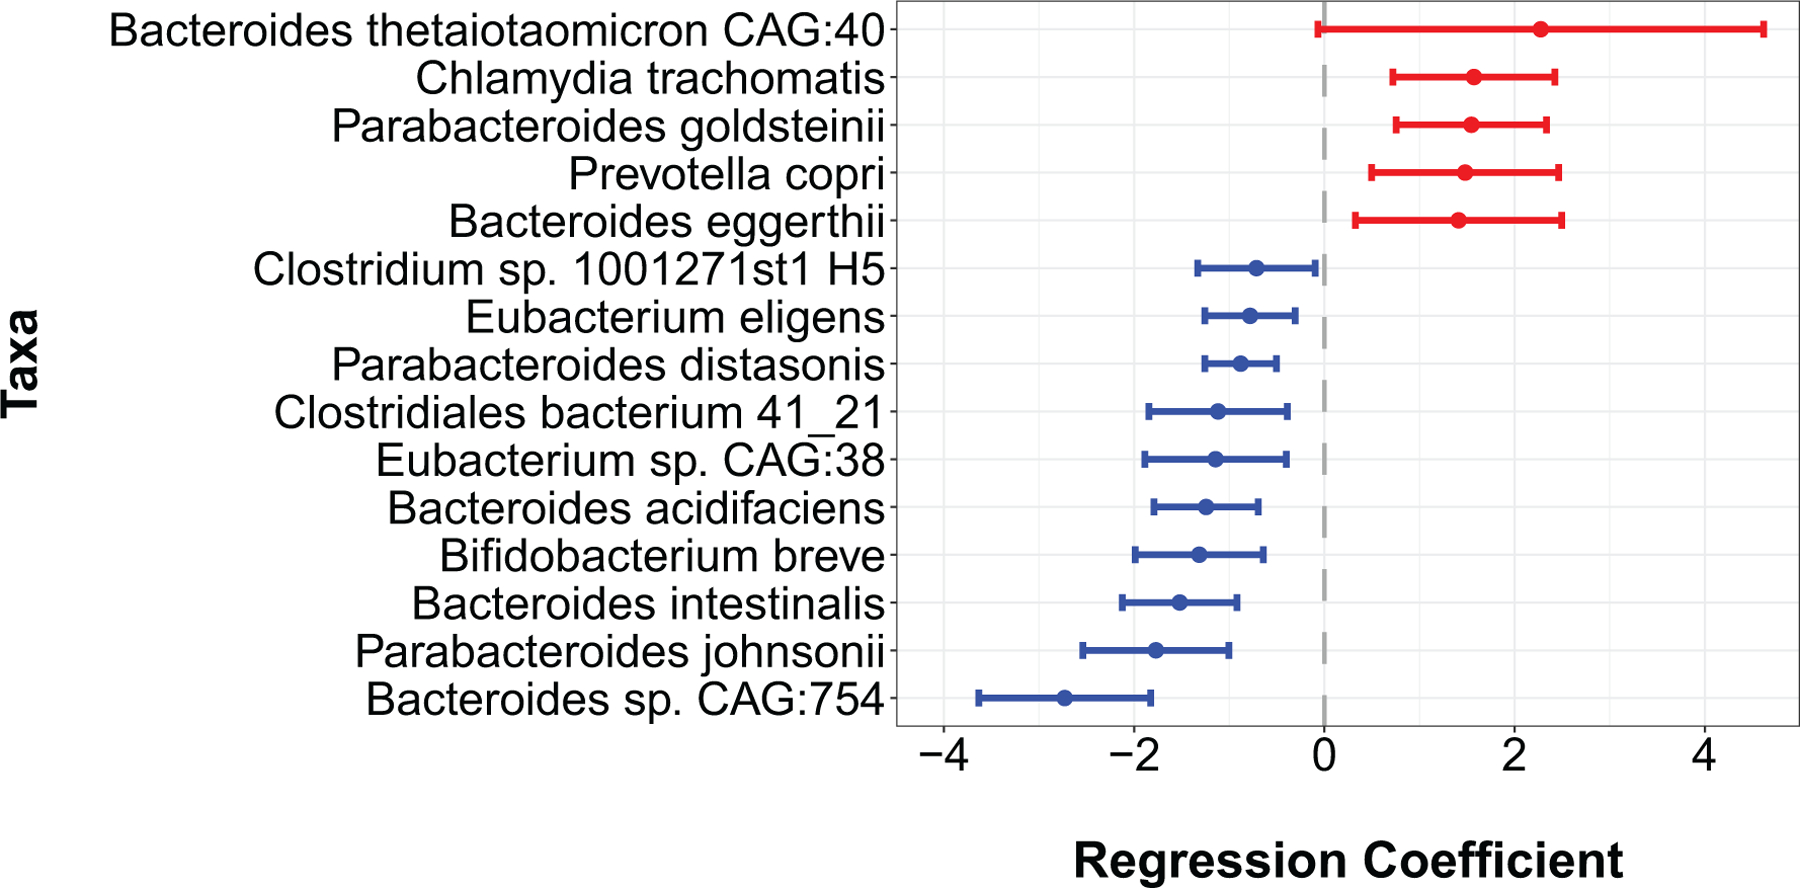
Results: A total of 152 children with IgE-mediated FA enrolled onto FORWARD (Food Allergy Outcomes Related to White and African American Racial Differences); 30 Black and 122 White children were included. The RA of several bacteria was associated with race and asthma. Most notably the RA of Bacteroides thetaiotaomicron, Chlamydia thrachomatis, Parabacteroides goldsteinii, and Bacteroides eggerthii were significantly higher, while the RA of Bifidobacterium sp CAG:754, Parabacterium johnsonii, Bacteroides intestinalis, and Bifidobacterium breve were significantly lower in stool samples of Black children compared to White children. Asthma was associated with lower RA of B breve, Bifidobacterium catenulatum, Prevotella copri, Veilloella sp CAG:933, and Bacteroides plebius, and higher RA of 3 Bacteroides species.
Conclusions: The observed variations in the gut microbiota of Black and White children such as differences in the Bacteroides and Bifidobacterium species along with their association to history of asthma in our cohort is indicative of their potential role in the higher rate of asthma observed among Black children with FA.
Keywords: Black; Microbiome; asthma; food allergy; race; relative abundance (RA).
Copyright © 2023 American Academy of Allergy, Asthma & Immunology. Published by Elsevier Inc. All rights reserved.
Figures


References
-
- Jackson KD, Howie LD, Akinbami LJ. Trends in allergic conditions among children: United States, 1997–2011. NCHS Data Brief 2013(121):1–8. - PubMed
-
- Liu AH. Revisiting the hygiene hypothesis for allergy and asthma. J Allergy Clin Immunol 2015;136(4):860–5. - PubMed
-
- Bjorksten B, Sepp E, Julge K, Voor T, Mikelsaar M. Allergy development and the intestinal microflora during the first year of life. J Allergy Clin Immunol 2001;108(4):516–20. - PubMed
Publication types
MeSH terms
Grants and funding
LinkOut - more resources
Full Text Sources
Medical
