Review
. 2023 Oct:183:81-97.
doi: 10.1016/j.yjmcc.2023.09.001. Epub 2023 Sep 14.

A cardiac amino-terminal GRK2 peptide inhibits insulin resistance yet enhances maladaptive cardiovascular and brown adipose tissue remodeling in females during diet-induced obesity

Affiliations
Review

A cardiac amino-terminal GRK2 peptide inhibits insulin resistance yet enhances maladaptive cardiovascular and brown adipose tissue remodeling in females during diet-induced obesity

Iyad H Manaserh et al. J Mol Cell Cardiol. 2023 Oct.

Abstract

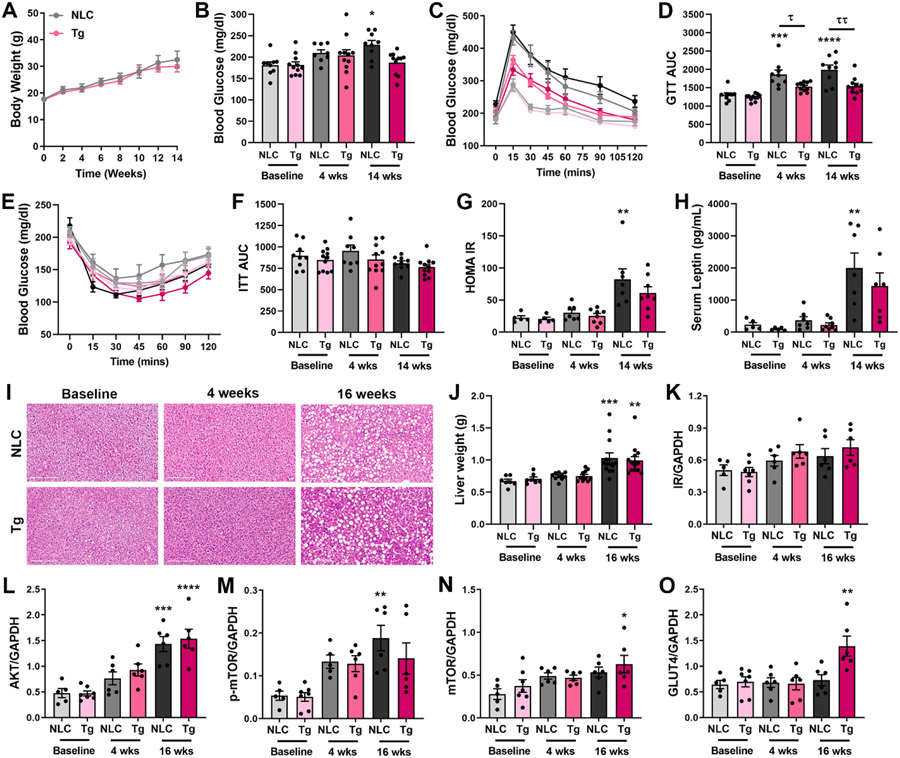
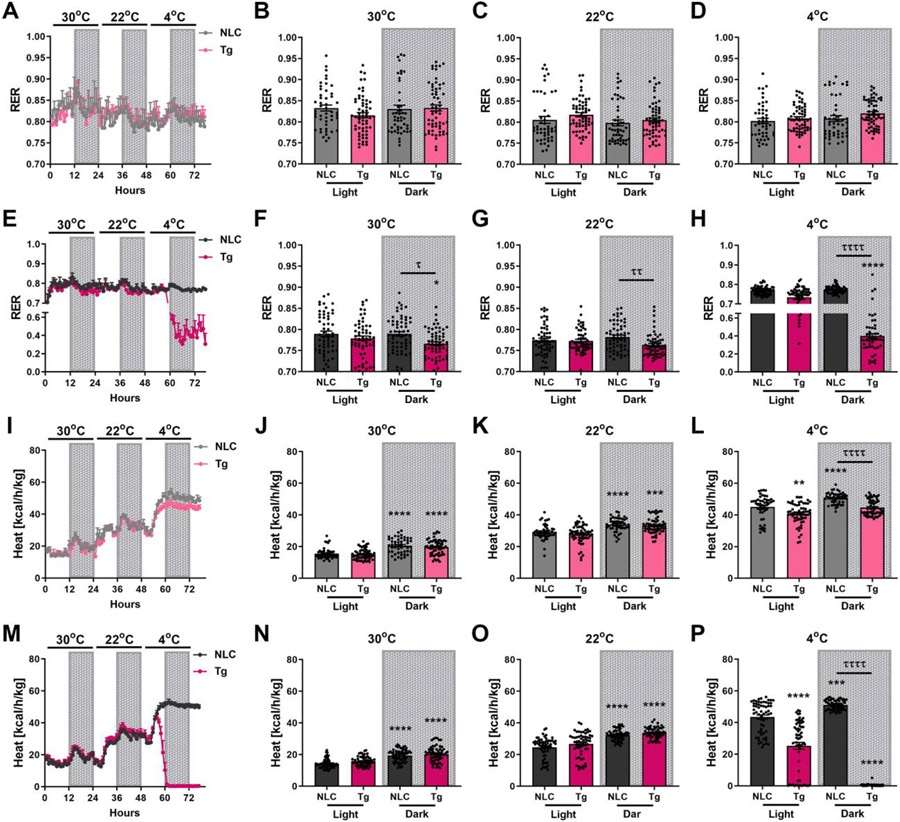
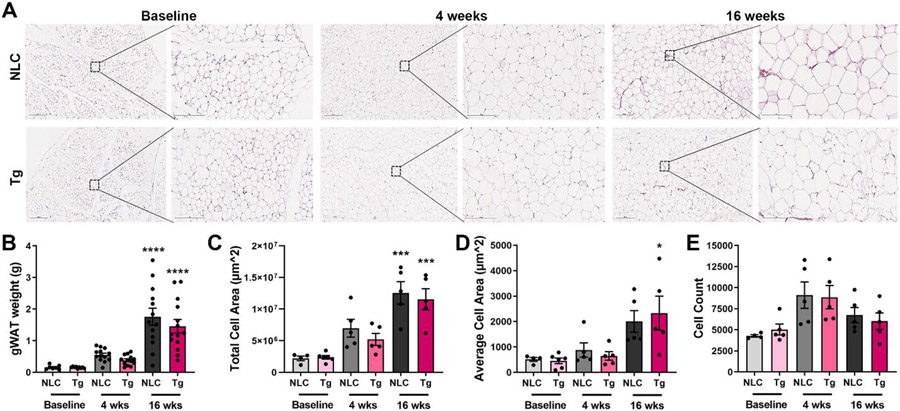
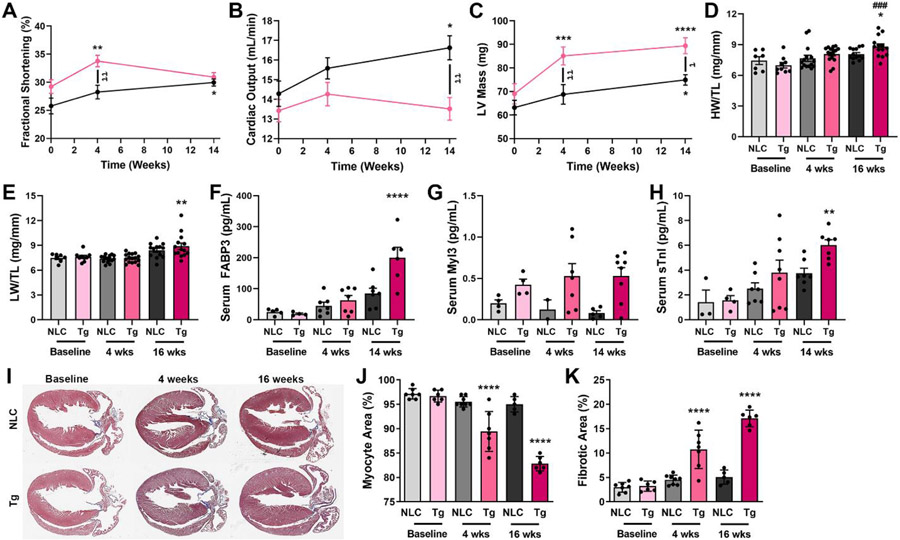
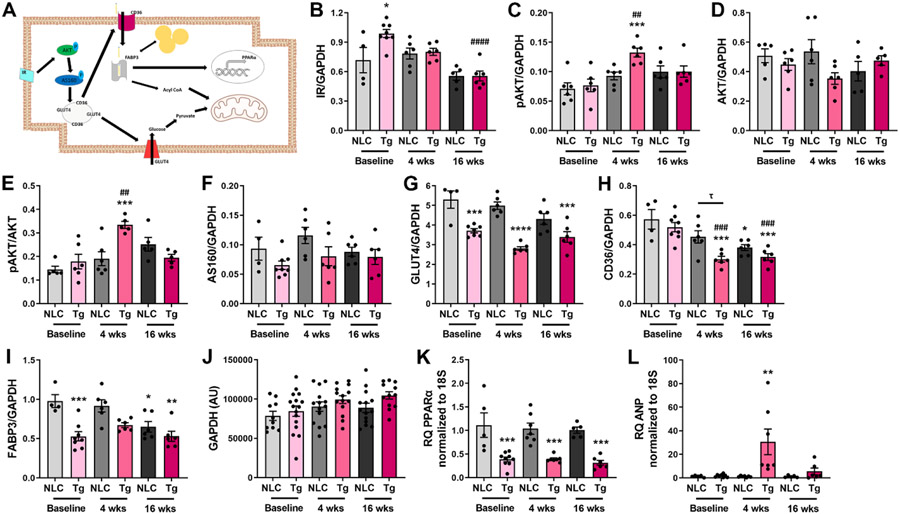
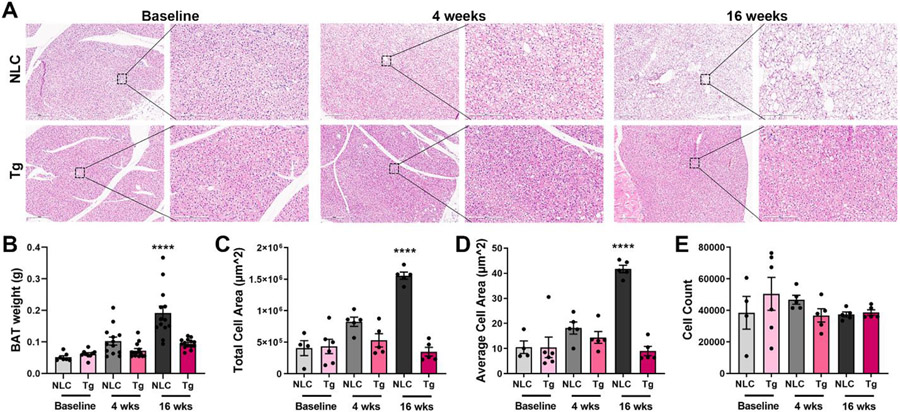
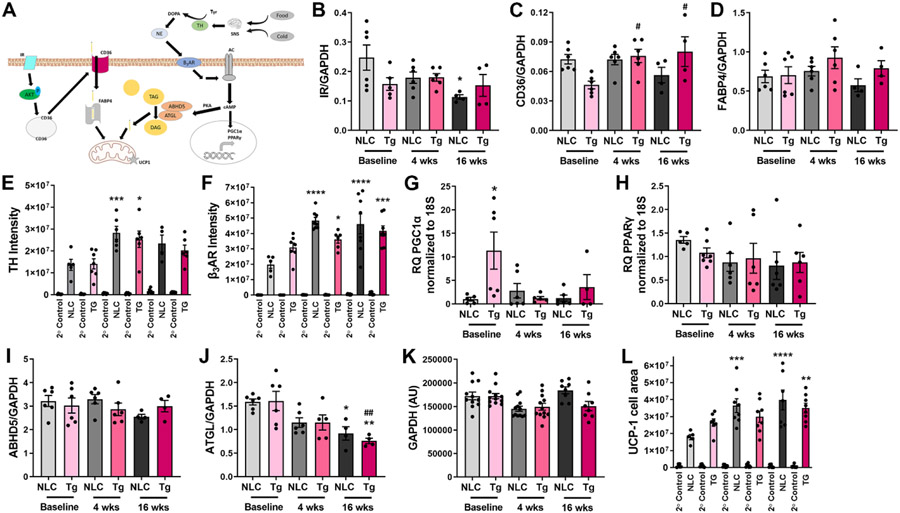
Obesity and metabolic disorders are increasing in epidemic proportions, leading to poor outcomes including heart failure. With a growing recognition of the effect of adipose tissue dysfunction on heart disease, it is less well understood how the heart can influence systemic metabolic homeostasis. Even less well understood is sex differences in cardiometabolic responses. Previously, our lab investigated the role of the amino-terminus of GRK2 in cardiometabolic remodeling using transgenic mice with cardiac restricted expression of a short peptide, βARKnt. Male mice preserved insulin sensitivity, enhanced metabolic flexibility and adipose tissue health, elicited cardioprotection, and improved cardiac metabolic signaling. To examine the effect of cardiac βARKnt expression on cardiac and metabolic function in females in response to diet-induced obesity, we subjected female mice to high fat diet (HFD) to trigger cardiac and metabolic adaptive changes. Despite equivalent weight gain, βARKnt mice exhibited improved glucose tolerance and insulin sensitivity. However, βARKnt mice displayed a progressive reduction in energy expenditure during cold challenge after acute and chronic HFD stress. They also demonstrated reduced cardiac function and increased markers of maladaptive remodeling and tissue injury, and decreased or aberrant metabolic signaling. βARKnt mice exhibited reduced lipid deposition in the brown adipose tissue (BAT), but delayed or decreased markers of BAT activation and function suggested multiple mechanisms contributed to the decreased thermogenic capacity. These data suggest a non-canonical cardiac regulation of BAT lipolysis and function that highlights the need for studies elucidating the mechanisms of sex-specific responses to metabolic dysfunction.

Keywords: Lipolysis; Metabolism; Obesity; Thermogenesis.


Conflict of interest statement

Declaration of Competing Interest The authors declare no competing interests.

Figures

Figure 1:
Figure 1:. Despite a comparable increase in body weight, TgβARKnt mice exhibit improved glucose tolerance, enhanced insulin and leptin sensitivity, and similar liver remodeling after HFD stress.
(A) Body weight (BW) in non-transgenic littermate control (NLC) and transgenic (Tg) βARKnt mice at baseline, 2-14 weeks (wks) after high fat diet (HFD) (n = 9-11 per group). (B) Blood glucose levels prior to intraperitoneal (IP) injection (n = 8-11 per group). (C) Glucose tolerance test (GTT) measurements of blood glucose levels after IP injection of 2g/kg per BW of a sterile dextrose solution. (D) Area under curve (AUC) measurements of GTT (n = 8-11 per group). (E) Insulin tolerance test (ITT) measurements of blood glucose levels after IP insulin injection of 0.75U/kg per BW recombinant human insulin. (F) Area under curve (AUC) measurements of ITT (n = 8-11 per group). (G) Homeostasis assessment model of insulin resistance (HOMA-IR) score (n = 5-8 per group). (H) Quantification of serum leptin levels from these mice (n = 5-8 per group). (I) Representative images of H&E stained liver tissue samples from NLC and TgβARKnt mice at baseline, 4 weeks and 16 weeks after HFD (scale bar: 200 μm; magnification: 20X). (J) Liver weight at baseline, 4 and 16 weeks after HFD (n = 7-14 per group). Quantification of (K) insulin receptor (IR), (L) total AKT, (M) phosphorylated mTOR (p-mTOR), (N) total mTOR, and (O) GLUT4 normalized to GAPDH in NLC and TgβARKnt liver tissue lysates at baseline, 4 or 16 weeks (wks) after HFD (n = 5-7 per group from 6 Western blots). *p <0.05; **p <0.01; ***p <0.001; ****p <0.0001 by one-way ANOVA with repeated measures and Tukey post-hoc test relative to corresponding NLC baseline. τp <0.05; ττp <0.01 by one-way ANOVA with repeated measures and Tukey post-hoc test relative to corresponding NLC 4 or 14 weeks post HFD.
Figure 2:
Figure 2:. TgβARKnt mice demonstrate an impaired cold-induced thermogenic response during acute, and more so, chronic HFD stress.
Mice were fed ad libitum and subjected to indirect calorimetry analysis to assess light and dark cycles of (A) Respiratory exchange ratio (RER) in NLC and TgβARKnt mice after 5 weeks of HFD. Values represent measurements of 3 consecutive days (n = 4-5 per group). Quantitative measurements of RER in these mice at (B) 30°C, (C) room temperature (22°C), and (D) 4°C. (E) RER in NLC and TgβARKnt mice after 15 weeks of HFD. Values represent measurements of 3 consecutive days (n = 4-5 per group). Quantitative measurements of RER in these mice at (F) 30°C, (G) room temperature (22°C), and (H) 4°C. (I) Heat production in NLC and TgβARKnt mice after 5 weeks of HFD. Values represent measurements of 3 consecutive days (n = 4-5 per group). Quantitative measurements of heat production in these mice at (J) 30°C, (K) room temperature (22°C), and (L) 4°C. (M) Heat production in NLC and TgβARKnt mice after 15 weeks of HFD. Values represent measurements of 3 consecutive days (n = 4-5 per group). Quantitative measurements of heat production in these mice at (N) 30°C, (O) room temperature (22°C), and (P) 4°C. *p <0.05; **p <0.01; ***p <0.001; ****p <0.0001 by one-way ANOVA with repeated measures and Tukey post-hoc test relative to corresponding NLC light phase at 5 or 15 weeks. τp <0.05; ττp <0.01; ττττp <0.0001 by one-way ANOVA with repeated measures and Tukey post-hoc test relative to corresponding NLC dark phase at 5 or 15 weeks post HFD.
Figure 3:
Figure 3:. TgβARKnt mice display no difference in gonadal white adipose tissue hypertrophy during HFD stress.
(A) Representative images of H&E stained gonadal white adipose tissues (gWAT) from NLC and TgβARKnt mice at baseline, 4 weeks (wks) and 16 weeks after HFD (scale bar: 500 μm [left], 200 μm [right]; magnification: 5x [left], 20x [right]). (B) gWAT weight at baseline, 4 and 16 weeks after HFD (n = 7-14 per group). Quantification of (C) total cell area, (D) average cell area, and (E) cell count in these mice at baseline, 4 and 16 weeks after HFD (n = 4-6 per group). *p <0.05; ***p <0.001; ****p <0.0001 by one-way ANOVA with Tukey post-hoc test relative to corresponding NLC baseline.
Figure 4:
Figure 4:. TgβARKnt hearts exhibit reduced function, and enhanced markers of tissue injury and maladaptive remodeling following HFD stress.
Measures of (A) fractional shortening, (B) cardiac output, and (C) left ventricular (LV) mass from NLC and TgβARKnt mice at baseline, 4 and 16 weeks (wks) after HFD (n = 9-11 per group). Measures of (D) heart weight (HW) normalized to tibia length (TL) (HW/TL), and (E) lung weight (LW) normalized to TL (LW/TL) from these mice (n = 7-16 per group). Serum measures of (F) fatty acid binding protein 3 (FABP3), (G) myosin essential light chain (Myl3), and (H) skeletal troponin I (sTnI) from NLC and TgβARKnt mice at baseline, 4 and 14 weeks (wks) after HFD (n = 3-8 per group). (I) Representative images of Masson trichrome-stained heart sections in these mice. Quantification of (J) myocyte area percentage, and (K) fibrotic area percentage from NLC and TgβARKnt hearts at baseline, 4 weeks and 16 weeks after HFD (n = 5-8 per group). *p <0.05; **p <0.01; ***p <0.001; ****p <0.0001 by two-way ANOVA with repeated measures (A-C) or one-way ANOVA (D-K) with Tukey post-hoc test relative to corresponding NLC baseline. ###p <0.001 by one-way ANOVA with Tukey post-hoc test relative to corresponding Tg baseline post HFD. τp <0.05; ττp <0.01 by two-way ANOVA with repeated measures and Bonferroni post-hoc test relative to corresponding NLC at 4 or 14 weeks post HFD.
Figure 5:
Figure 5:. Interrogation of cardiac metabolic signaling pathways demonstrated reduced or aberrant activation in TgβARKnt cardiomyocytes during HFD stress.
(A) Schematic diagram of key regulators of cardiomyocyte metabolic signaling. Quantification of (B) insulin receptor (IR), (C) phosphorylated AKT (pAKT), (D) total AKT, (E) pAKT normalized to total AKT, (F) AS160, (G) GLUT4, (H) CD36, (I) FABP3, and (J) GAPDH in NLC and TgβARKnt ventricular tissue at baseline, 4 or 16 weeks (wks) after HFD (n = 4-8 per group from 6 Western blots). All data are normalized to GAPDH within their respective blot prior to or after normalization to total protein levels, as appropriate. Quantification of RT-PCR data in ventricular tissue in these mice showing fold change (RQ = 2−ΔΔCt) in mRNA expression of (K) PPARα, and (L) ANP (n = 5-9 per group). *p <0.05; **p <0.01; ***p <0.001; ****p <0.0001 by one-way ANOVA with Tukey post-hoc test relative to corresponding NLC baseline. ##p <0.01; ###p <0.001; ####p <0.0001 by one-way ANOVA with Tukey post-hoc test relative to corresponding Tg baseline post HFD. τp <0.05; by one-way ANOVA with Tukey post-hoc test relative to corresponding NLC at 4 weeks post HFD.
Figure 6:
Figure 6:. TgβARKnt mice show preserved brown adipose tissue morphology with reduced cell size after HFD stress.
(A) Representative images of H&E stained brown adipose tissues (BAT) from NLC and TgβARKnt mice at baseline, 4 weeks (wks) and 16 weeks after HFD (scale bar: 500 μm [left], 200 μm [right]; magnification: 5x [left], 20x [right]). (B) BAT weight at baseline, 4 and 16 weeks after HFD (n = 7-14 per group). Quantification of (C) total cell area, (D) average cell area, and (E) cell count in these mice at baseline, 4 and 16 weeks after HFD (n = 4-6 per group). ****p <0.0001 by one-way ANOVA with Tukey post-hoc test relative to corresponding NLC baseline.
Figure 7:
Figure 7:. TgβARKnt BAT exhibits altered metabolic signaling and markers of lipolysis and thermogenic capacity during HFD stress.
(A) Schematic diagram of key regulators of brown adipocyte metabolic signaling and lipolysis. Quantification of (B) insulin receptor (IR), (C) CD36, and (D) FABP4 in NLC and TgβARKnt BAT tissue at baseline, 4 weeks or 16 weeks (wks) after HFD (n = 4-6 per group from 5 Western blots). All data are normalized to GAPDH within their respective blot. Quantification of (E) TH intensity and (F) β3AR intensity in these mice at baseline, 4 and 16 weeks after HFD (n = 4-8 per group). Quantification of RT-PCR data in BAT in these mice showing fold change (RQ = 2−ΔΔCt) in mRNA expression of (G) PGC1α, and (H) PPARγ (n = 4-7 per group). Quantification of (I) ABHD5, (J) ATGL, and (K) GAPDH in these mice at baseline, 4 weeks or 16 weeks after HFD (n = 4-6 per group from 5 Western blots). Quantification of (L) UCP-1 cell area in these mice at baseline, 4 and 16 weeks after HFD (n = 5-8 per group). *p <0.05; **p <0.01; ***p <0.001; ****p <0.0001 by one-way ANOVA with Tukey post-hoc test relative to corresponding NLC baseline. #p <0.05; ##p <0.01 by one-way ANOVA with Tukey post-hoc test relative to corresponding Tg baseline post HFD.
Figure 8:
Figure 8:. Untargeted serum metabolomics demonstrates strong differences in metabolite prevalence during HFD stress.
Untargeted metabolomics analysis of NLC and TgβARKnt (TG) serum at (A) baseline, (B) 4 weeks and (C) 16 weeks of HFD stress showing (Left) orthogonal partial least squares discriminant analysis (OPLS-DA), (Middle) volcano plot analysis, and (Right) the top 15 most impacted metabolites from the multivariate analysis between NLC and TgβARKnt mice at these time points. The volcano plots show the individual statistically significant ions upregulated in the βARKnt mice compared to their respective controls depicted in red dots, and downregulated in blue dots. The x- axis represents log2 fold-change which shows the direction of the change (negative scale is downregulated and positive scale is upregulated) in metabolite levels while the y-axis is the negative log of the p-value (FDR adjusted) showing the significance of the change.

Similar articles

References

    1. Koliaki C, Liatis S, Kokkinos A, Obesity and cardiovascular disease: revisiting an old relationship, Metabolism 92 (2019) 98–107. - PubMed
    1. Arnett DK, Blumenthal RS, Albert MA, Buroker AB, Goldberger ZD, Hahn EJ, Himmelfarb CD, Khera A, Lloyd-Jones D, McEvoy JW, Michos ED, Miedema MD, Munoz D, Smith SC Jr., Virani SS, Williams KA Sr., Yeboah J, Ziaeian B, 2019 ACC/AHA Guideline on the Primary Prevention of Cardiovascular Disease: A Report of the American College of Cardiology/American Heart Association Task Force on Clinical Practice Guidelines, J Am Coll Cardiol 74(10) (2019) e177–e232. - PMC - PubMed
    1. Belkina AC, Denis GV, Obesity genes and insulin resistance, Curr Opin Endocrinol Diabetes Obes 17(5) (2010) 472–7. - PMC - PubMed
    1. Lavie CJ, McAuley PA, Church TS, Milani RV, Blair SN, Obesity and cardiovascular diseases: implications regarding fitness, fatness, and severity in the obesity paradox, J Am Coll Cardiol 63(14) (2014) 1345–54. - PubMed
    1. Lavie CJ, De Schutter A, Milani RV, Healthy obese versus unhealthy lean: the obesity paradox, Nat Rev Endocrinol 11(1) (2015) 55–62. - PubMed

Publication types

LinkOut - more resources