. 2023 Sep 15;14(1):5728.
doi: 10.1038/s41467-023-41462-9.

The lipoprotein-associated phospholipase A2 inhibitor Darapladib sensitises cancer cells to ferroptosis by remodelling lipid metabolism

Affiliations

The lipoprotein-associated phospholipase A2 inhibitor Darapladib sensitises cancer cells to ferroptosis by remodelling lipid metabolism

Mihee Oh et al. Nat Commun. .

Abstract

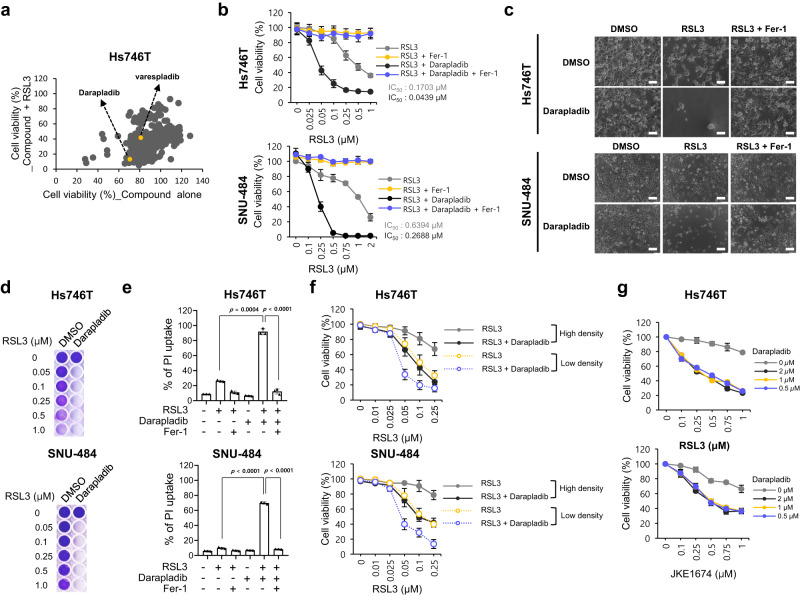
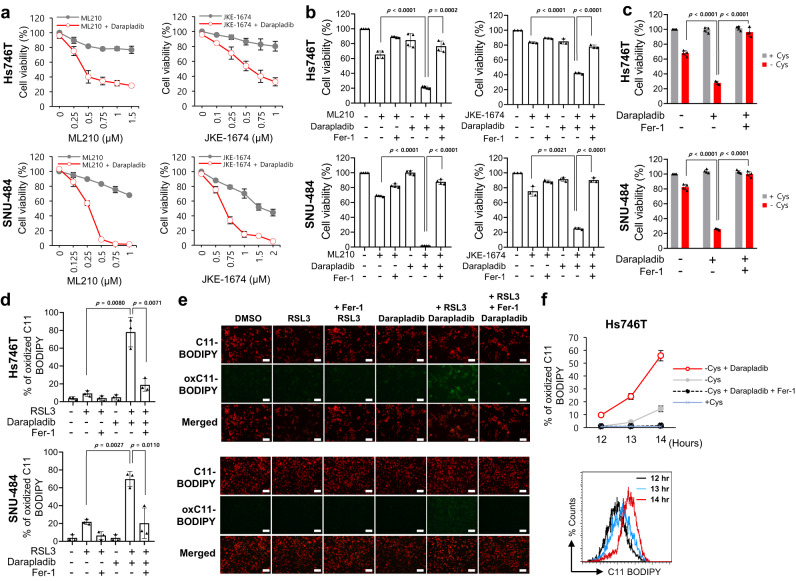
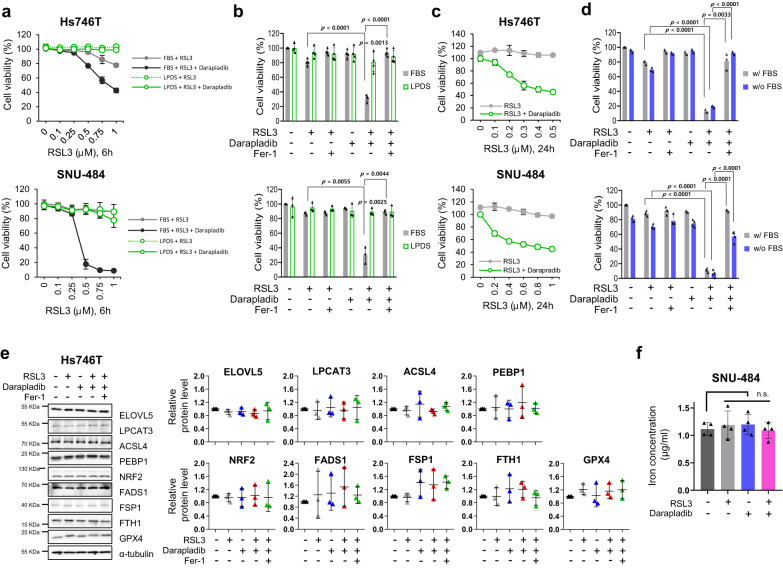
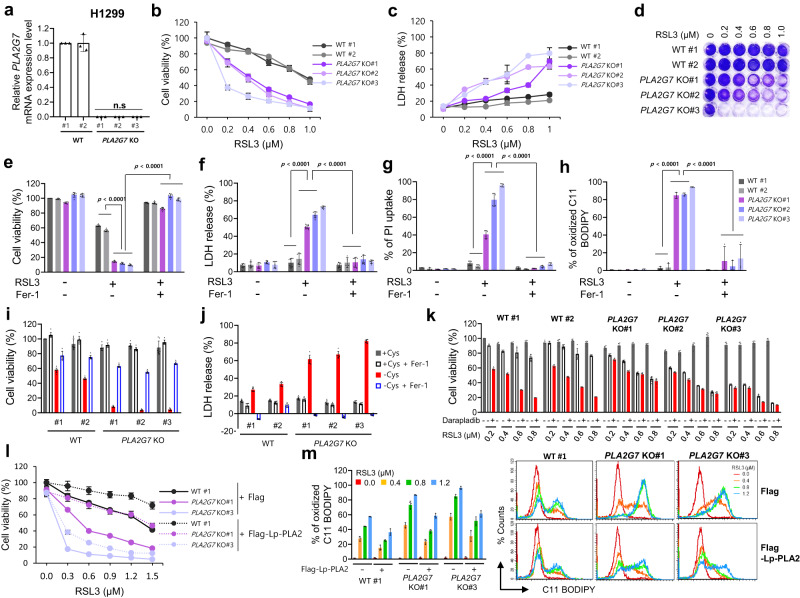
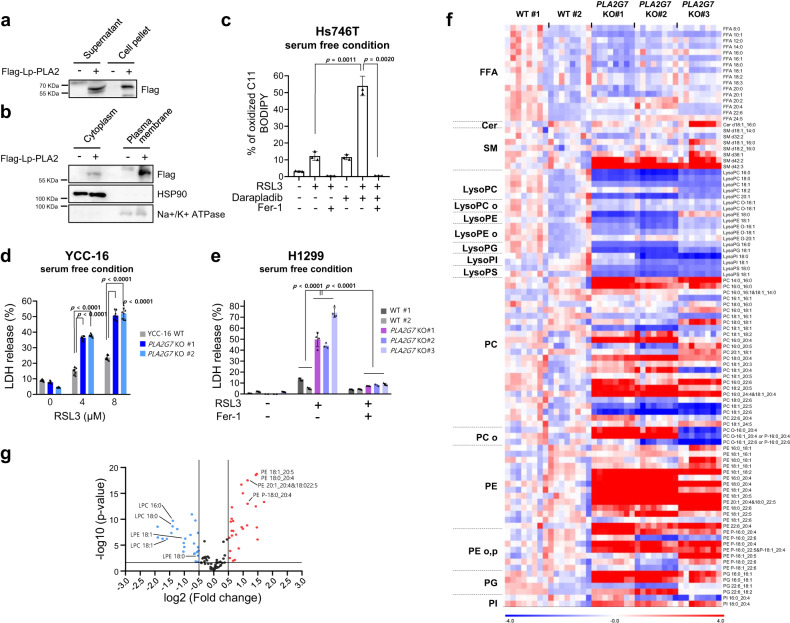
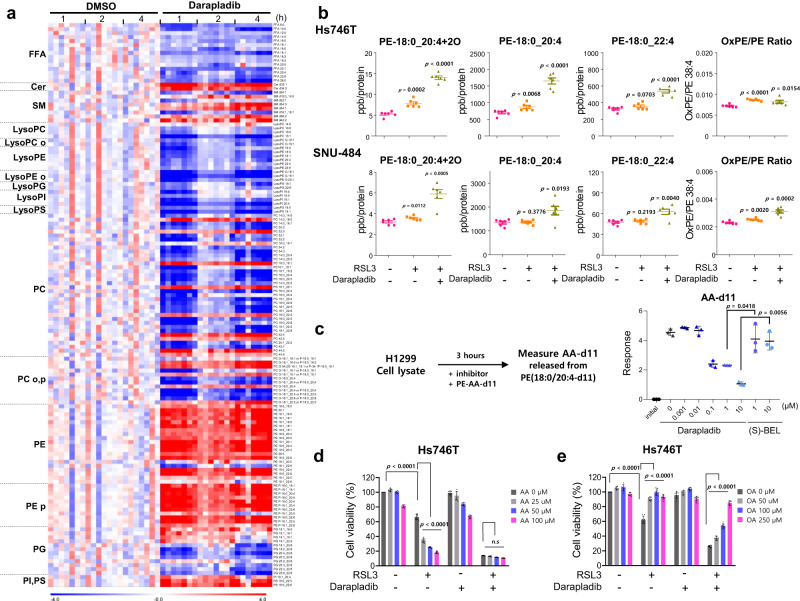
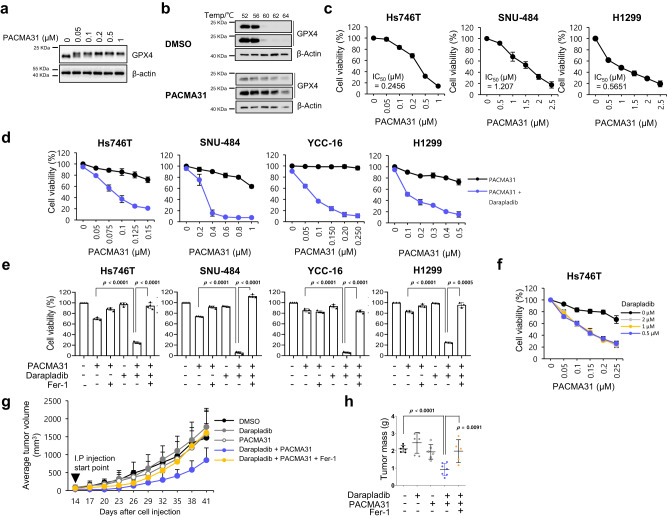
Arachidonic and adrenic acids in the membrane play key roles in ferroptosis. Here, we reveal that lipoprotein-associated phospholipase A2 (Lp-PLA2) controls intracellular phospholipid metabolism and contributes to ferroptosis resistance. A metabolic drug screen reveals that darapladib, an inhibitor of Lp-PLA2, synergistically induces ferroptosis in the presence of GPX4 inhibitors. We show that darapladib is able to enhance ferroptosis under lipoprotein-deficient or serum-free conditions. Furthermore, we find that Lp-PLA2 is located in the membrane and cytoplasm and suppresses ferroptosis, suggesting a critical role for intracellular Lp-PLA2. Lipidomic analyses show that darapladib treatment or deletion of PLA2G7, which encodes Lp-PLA2, generally enriches phosphatidylethanolamine species and reduces lysophosphatidylethanolamine species. Moreover, combination treatment of darapladib with the GPX4 inhibitor PACMA31 efficiently inhibits tumour growth in a xenograft model. Our study suggests that inhibition of Lp-PLA2 is a potential therapeutic strategy to enhance ferroptosis in cancer treatment.


Conflict of interest statement

The authors declare no competing interests.

Figures

Fig. 1
Fig. 1. Identification of darapladib as a ferroptosis-targeting drug by metabolic library screening.
a Relative viability of Hs746T cells treated with 10 μM compound alone or compound and 0.5 μM RSL3 for 24 h. b Relative viability of Hs746T and SNU-484 cells treated with increasing concentrations of RSL3 and/or 2 µM darapladib for 20 h. Cells were plated at 30,000 Hs746T cells/well and 40,000 SNU-484 cells/well in 200 μl of media. The data are presented as the means ± SDs (n = 6 independent experiments). c Images of cells treated with 0.2 μM RSL3 and/or 2 μM darapladib in the presence or absence of 1 μM Fer-1. Experiments were repeated three times. Scale bar, 200 μm. d Crystal violet staining of cells treated with RSL3 and/or 2 μM darapladib for 48 h. Cells were plated at 20,000 Hs746T cells/well and 25,000 SNU-484 cells/well in 200 μl of media. e PI uptake from Hs746T and SNU-484 cells treated with RSL3 and/or 2 μM darapladib in the presence or absence of 1 μM Fer-1 for 20 h. The data are presented as the means ± SDs (n = 3 independent experiments, the significance of the results was assessed using a two-tailed Student’s t test). f Relative viability of cells at high (30,000 Hs746T cells/well and 40,000 SNU-484 cells/well) and low (20,000 Hs746T cells/well and 25,000 SNU-484 cells/well) densities upon RSL3 and 2 μM darapladib treatment. The data are presented as the means ± SDs (Hs746T: n = 3, SNU-484: n = 4 independent experiments). g Relative viability of Hs746T cells treated with RSL3 or JKE1674 in the presence of increasing concentrations of darapladib. The data are presented as the means ± SDs (n = 3 independent experiments). Exact p values provided as source data. Source data are provided as a source data file.
Fig. 2
Fig. 2. Darapladib sensitises cells to ferroptosis induced by GPX4 inhibition or cysteine deprivation.
a Relative viability of Hs746T and SNU-484 cells treated with increasing concentrations of ML210 or JKE1674 in the presence or absence of 2 μM darapladib for 20 h. The data are presented as the means ± SDs (n = 3 or 4 independent experiments). b Relative viability of cells in the presence or absence of 1 μM Fer-1. The data are presented as the means ± SDs (n = 3 or 4 independent experiments with, the significance of the results was assessed using a two-tailed Student’s t test). c Viability of Hs746T and SNU-484 cells cultured in cysteine-deficient medium in the presence and absence of 2 μM darapladib for 18 h. The data are presented as the means ± SDs (n = 4 independent experiments with, the significance of the results was assessed using a two-tailed Student’s t test). d, e Lipid peroxidation levels in Hs746T and SNU-484 cells treated with 0.2 μM RSL3 and 2 μM darapladib for 1 h. Lipid oxidative potential was assessed by flow cytometry (d) and microscopy (e) using C11-BODIPY581/591. Probes fluorescing green represent those that have been oxidised. Experiments were repeated three times. Scale bar, 200 μm. d The data are presented as the means ± SDs (n = 3 independent experiments with, the significance of the results was assessed using a two-tailed Student’s t test). f Lipid peroxidation levels in Hs746T cells cultured in cysteine-deficient medium in the presence or absence of darapladib for 12–14 h. The data are presented as the means ± SDs (n = 3 independent experiments). Exact p values provided as source data. Source data are provided as a source data file.
Fig. 3
Fig. 3. Darapladib is able to promote ferroptosis in the absence of lipoprotein.
a, b Relative viability of Hs746T and SNU-484 cells treated with RSL3 and 2 μM darapladib cultured in medium containing FBS or LPDS for 6 h in the presence or absence of Fer-1. The data are presented as the means ± SDs (n = 3 or 4 independent experiments with, the significance of the results was assessed using a two-tailed Student’s t test). c Relative viability of cells in the indicated medium for 24 h. The data are presented as the means ± SDs (n = 3 independent experiments). d Relative viability of cells treated with RSL3 and 2 μM darapladib in the presence or absence of FBS. The data are presented as the means ± SDs (n = 3 or 4 independent experiments with, the significance of the results was assessed using a two-tailed Student’s t test). e Western blots showing the expression levels of well-known ferroptosis regulators upon 0.2 μM RSL3 and 2 μM darapladib treatment as indicated. Three blots were cut according to protein size and directed to western blotting, and reprobed to detect proteins of similar size. Each protein was normalised to α-tubulin on the same blot. Experiments were repeated three times and the data are also presented as the means ± SDs (n = 3 independent experiments). f Total iron level measured in the lysates of cells treated with 0.2 μM RSL3 and 2 μM darapladib. The data are presented as the means ± SDs (n = 4 independent experiments, with n.s. nonsignificant compared to the control with two-tailed Student’s t test). Exact p values provided as source data. Source data are provided as a source data file.
Fig. 4
Fig. 4. Lp-PLA2 negatively regulates lipid peroxidation and ferroptosis.
a Relative mRNA expression levels in WT and PLA2G7 KO H1299 cells normalised to the β-actin expression levels. The data are presented as the means ± SDs (n = 3 independent experiments with, the significance of the results was assessed using one-sided Wilcoxon rank-sum test). b, c Relative cell viability and LDH levels of WT and PLA2G7 KO H1299 cells treated with RSL3 for 20 h. The data are presented as the means ± SDs (b: n = 6, c: n = 4 independent experiments). d Crystal violet staining of WT and PLA2G7KO H1299 cells treated with various concentrations of RSL3. eg Relative cell viability, LDH levels and PI uptake of WT and PLA2G7 KO H1299 cells treated with RSL3 in the presence or absence of Fer-1 for 20 h. The data are presented as the means ± SDs (e, f: n = 8, g: n = 4, independent experiments with, the significance of the results was assessed using one-sided Wilcoxon rank-sum test). h Lipid peroxidation level of WT and PLA2G7 KO H1299 cells treated with RSL3 for 1.5 h. The data are presented as the means ± SDs (n = 3 independent experiments with, the significance of the results was assessed using one-sided Wilcoxon rank-sum test). i, j Cell viability and LDH level of WT and PLA2G7 KO H1299 cells cultured in cysteine-deficient medium for 48 h. The data are presented as the means ± SDs (i: n = 8, j: n = 7 independent experiments). k Relative cell viability of WT and PLA2G7 KO H1299 cells treated with various concentrations of RSL3 and/or 0.5 µM darapladib for 48 h. The data are presented as the means ± SDs (n = 6 independent experiments). l, m Relative viability and lipid peroxidation levels of WT and PLA2G7 KO H1299 cells ectopically expressing Lp-PLA2 and treated with RSL3. The data are presented as the means ± SDs (l: n = 5, m: 3 independent experiments). Exact p values provided as source data. Source data are provided as a source data file.
Fig. 5
Fig. 5. Intracellular Lp-PLA2 is responsible for ferroptosis suppression by regulating phospholipid compositions.
a Western blot analysis to confirm the presence of Lp-PLA2 in the pellet and supernatant after ectopic expression of Lp-PLA2 in Hs746T cells. b Western blot analysis to confirm the presence of Lp-PLA2 in the cytoplasm and plasma membrane after ectopic expression of Lp-PLA2 in Hs746T cells. c Lipid peroxidation levels in Hs746T cells treated with RSL3 and/or 2 μM darapladib for 0.5 h and cultured in FBS-deficient medium. Lipid oxidative potential was assessed by flow cytometry and microscopy using C11-BODIPY581/591. The data are presented as the means ± SDs (n = 3 independent experiments with, the significance of the results was assessed using a two-tailed Student’s t test). d, e LDH levels of WT and PLA2G7 KO cells treated with RSL3 in the absence of serum for 24 h. The data are presented as the means ± SDs (d: n = 8, e: n = 4 independent experiments with, the significance of the results was assessed using a two-tailed Student’s t test (d) or one-sided Wilcoxon rank-sum test (e)). f, g Lipidomic analysis acquired from the UPLC/QTOF MS spectra of WT and PLA2G7 KO H1299 cells. Each value in the heatmap is a coloured representation of a calculated Z score (f). Lipids are presented as the total numbers of carbon atoms, double bonds, and fatty acyl chains. n = 8 independent experiments. A volcano plot of lipid classes showing the log2(fold change) and –log10(p) values in the control versus PLA2G7 KO H1299 cells is presented (f). FFA free fatty acid, Cer ceramide, SM sphingomyelin, lysoPC lysophosphatidylcholine, lysoPE lysophosphatidylethanolamine, lysoPG lysophosphatidylglycerol, lysoPI lysophosphatidylinositol, lysoPS lysophosphatidylserine, PC phosphatidylcholine, PE phosphatidylethanolamine, PG phosphatidylglycerol, PI phosphatidylinositol, PS phosphatidylserine. Exact p values provided as source data. Source data are provided as a source data file.
Fig. 6
Fig. 6. Darapladib promotes ferroptosis by protecting against PE cleavage.
a Lipidomic analysis based on the UPLC/QTOF MS spectra of Hs746T cells treated with 2 µM darapladib for 1, 2, and 4 h as described in Fig. 5. n = 7 independent experiments. b Concentrations of oxidised PE-18:0_20:4, PE-18:0_20:4, and PE-18:0_22:4 in Hs746T cells er treatment with RSL3 and/or 2 μM darapladib for 4 h and in SNU-484 cells after treatment with RSL3 and/or 2 μM darapladib for 3 h. The ratios of oxidised to non-oxidised PE-18:0_20:4 are also shown. The concentrations were determined by LC–MS/MS and were normalised to the cellular protein level. The data are presented as the means ± SDs (n = 6 independent experiments, the significance of the results was assessed using a two-tailed Student’s t test). c PE-18:0_20:4-d11 cleavage analysis of cell lysates incubated with the indicated concentrations of darapladib and (S)-BEL for 3 h and subjected to detection of AA-d11 by LC‒MS/MS. The data are presented as the means ± SDs (n = 3 independent experiments, the significance of the results was assessed using a two-tailed Student’s t test). d, e Relative viability of Hs746T cells pretreated with AA or OA for 20 h and treated with RSL3 and/or 2 μM darapladib for 20 h. The data are presented as the means ± SDs (n = 8 independent experiments, the significance of the results was assessed using a two-tailed Student’s t test). Exact p values provided as source data. Source data are provided as a source data file.
Fig. 7
Fig. 7. Darapladib enhances the antitumour activity of PACMA31 by accelerating ferroptosis.
a Western blot showing the band shift of GPX4 after PACMA31 treatment. Experiments repeated three times. b Cellular thermal shift assay showing the thermal stabilisation of GPX4 in cells treated with PACMA31. Experiments were repeated three times. c Relative viability and IC50 value of Hs746T, SNU-484, and H1299 cells treated with PACMA31. The data are presented as the means ± SDs (Hs746T: n = 6, SNU-484: n = 4, H1299: n = 3 independent experiments). d, e Relative viability of Hs746T, SNU-484, YCC-16 and H1299 cells treated with PACMA31 and/or 2 µM darapladib in the presence or absence of Fer-1 for 20 h. The data are presented as the means ± SDs (n = 3–6 independent experiments, the significance of the results was assessed using a two-tailed Student’s t test). f Relative viability of Hs746T cells treated with PACMA31 and/or various concentrations of darapladib. The data are presented as the means ± SDs (n = 3 independent experiments). g, h SNU-484 cells were injected subcutaneously into nude mice; 14 days after inoculation, the mice were treated with 10 mg/kg PACMA31, 10 mg/kg darapladib, and 10 mg/kg fer-1 via intraperitoneal injections every 3 days as indicated. Tumour growth is shown in (g), and tumours are shown in (h). Each treatment group consisted of 5–7 mice. The data are presented as the means ± SDs, the significance of the results was assessed using a two-tailed Student’s t test). Exact p values provided as source data. Source data are provided as a source data file.

References

    1. Dixon SJ, et al. Ferroptosis: an iron-dependent form of nonapoptotic cell death. Cell. 2012;149:1060–1072. - PMC - PubMed
    1. Hassannia B, Vandenabeele P, Vanden Berghe T. Targeting ferroptosis to iron out cancer. Cancer Cell. 2019;35:830–849. - PubMed
    1. Aldrovandi M, Fedorova M, Conrad M. Juggling with lipids, a game of Russian roulette. Trends Endocrinol. Metab. 2021;32:463–473. - PubMed
    1. Ingold I, et al. Selenium utilization by GPX4 is required to prevent hydroperoxide-induced ferroptosis. Cell. 2018;172:409–422.e21. - PubMed
    1. Seiler A, et al. Glutathione peroxidase 4 senses and translates oxidative stress into 12/15-lipoxygenase dependent- and AIF-mediated cell death. Cell Metab. 2008;8:237–248. - PubMed

Publication types

MeSH terms