. 2023 Sep 15;14(1):5736.
doi: 10.1038/s41467-023-41512-2.

First fully-automated AI/ML virtual screening cascade implemented at a drug discovery centre in Africa

Affiliations

First fully-automated AI/ML virtual screening cascade implemented at a drug discovery centre in Africa

Gemma Turon et al. Nat Commun. .

Abstract

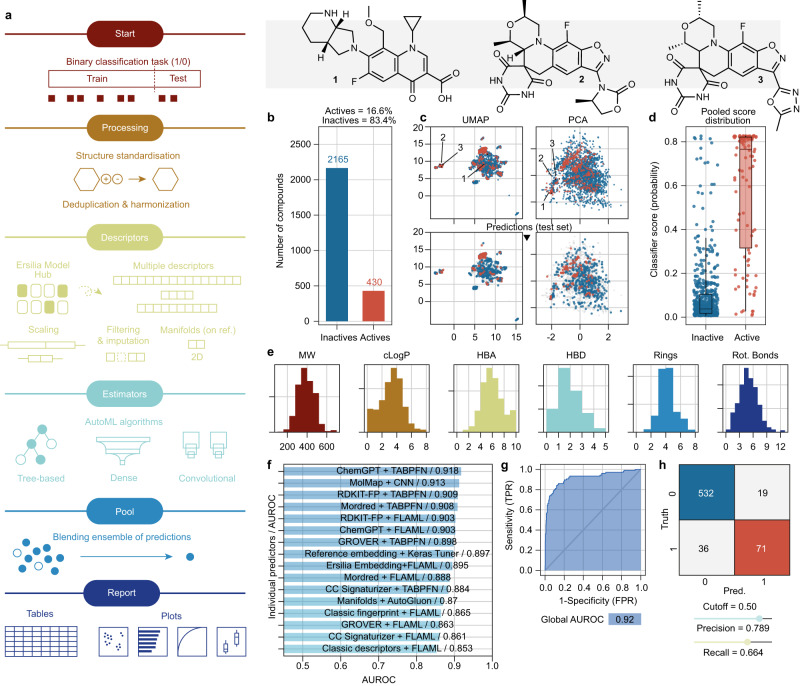
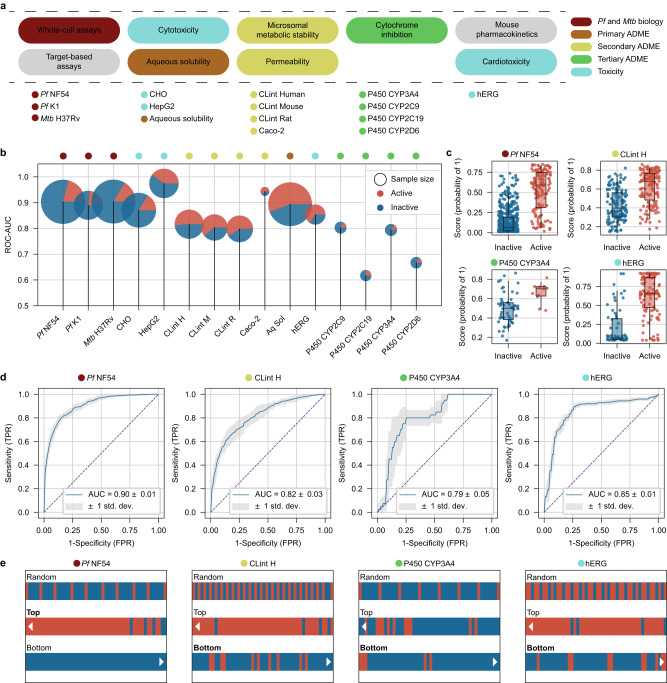
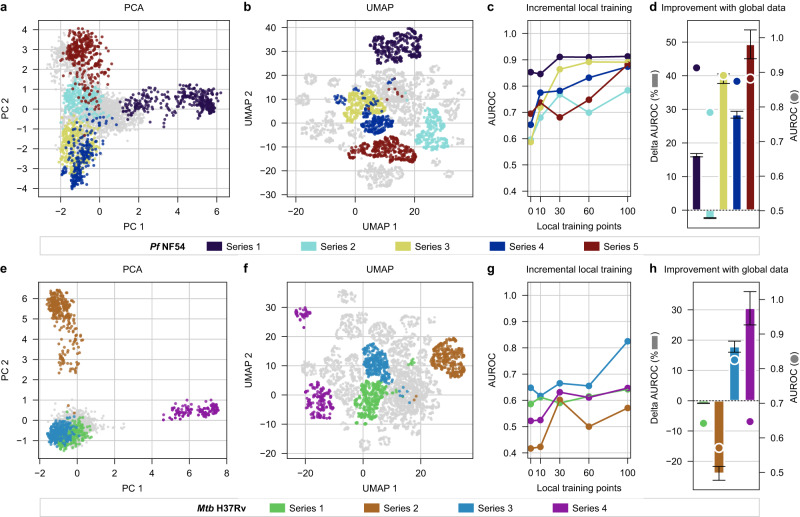
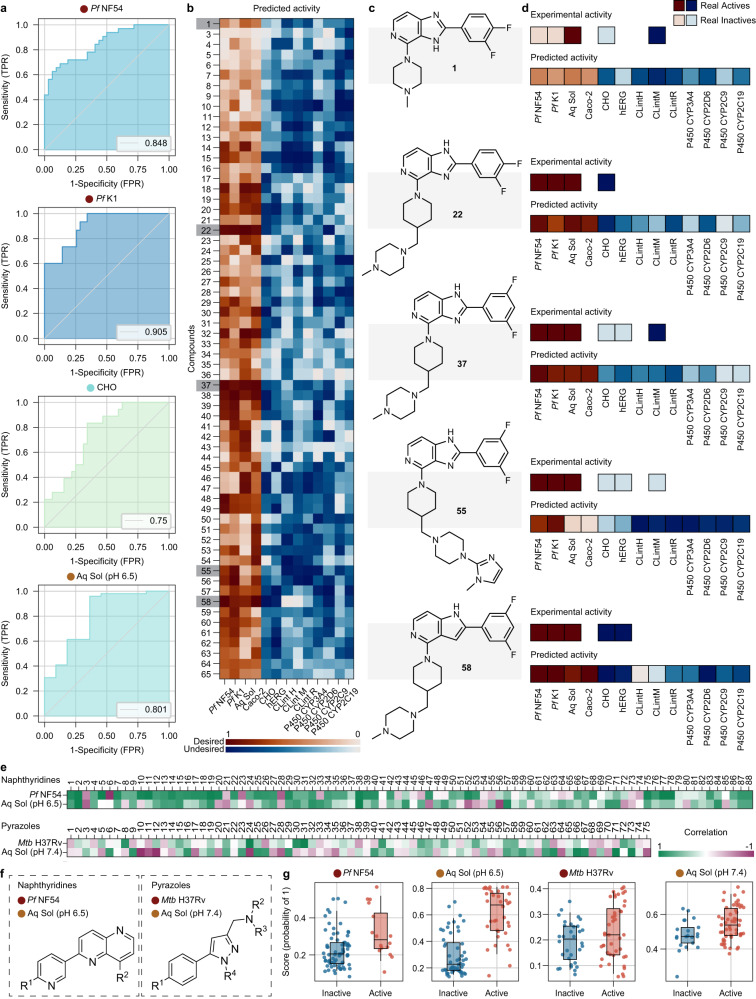
Streamlined data-driven drug discovery remains challenging, especially in resource-limited settings. We present ZairaChem, an artificial intelligence (AI)- and machine learning (ML)-based tool for quantitative structure-activity/property relationship (QSAR/QSPR) modelling. ZairaChem is fully automated, requires low computational resources and works across a broad spectrum of datasets. We describe an end-to-end implementation at the H3D Centre, the leading integrated drug discovery unit in Africa, at which no prior AI/ML capabilities were available. By leveraging in-house data collected over a decade, we have developed a virtual screening cascade for malaria and tuberculosis drug discovery comprising 15 models for key decision-making assays ranging from whole-cell phenotypic screening and cytotoxicity to aqueous solubility, permeability, microsomal metabolic stability, cytochrome inhibition, and cardiotoxicity. We show how computational profiling of compounds, prior to synthesis and testing, can inform progression of frontrunner compounds at H3D. This project is a first-of-its-kind deployment at scale of AI/ML tools in a research centre operating in a low-resource setting.


Conflict of interest statement

The authors declare no competing interests.

Figures

Fig. 1
Fig. 1. The ZairaChem pipeline.
a Scheme of the AutoML methodology, consisting of data processing, descriptor calculation, training of models, assembling (pooling) of results, and reporting. b Number of active and inactive compounds in the Mtb MIC90 assay (training set). c Uniform manifold approximation and projection (UMAP) and principal component analysis (PCA) projections of the chemical space in the Mtb MIC90 assay. Structurally different (1 vs 2/3) and similar (2 vs 3) compounds are depicted. Red indicates active compounds; blue indicates inactive compounds. d Model scores (probability of “1”) assigned to the true active (red, n = 107) and inactive (blue, n = 542) compounds in the test set (20% of the total available data). Boxes indicate the median (central line), Q1 (upper bound) and Q3 (lower bound), and whiskers extend to the data points within up to 1.5 times in the interquartile range. e Distribution of common chemical properties of the compounds, namely molecular weight (MW), calculated logP (cLogP), number of hydrogen bond acceptors (HBA), number of hydrogen bond donors (HBD), number of rings (Rings) and number of rotatable bonds (Rot. Bonds). f AUROC scores of the individual ZairaChem predictors. g ROC curve of the final ensemble model. h Confusion matrix showing true positives (red), true negatives (blue), false positives, and false negatives in the test set. Source data are provided as a Source Data file.
Fig. 2
Fig. 2. ZairaChem implementation of a virtual screening cascade.
a Summary of assays most frequently used in drug discovery programmes at the H3D Centre, progressing from left to right. b AUROC for the 10 AI/ML models developed with internal data (test sets: 20% of H3D data), the four CYP models developed with ZairaChem using external data, and the CardioToxNet model from the literature (test sets: 100% of H3D data). Dataset sample counts are represented by circle size with the corresponding proportion of active (red) and inactive (blue) compounds. c Classification scores of individual compounds for representative assays of different stages of the screening cascade. N. Active/inactive: NF54 139/519, ClintH 146/140, CYP3A4 8/41, hERG 90/47. Boxes indicate the median (central line), Q1 (upper bound) and Q3 (lower bound) and whiskers extend to the data points up to 1.5 times in the interquartile range. d Correspondingly, ROC curves resulting from a five-fold cross-validation, with blue lines depicting the mean AUROC. e Comparison of hit rates for randomly selected molecules (first row) vs molecules ranked according to the model score (probability of “1”) for selected assays. The top 50 (second row) and bottom 50 (third row) molecules are depicted, showing a hit enrichment of true active compounds (red) in the highest-ranked positions and an enrichment of true inactive compounds (blue) in the lowest-ranked positions. Source data are provided as a Source Data file.
Fig. 3
Fig. 3. Model performance within chemical series corresponding to novel regions of chemical space.
PCA and UMAP projections of the chemical space of the H3D Centre’s library for specific chemical series in the malaria (top row) and tuberculosis (bottom row) disease areas. a, e PCA preserves the global distribution of chemical space while b, f UMAP emphasises the clustering of structurally similar data points. c, g Median AUROC scores from a five-fold cross-validation are measured for training sets with an incremental number of local training points for each series, respectively. d, h The percentage of change towards a perfect model (AUROC = 1) between a model trained on a dataset that includes compounds from a more general chemical space versus a model trained on series-specific data alone (see calculation in Methods). The median AUROC score from a five-fold cross-validation, for models trained with both 100 series-specific compounds and global data, is plotted with a circle corresponding to the values of the right-hand-side y-axis. Error bars indicate ± standard deviation (n = 5). Source data are provided as a Source Data file.
Fig. 4
Fig. 4. De novo screening of libraries using AI/ML models.
Upper panel: a ROC curves of ZairaChem models tested on the library of 65 compounds (not included in the training set). Legend indicates the AUROC values of each model. Only models for which experimental validation was available for the 65 molecules are shown. b Predicted scores for each compound, transformed to a scale of 0 to 1 for comparison between assays. Desired activities are shown in a red colour scale and undesired activities are shown in a blue colour scale. Colour maps fade from 1 to 0 according to each model score. c Structure of selected compounds, including the initial hit compound 1. d Comparison of the predicted score and the experimental activity of selected compounds (non-existing squares indicate no experimental data on these assays). Experimental activity is represented as 1 (dark blue or dark red) or 0 (light blue, light red) for desired and undesired assay outcomes, respectively. Lower panel: Prospective validation for two active chemical series at H3D; naphthyridines active against Pf and pyrazoles targeting Mtb. e Model performance is depicted through correlations of model predictions with experimental results in which a green cell represents a correct model prediction while purple cells indicate incorrect predictions. f The core scaffold for each series is depicted as well as g a swarm plot for individual compound predictions. n active/inactive: Pf NF54 16/72, Aq Sol pH6.5 36/52, Mtb H37Rv 43/32, Aq Sol pH7.4 54/21. Boxes indicate the median (central line), Q1 (upper bound) and Q3 (lower bound) and whiskers extend to the data points up to 1.5 times in the interquartile range. Source data are provided as a Source Data file.

References

    1. DiMasi JA, Grabowski HG, Hansen RW. Innovation in the pharmaceutical industry: new estimates of R&D costs. J. Health Econ. 2016;47:20–33. doi: 10.1016/j.jhealeco.2016.01.012. - DOI - PubMed
    1. Wouters, O. J., McKee, M. & Luyten, J. Estimated research and development investment needed to bring a new medicine to market, 2009–2018. JAMA323, 844–853 (2020). - PMC - PubMed
    1. Brown DG, Wobst HJ, Kapoor A, Kenna LA, Southall N. Clinical development times for innovative drugs. Nat. Rev. Drug Discov. 2022;21:793–794. doi: 10.1038/d41573-021-00190-9. - DOI - PMC - PubMed
    1. Kirkpatrick, P. Artificial intelligence makes a splash in small-molecule drug discovery. Biopharma Dealmakers10.1038/d43747-022-00104-7 (2022).
    1. Vamathevan J, et al. Applications of machine learning in drug discovery and development. Nat. Rev. Drug Discov. 2019;18:463–477. doi: 10.1038/s41573-019-0024-5. - DOI - PMC - PubMed

Publication types