. 2023 Sep 15;13(1):15287.
doi: 10.1038/s41598-023-42495-2.

The impact of mutational clonality in predicting the response to immune checkpoint inhibitors in advanced urothelial cancer

Affiliations

The impact of mutational clonality in predicting the response to immune checkpoint inhibitors in advanced urothelial cancer

Lilian Marie Boll et al. Sci Rep. .

Abstract

Immune checkpoint inhibitors (ICI) have revolutionized cancer treatment and can result in complete remissions even at advanced stages of the disease. However, only a small fraction of patients respond to the treatment. To better understand which factors drive clinical benefit, we have generated whole exome and RNA sequencing data from 27 advanced urothelial carcinoma patients treated with anti-PD-(L)1 monoclonal antibodies. We assessed the influence on the response of non-synonymous mutations (tumor mutational burden or TMB), clonal and subclonal mutations, neoantigen load and various gene expression markers. We found that although TMB is significantly associated with response, this effect can be mostly explained by clonal mutations, present in all cancer cells. This trend was validated in an additional cohort. Additionally, we found that responders with few clonal mutations had abnormally high levels of T and B cell immune markers, suggesting that a high immune cell infiltration signature could be a better predictive biomarker for this subset of patients. Our results support the idea that highly clonal cancers are more likely to respond to ICI and suggest that non-additive effects of different signatures should be considered for predictive models.


Conflict of interest statement

The authors declare no competing interests.

Figures

Figure 1
Figure 1
Analysis of omics data from the metastatic urothelial cancer cohort at Hospital del Mar. (a) Study design. We performed whole exome sequencing (WES) and RNA sequencing (RNA-Seq) from a cohort of 27 patients. The cohort included 17 responders (partial or complete response) and 10 non-responders (progressive disease). We measured the differences in the distribution of several biomarkers, including clonal and subclonal TMB, mutational signatures, number of predicted mutation-induced neoantigens and gene expression signatures in responders and non-responders. Created with BioRender.com. (b) Tumor mutational burden (TMB) compared to different TCGA cancer cohorts. The number of non-synonymous mutations in the cohort in our cohort (HdM-BLCA-1) was very similar to the bladder cancer TCGA cohort and in accordance with this being a highly mutated cancer. The names below the plot represent the TCGA cohort abbreviation, the numbers above represent the cohort sizes. (c) Frequencies of different pairwise nucleotide substitutions. C->T mutations were the most frequent ones, followed by C->G. TI transition, Tv transversion. (d) Cancer-related frequently mutated genes. Missense, frameshift and nonsense mutations are shown. Genes have been classified into ‘Oncogenes’, ‘Tumor suppressor genes’ and ‘Function unclear’ based on previous knowledge. NR no responders, R responders.
Figure 2
Figure 2
TMB and clonal TMB are significantly associated with the response to ICI. (a) Relationship between TMB and response to ICI treatment. TMB values were significantly higher in responders than in non-responders (Wilcoxon test, p value = 0.046). (b) Relationship between stop mutations and response to ICI treatment. Nonsense mutations were significantly higher in responders than in non-responder (Wilcoxon test, p value = 0.037). (c) Relationship between frameshift mutations and response to ICI treatment. Frameshift mutations showed a trend of being more abundant in responders than non-responders but the difference was not statistically significant (p = 0.3). (d) Number of mutations per patient divided in clonal and subclonal. The proportion of clonal mutations is significantly higher in responders (Fisher’s exact test p value = 0.007). (e) Relationship between clonal TMB and response to ICI treatment. Clonal TMB values were significantly higher in responders than in non-responders (Wilcoxon text, p value = 0.017). (f) Relationship between subclonal TMB and response to ICI treatment. Responders tend to have higher values but the difference between responders and non-responders is not statistically significant. NR no responders, R responders, triangle shape represents complete responders among the group of responders.
Figure 3
Figure 3
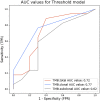
Clonal TMB performs better in separating the two response groups in a threshold model than total TMB. Thresholds to separate response groups in steps of TMB = 1 mut/mB were applied. Sensitivity or true positive rate (TPR) was calculated as the number of true positives divided by the number of true positives + false negatives. Specificity or false positive rate (FPR) was calculated as the number of true negatives divided by the number of true negatives plus false positives.
Figure 4
Figure 4
Effect of mutation frequency on the discrimination between responders and non-responders. TMB ratio: ratio of the median TMB of responders versus the median TMB of non-responders. Mutation frequency: minimum variant allele frequency that we consider to calculate TMB. The difference in TMB between responders and non-responders increases with mutation frequency, with maximum values at a mutation frequency of 0.45 in both cohorts.
Figure 5
Figure 5
The positive relationship between predicted neoantigens and response mirrors that observed for TMB. (a) Relationship between the number of putative binders and the response to the treatment. Responders have a significantly higher number of putative binders than non-responders (Wilcoxon test, p value = 0.047). (b) Relationship between putative binders originating from clonal mutations and response to ICI treatment. Number of putative binders originating from clonal mutations is significantly higher in responders than in non-responders (Wilcoxon test, p value = 0.018). (c) Relationship between putative binders originating from subclonal mutations and response to ICI treatment. No significant difference can be observed for the number of putative binders originating from subclonal mutations between responders and non-responders. NR no responders, R responders, triangle shape represents complete responders among the group of responders.
Figure 6
Figure 6
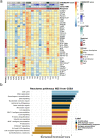
(a) Responders with low clonal TMB show expression of genes connected to immune infiltration, while non-responders have higher expression of immune suppression. Gene expression for selected marker genes sorted by pathways. Expression values are normalized and log2cpm transformed. The heatmap is scaled by row. Annotation bars show immune infiltration as CIBERSORT score, tumor mutational burden (TMB) and clonal tumor mutational burden (clonal TMB) and response to ICI treatment. Columns indicate the patient tumor samples. NR no responder, PR partial responder, CR complete responder. Only a few genes were statistically significant in the DE analysis (*p value < 0.05). (b) REACTOME pathways connected with proliferation, DNA damage repair, antigen presentation and pro-inflammation are significantly enriched in responders, and anti-inflammation pathways are enriched in non-responders. Normalized enrichment score for selected pathways significantly related to response obtained from GSEA analysis (adjusted P < 0.05; comparing 13 responders and 7 non-responders). The complete list of pathways with the included genes is provided in Additional file 3.

References

    1. Antoni S, et al. Bladder cancer incidence and mortality: A global overview and recent trends. Eur. Urol. 2017;71:96–108. doi: 10.1016/j.eururo.2016.06.010. - DOI - PubMed
    1. Richters MM, et al. Best practices for bioinformatic characterization of neoantigens for clinical utility. Genome Med. 2019;11:1–21. doi: 10.1186/s13073-019-0666-2. - DOI - PMC - PubMed
    1. Li K, et al. PD-1 suppresses TCR-CD8 cooperativity during T-cell antigen recognition. Nat. Commun. 2021;12:1–13. - PMC - PubMed
    1. Inman BA, et al. PD-L1 (B7–H1) expression by urothelial carcinoma of the bladder and BCG-induced granulomata: Associations with localized stage progression. Cancer. 2007;109:1499–1505. doi: 10.1002/cncr.22588. - DOI - PubMed
    1. Bellmunt J, et al. Pembrolizumab as second-line therapy for advanced urothelial carcinoma. N. Engl. J. Med. 2017;376:1015–1026. doi: 10.1056/NEJMoa1613683. - DOI - PMC - PubMed

Publication types

MeSH terms

Substances