. 2023 Sep 15;13(1):15279.
doi: 10.1038/s41598-023-42290-z.

Selective effects of estradiol on human corneal endothelial cells

Affiliations

Selective effects of estradiol on human corneal endothelial cells

Seoyoung Han et al. Sci Rep. .

Abstract

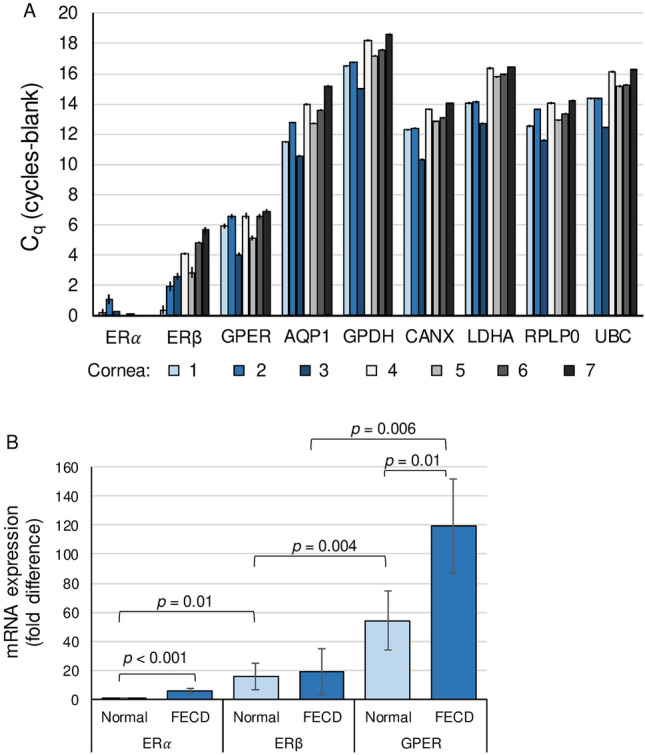
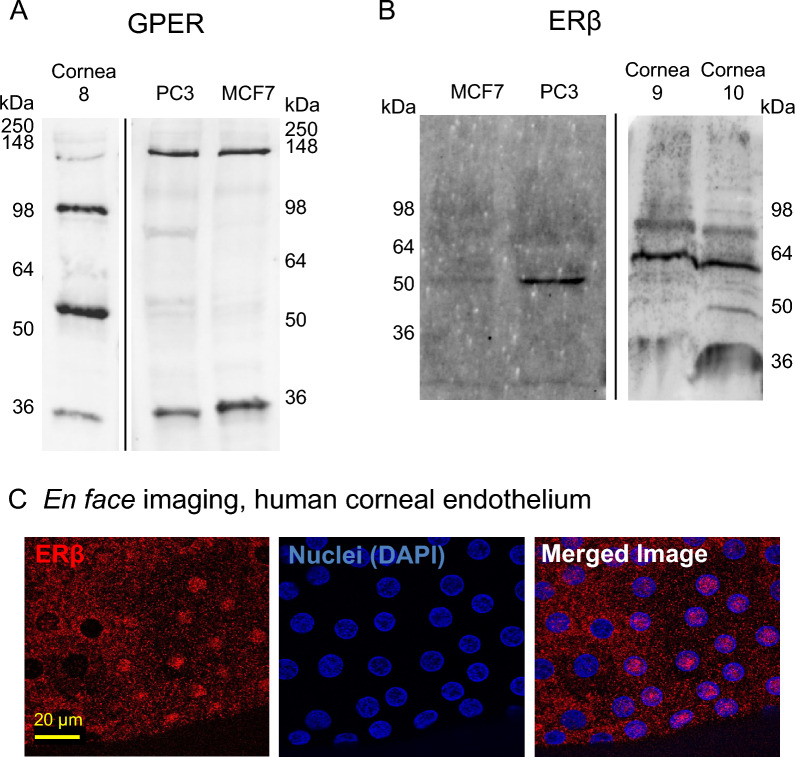
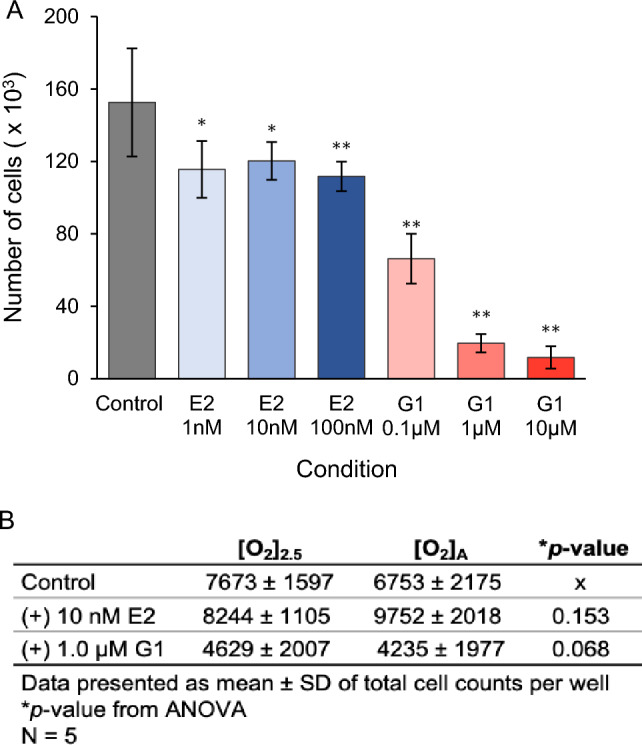
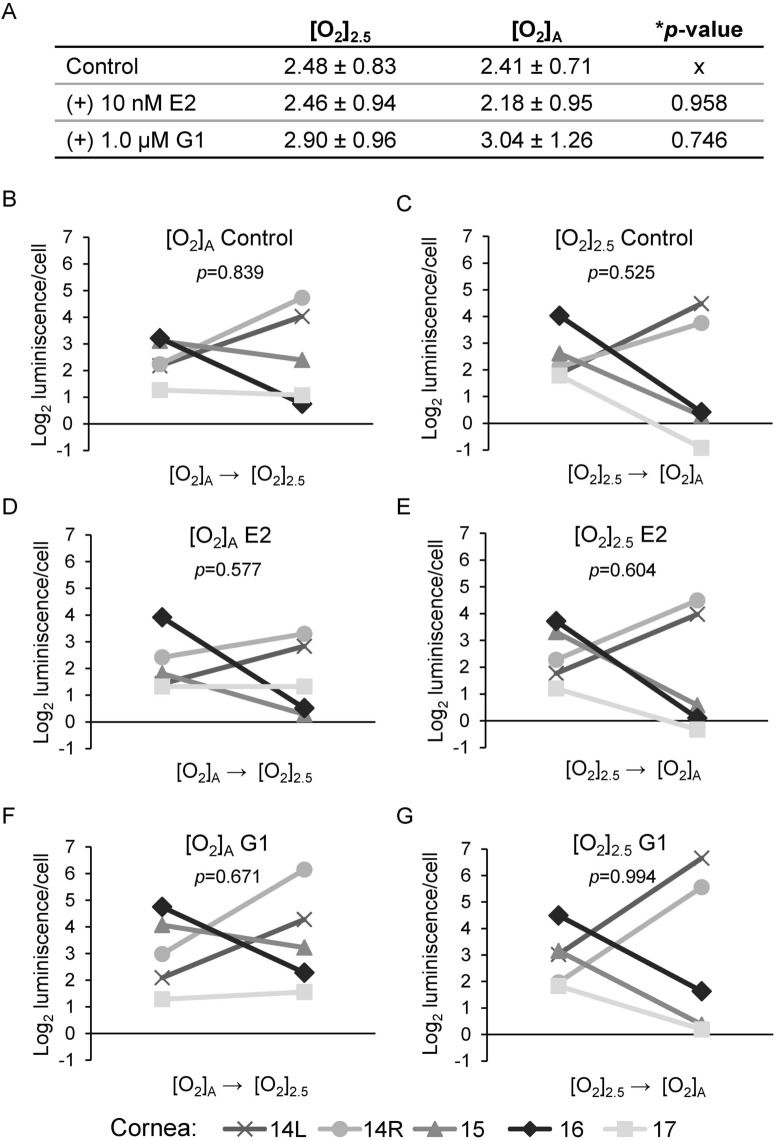
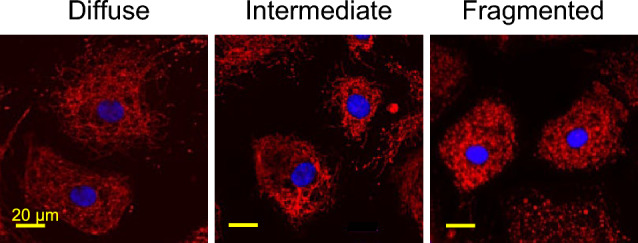
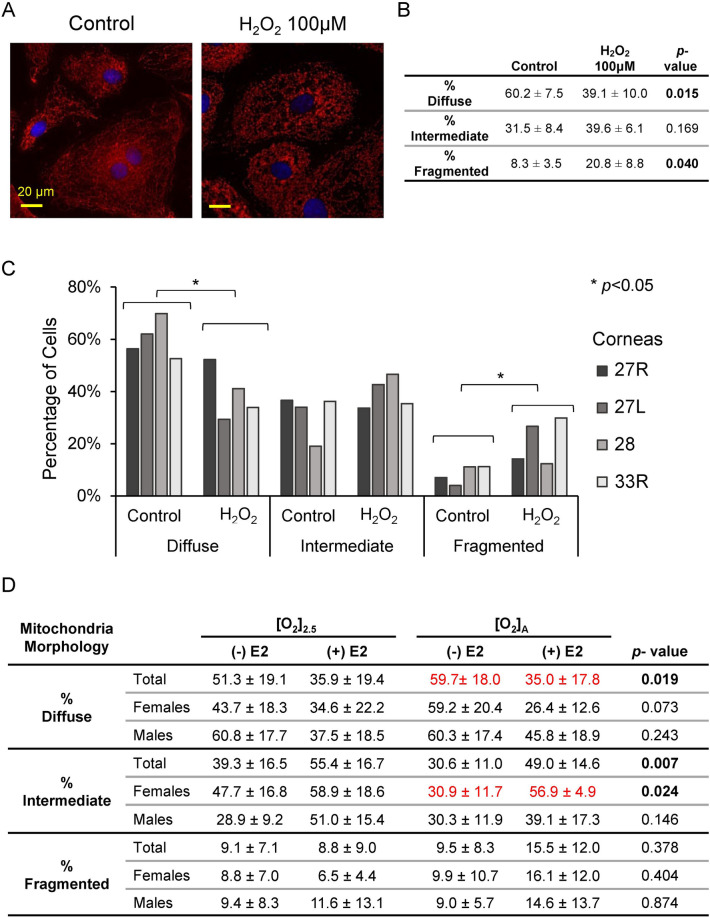
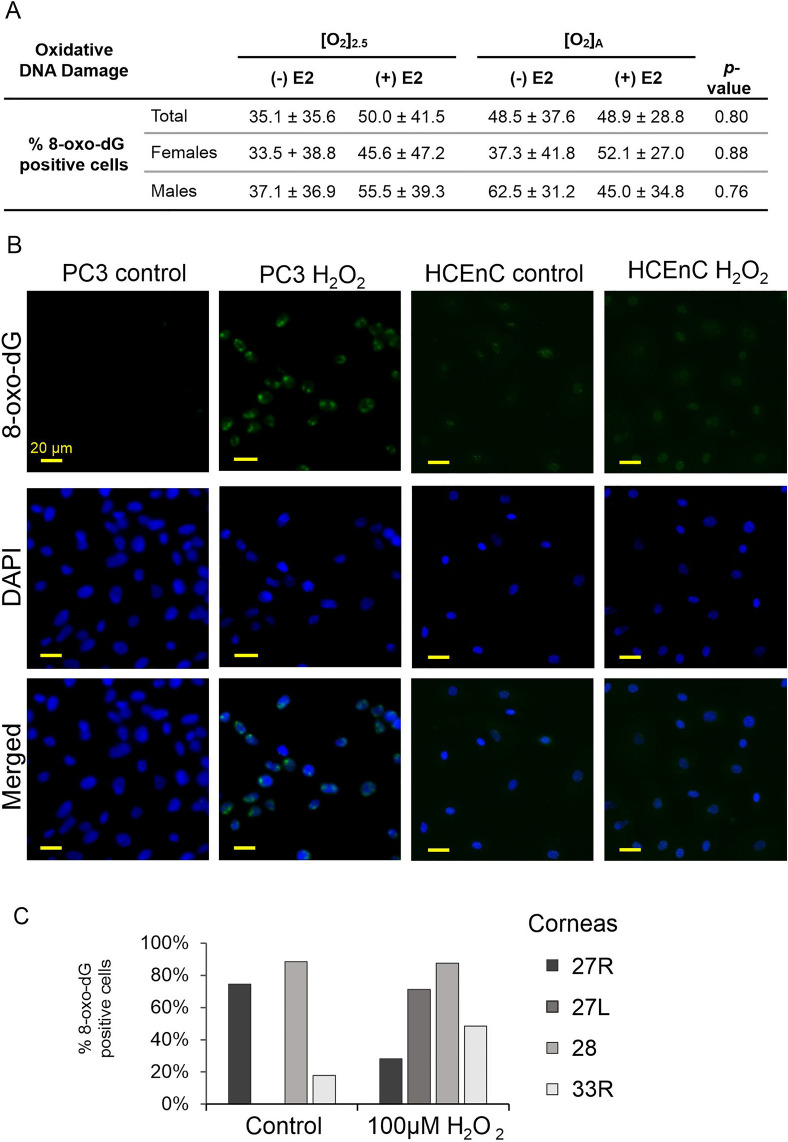
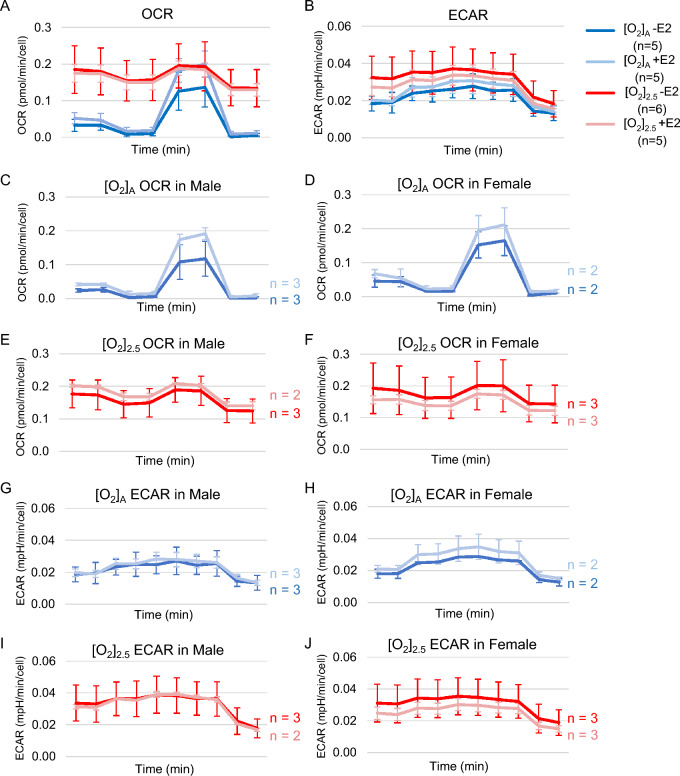
In Fuchs endothelial corneal dystrophy (FECD), mitochondrial and oxidative stresses in corneal endothelial cells (HCEnCs) contribute to cell demise and disease progression. FECD is more common in women than men, but the basis for this observation is poorly understood. To understand the sex disparity in FECD prevalence, we studied the effects of the sex hormone 17-β estradiol (E2) on growth, oxidative stress, and metabolism in primary cultures of HCEnCs grown under physiologic ([O2]2.5) and hyperoxic ([O2]A) conditions. We hypothesized that E2 would counter the damage of oxidative stress generated at [O2]A. HCEnCs were treated with or without E2 (10 nM) for 7-10 days under both conditions. Treatment with E2 did not significantly alter HCEnC density, viability, ROS levels, oxidative DNA damage, oxygen consumption rates, or extracellular acidification rates in either condition. E2 disrupted mitochondrial morphology in HCEnCs solely from female donors in the [O2]A condition. ATP levels were significantly higher at [O2]2.5 than at [O2]A in HCEnCs from female donors only, but were not affected by E2. Our findings demonstrate the resilience of HCEnCs against hyperoxic stress. The effects of hyperoxia and E2 on HCEnCs from female donors suggest cell sex-specific mechanisms of toxicity and hormonal influences.


Conflict of interest statement

The authors declare no competing interests.

Figures

Figure 1
Figure 1
ER gene expression in human corneal endothelium. RT-qPCR was performed to measure mRNA expression for ESR1 (ERα), ESR2 (ERβ), GPER, and housekeeping/control genes (AQP1 [aquaporin 1], GAPDH [glyceraldehyde-3-phosphate dehydrogenase], CANX [calnexin], LDHA [lactate dehydrogenase A], RPLP0 [ribosomal protein lateral stalk subunit P0], and UBC [ubiquitin C]) in human corneal endothelium from non-diseased donors (n = 4, corneas #4–7 in Table 1) and donors with FECD (n = 3, corneas #1–3). (A) Data presented are the means from three reverse transcription reactions ± standard deviations. (B) Fold-changes in estrogen receptor expression compared to ERα expression in non-diseased corneal endothelium.
Figure 2
Figure 2
ER protein expression in human corneal endothelium. Western blotting was performed to measure protein levels of GPER (A) and ERβ (B) in native human corneal endothelium (n = 1 donor for GPER [cornea #8 in Table 1], n = 2 donors for ERβ [corneas #9 and 10]) and in the PC3 (n = 3 for each antibody) and MCF7 (n = 3 for each antibody) cell lines. Theoretical molecular weight: GPER, 42 kDa; ERβ, 55–60 kDa. The cropped blots from different gels are presented with dividing lines. Corresponding original images are provided in Supplementary Fig. 1. (C) En face immunofluorescence localization of ERβ in normal human corneal endothelium (representative images from corneas #11–13).
Figure 3
Figure 3
Effects of G1 and E2 on growth of PC3 cells and HCEnCs. (A) Counts of PC3 cells treated with 1 nM, 10 nM, or 100 nM E2 and 0.1 µM, 1.0 µM, or 10 µM G1 (n = 12). ∗ p < 0.01, ∗  ∗ p < 0.001 vs control by t test. (B) Counts of HCEnCs treated with 10 nM E2 or 1.0 μM G1 (n = 5, corneas #14–17 in Table 1). Data presented as means ± SDs of total cell counts per well. p values from single-factor ANOVA.
Figure 4
Figure 4
Viability of HCEnCs in the presence and absence of oxygen stress and E2 or G1 treatment. (A) Cell viability measurements (log2 luminescence/cell) for HCEnCs treated with E2 or G1 (n = 5, corneas #14–17 in Table 1). Data are presented as means ± SDs. *p value from ANOVA. Each plot in BG represents the data for a single donor, with p values from paired t tests. Donor numbers correspond to those in Table 1.
Figure 5
Figure 5
Representative images of mitochondrial morphology grading. Mitochondrial morphology revealed by MitoTracker Red was graded for each cell as diffuse (normal), intermediate, or fragmented (abnormal). Nuclei were stained with DAPI (blue). Representative images from corneas #27R–34L in Table 1.
Figure 6
Figure 6
Mitochondrial morphology in HCEnCs in the presence and absence of oxygen stress and E2 treatment. (A) Immunofluorescence images of mitochondria in HCEnCs stained with MitoTracker Red after H2O2 treatment. (B, C) Quantification of mitochondrial organization graded as diffuse (normal), intermediate, or fragmented (abnormal) in HCEnCs treated with H2O2 (n = 4, corneas #27R, 27L, 28L, and 33R in Table 1). p values from t tests. Data presented as means ± SDs. (D) Quantification of mitochondrial organization graded in HCEnCs in the presence or absence of 10 nM E2 at [O2]2.5 or [O2]A. p value from single-factor ANOVA. Pairwise comparisons by Tukey's post hoc analysis, with significant differences highlighted in red. (n = 9 [4 males and 5 females]; corneas #27R–33L).
Figure 7
Figure 7
Oxidative damage in HCEnCs in the presence and absence of oxygen stress and E2 treatment. (A) Percentages of 8-oxo-dG-positive HCEnCs in the presence or absence of 10 nM E2 at [O2]2.5 or [O2]A. Data presented as means ± SDs. p value from single-factor ANOVA (n = 8 [4 males and 4 females]; corneas #27L–33L in Table 1). (B) Immunofluorescence imaging of 8-oxo-dG in PC3 cells and HCEnCs after H2O2 treatment. (C) Percentages of 8-oxo-dG-positive HCEnCs cells after H2O2 treatment (n = 4, corneas #27R, 27L, 28L, and 33R).
Figure 8
Figure 8
OCR and ECAR in the presence and absence of oxygen stress and E2 treatment. OCR (A) and ECAR (B) measurements in the presence or absence of 10 nM E2 at [O2]2.5 or [O2]A. (CJ) Trends in mean data values with and without E2 treatment at [O2]2.5 and [O2]A by cell sex for each condition. x axis for time is a total duration of 41 min for OCR and 52 min for ECAR recordings. Data presented as means ± SDs (n = 5–6 [2–3 males and 2–3 females]; corneas #40R–45 in Table 1).

Update of

Similar articles

Cited by

References

    1. 2019 Eye Banking Statistical Report. (Eye Bank Association of America, Washington, DC, 2020).
    1. Higa A, et al. Prevalence of and risk factors for cornea guttata in a population-based study in a southwestern island of Japan: The Kumejima study. Arch. Ophthalmol. 2011;129:332–336. doi: 10.1001/archophthalmol.2010.372. - DOI - PubMed
    1. Kitagawa K, et al. Prevalence of primary cornea guttata and morphology of corneal endothelium in aging Japanese and Singaporean subjects. Ophthalmic Res. 2002;34:135–138. doi: 10.1159/000063656. - DOI - PubMed
    1. Zoega GM, et al. Prevalence and risk factors for cornea guttata in the Reykjavik Eye Study. Ophthalmology. 2006;113:565–569. doi: 10.1016/j.ophtha.2005.12.014. - DOI - PubMed
    1. Wieben ED, et al. A common trinucleotide repeat expansion within the transcription factor 4 (TCF4, E2–2) gene predicts Fuchs corneal dystrophy. PLoS ONE. 2012;7:e49083. doi: 10.1371/journal.pone.0049083. - DOI - PMC - PubMed

Publication types