. 2023 Sep 15;14(1):5739.
doi: 10.1038/s41467-023-41343-1.

Machine learning coarse-grained potentials of protein thermodynamics

Affiliations

Machine learning coarse-grained potentials of protein thermodynamics

Maciej Majewski et al. Nat Commun. .

Abstract

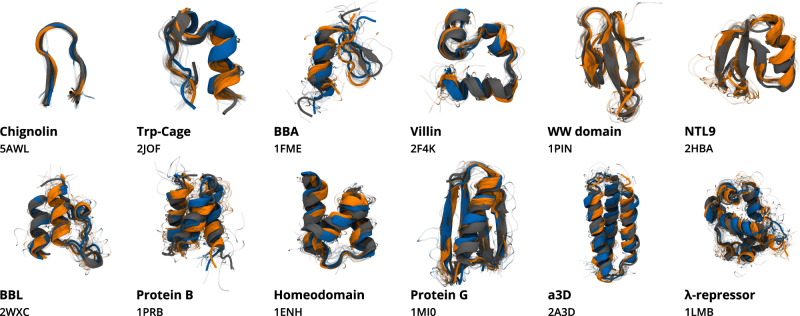
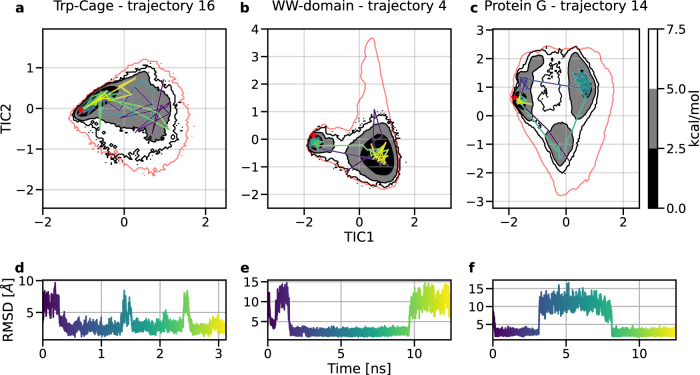
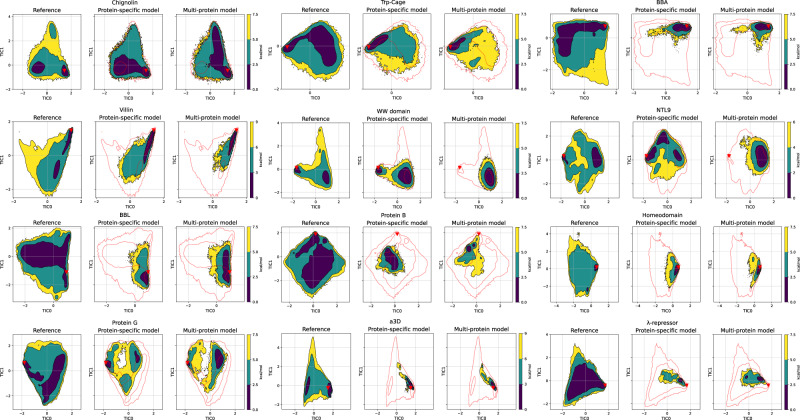
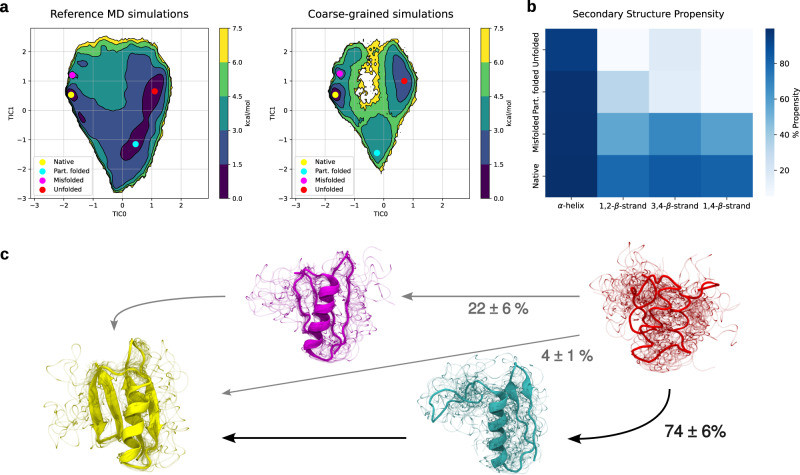
A generalized understanding of protein dynamics is an unsolved scientific problem, the solution of which is critical to the interpretation of the structure-function relationships that govern essential biological processes. Here, we approach this problem by constructing coarse-grained molecular potentials based on artificial neural networks and grounded in statistical mechanics. For training, we build a unique dataset of unbiased all-atom molecular dynamics simulations of approximately 9 ms for twelve different proteins with multiple secondary structure arrangements. The coarse-grained models are capable of accelerating the dynamics by more than three orders of magnitude while preserving the thermodynamics of the systems. Coarse-grained simulations identify relevant structural states in the ensemble with comparable energetics to the all-atom systems. Furthermore, we show that a single coarse-grained potential can integrate all twelve proteins and can capture experimental structural features of mutated proteins. These results indicate that machine learning coarse-grained potentials could provide a feasible approach to simulate and understand protein dynamics.


Conflict of interest statement

The authors declare no competing interests.

Figures

Fig. 1
Fig. 1. Comparison of simulated and experimental protein structures.
Structures obtained from CG simulations of the protein-specific model (orange) and the multi-protein model (blue), compared to their respective experimental structures (gray). Structures were sampled from the native macrostate, which was identified as the macrostate containing the conformation with the minimum RMSD with respect to the experimental crystal structure. Ten conformations were sampled from each conformational state (visualized as transparent shadows) and the lowest RMSD conformation of each macrostate is displayed in cartoon representation, reconstructing the backbone structure from α-carbon atoms. The native conformation of each protein, extracted from their corresponding crystal structure is shown in opaque gray. The text indicates the protein name and PDB ID for the experimental structure. WW-Domain and NTL9 results for the multi-protein model are not shown, as the model failed to recover the experimental structures. The statistics of native macrostates are included in Table 2.
Fig. 2
Fig. 2. Trajectory analysis of protein dynamics.
Three individual CG trajectories selected from validation MD of Trp-Cage, WW-Domain, and Protein G. Each visualized simulation, colored from purple to yellow, explores the free energy surface, accesses multiple major basins and transitions among conformations. Top panels: 100 states sampled uniformly from the trajectory plotted over CG free energy surface, projected over the first two time-lagged independent components (TICs) for Trp-Cage (a), WW-Domain (b), and Protein G (c). The red line indicates the all-atom equilibrium density by showing the energy level above the free energy minimum with the value of 7.5 kcal/mol. The experimental structure is marked as a red star. Bottom panels: Cα-RMSD of the trajectory with reference to the experimental structure for Trp-Cage (d), WW-Domain (e), and Protein G (f). Source data are provided as a Source data file.
Fig. 3
Fig. 3. Free energy surface comparison across all-atom reference and coarse-grained models.
Comparison between the reference MD (left), protein-specific model (center), and multi-protein model (right) coarse-grained simulations free energy surface across the first two TICA dimensions for each protein. The free energy surface for each simulation set was obtained by binning over the first two TICA dimensions, dividing them into a 80 × 80 grid, and averaging the weights of the equilibrium probability in each bin computed by the Markov state model. The red triangles indicate the experimental structures. The red line indicates the all-atom equilibrium density by showing the energy level above free energy minimum with the values of 9 kcal/mol for Villin and α3D, 6 kcal/mol for NTL9, and 7.5 kcal/mol for the remaining proteins. Source data are provided as a Source data file.
Fig. 4
Fig. 4. Free energy surface and structural analysis of Protein G simulations.
a Free energy surface of Protein G over the first two TICs for the all-atom MD simulations (top) and the coarse-grained simulations (bottom) using the protein-specific model. The circles identify different relevant minima (yellow—native, magenta—misfolded, cyan—partially folded, red—random coil). b The propensity of all the secondary structural elements of Protein G across the different macrostates, estimated using an RMSD threshold of 2 Å for each structural element shown in the x-axis. c Sampled conformations from the macrostates of coarse-grained simulations corresponding to the marked minima in the free energy surfaces in (a). Sampled structure colors correspond to the minima colors in the free energy surface plot, with blurry lines of the same color showing additional conformations from the same state. Arrows represent the main pathways leading from the random coil to the native structure with the corresponding percentages of the total flux of each pathway. Source data are provided as a Source data file.

References

    1. McCammon J. Protein dynamics. Rep. Prog. Phys. 1984;47:1.
    1. Henzler-Wildman K, Kern D. Dynamic personalities of proteins. Nature. 2007;450:964–972. - PubMed
    1. Frauenfelder H, Sligar SG, Wolynes PG. The energy landscapes and motions of proteins. Science. 1991;254:1598–1603. - PubMed
    1. Diez M, et al. Proton-powered subunit rotation in single membrane-bound F0F1-ATP synthase. Nat. Struct. Mol. Biol. 2004;11:135–141. - PubMed
    1. Eisenmesser EZ, et al. Intrinsic dynamics of an enzyme underlies catalysis. Nature. 2005;438:117–121. - PubMed

Publication types

Substances