

Analysis of genetic diversity and genome-wide association study for drought tolerance related traits in Iranian bread wheat
- PMID: 37715130
- PMCID: PMC10503013
- DOI: 10.1186/s12870-023-04416-3
Analysis of genetic diversity and genome-wide association study for drought tolerance related traits in Iranian bread wheat
Abstract
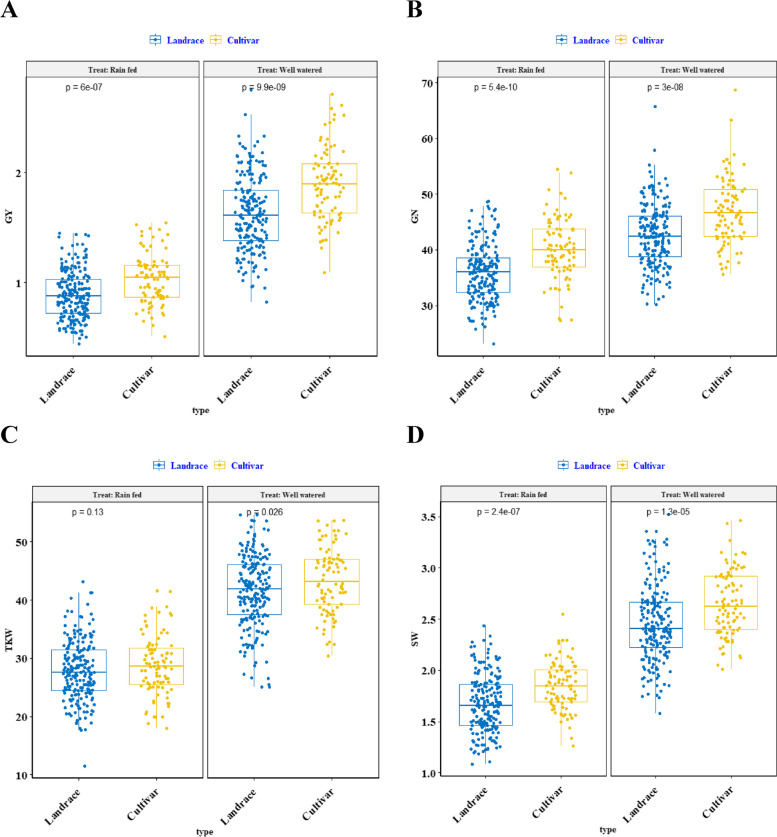
Background: Drought is most likely the most significant abiotic stress affecting wheat yield. The discovery of drought-tolerant genotypes is a promising strategy for dealing with the world's rapidly diminishing water resources and growing population. A genome-wide association study (GWAS) was conducted on 298 Iranian bread wheat landraces and cultivars to investigate the genetic basis of yield, yield components, and drought tolerance indices in two cropping seasons (2018-2019 and 2019-2020) under rainfed and well-watered environments.
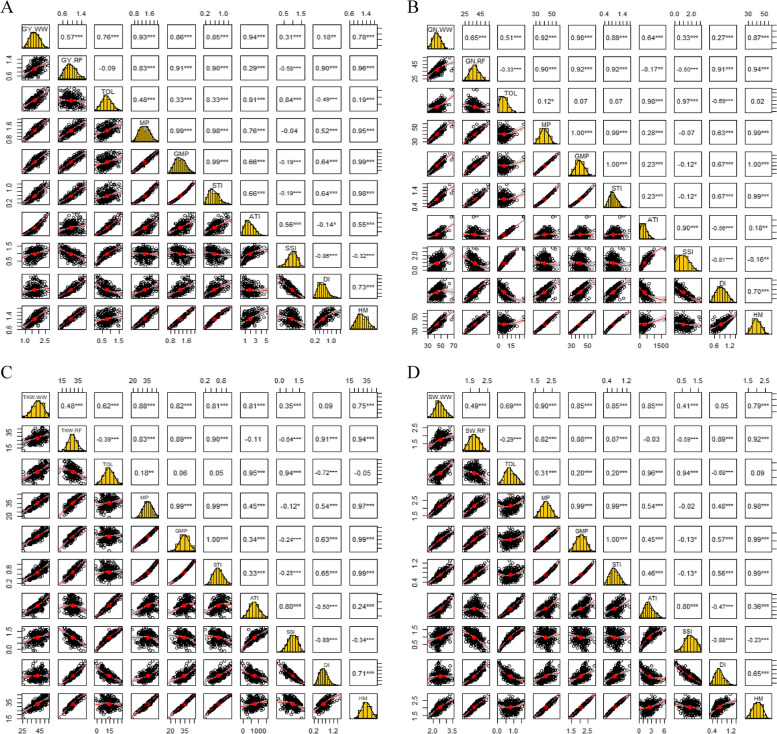
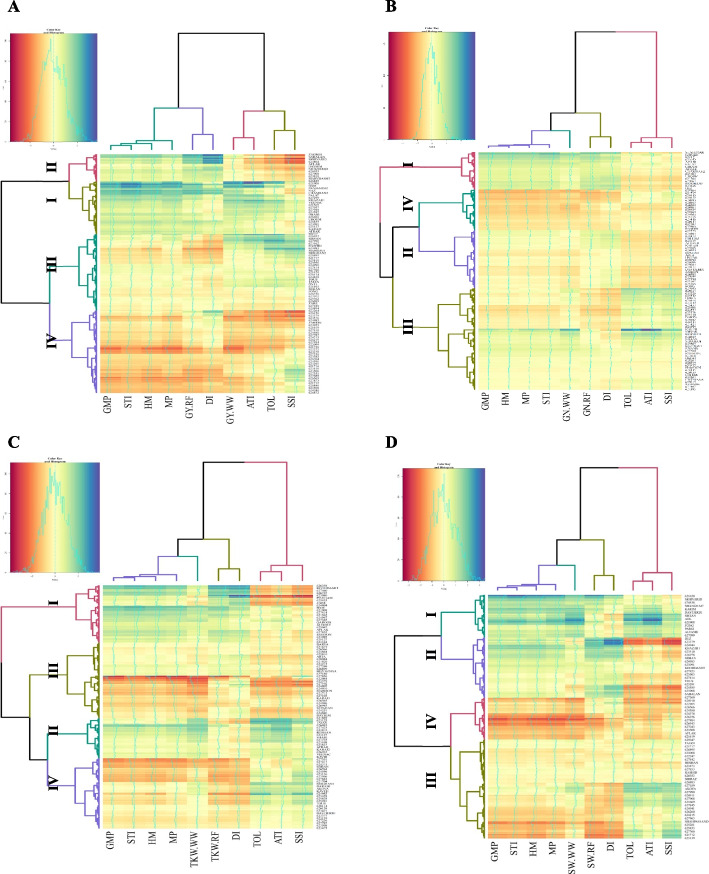
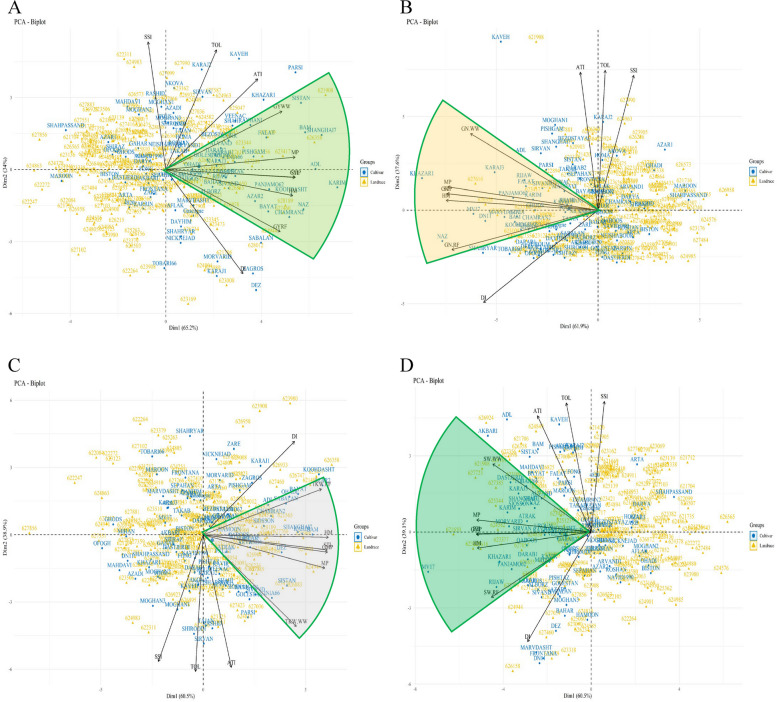
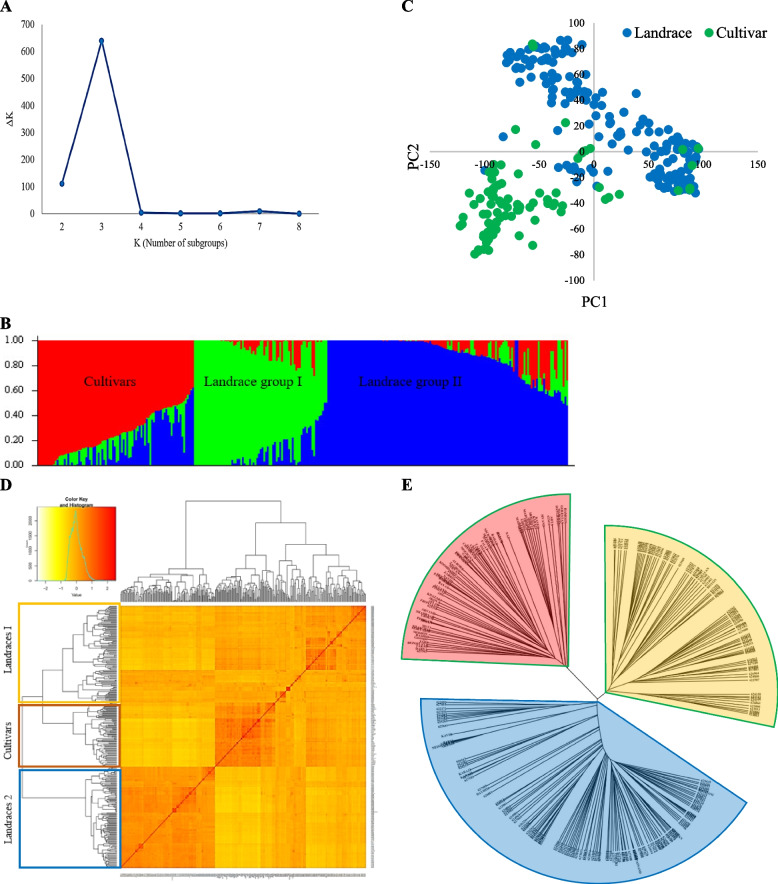
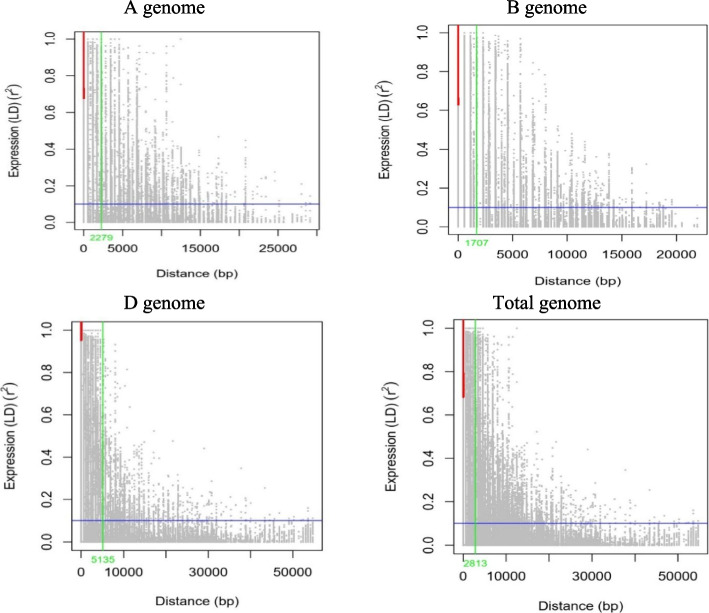
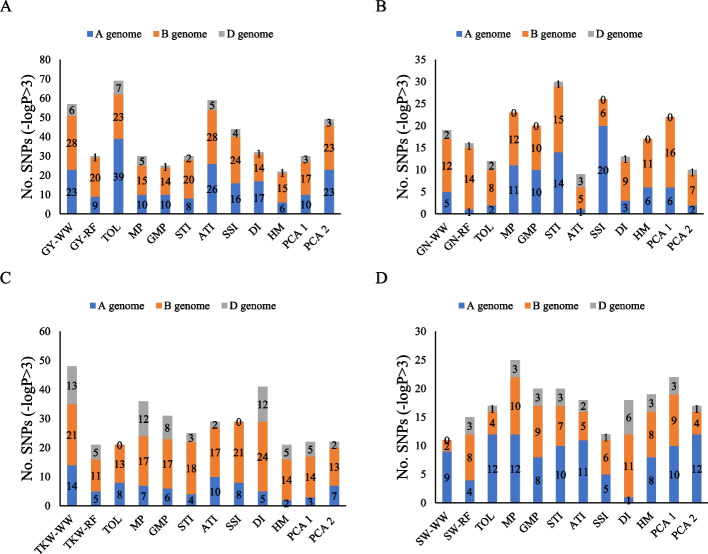
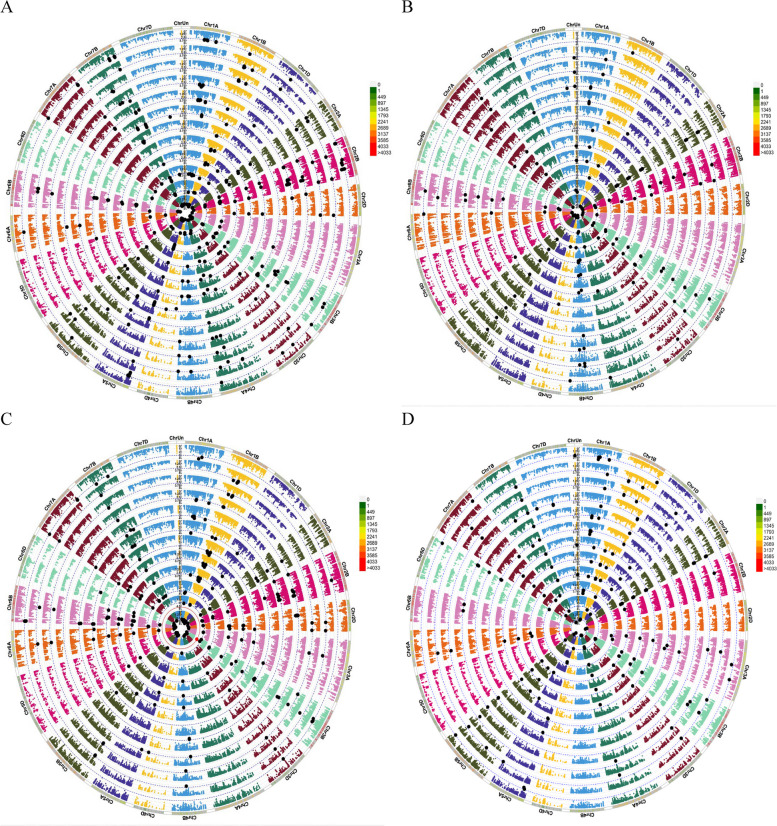
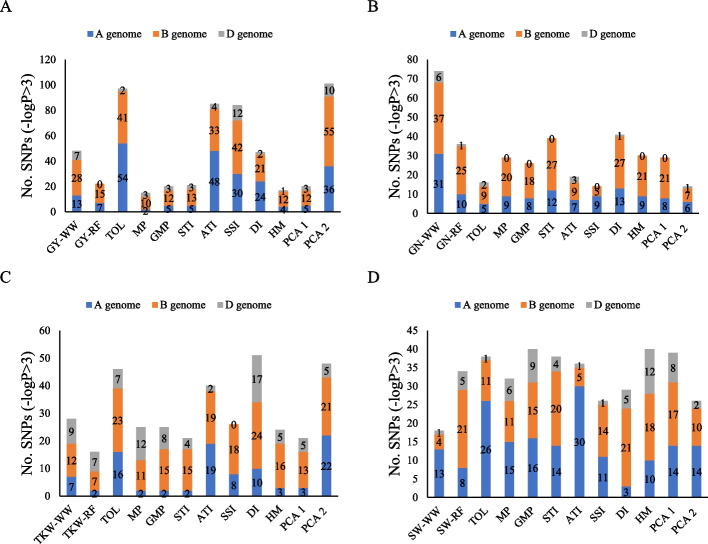
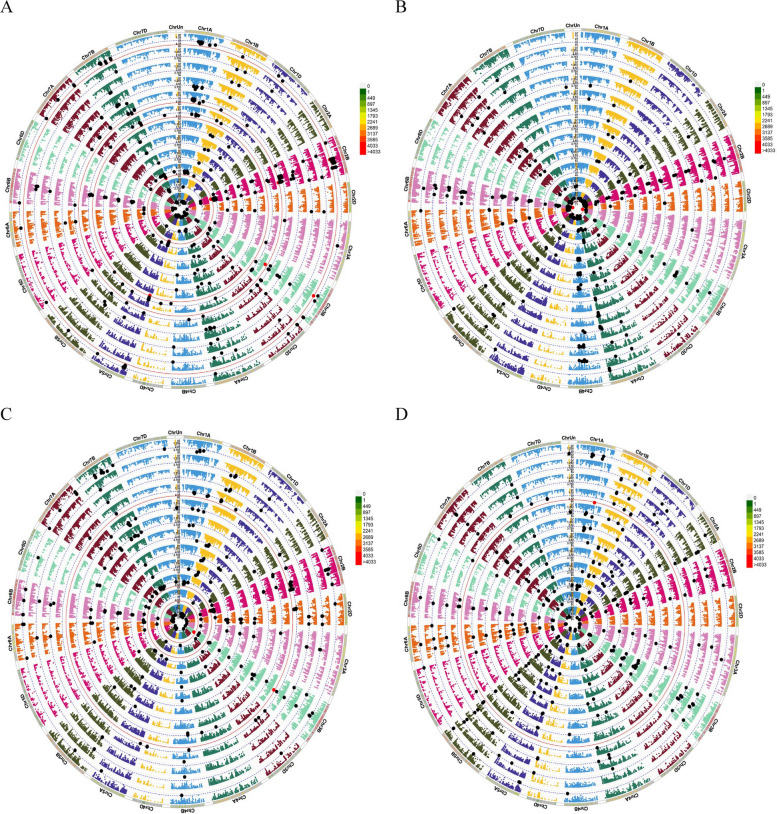
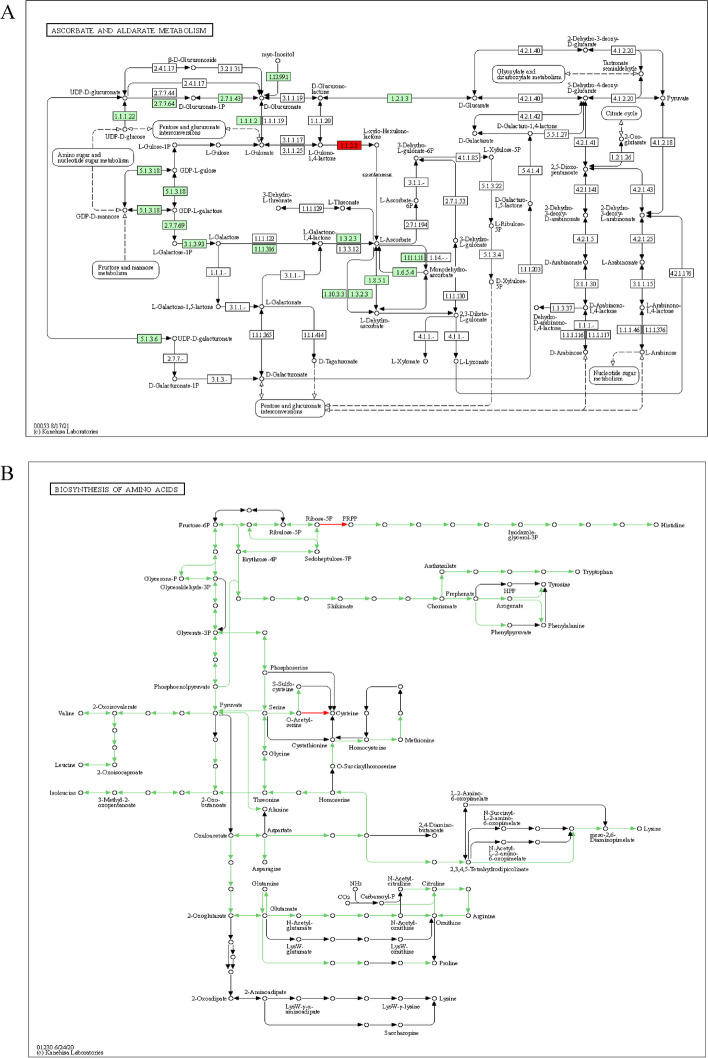
Results: A heatmap display of hierarchical clustering divided cultivars and landraces into four categories, with high-yielding and drought-tolerant genotypes clustering in the same group. The results of the principal component analysis (PCA) demonstrated that selecting genotypes based on the mean productivity (MP), geometric mean productivity (GMP), harmonic mean (HM), and stress tolerance index (STI) can help achieve high-yield genotypes in the environment. Genome B had the highest number of significant marker pairs in linkage disequilibrium (LD) for both landraces (427,017) and cultivars (370,359). Similar to cultivars, marker pairs on chromosome 4A represented the strongest LD (r2 = 0.32). However, the genomes D, A, and B have the highest LD, respectively. The single-locus mixed linear model (MLM) and multi-locus random-SNP-effect mixed linear model (mrMLM) identified 1711 and 1254 significant marker-trait association (MTAs) (-log10 P > 3) for all traits, respectively. A total of 874 common quantitative trait nucleotides (QTNs) were simultaneously discovered by both MLM and mrMLM methods. Gene ontology revealed that 11, 18, 6, and 11 MTAs were found in protein-coding regions (PCRs) for spike weight (SW), thousand kernel weight (TKW), grain number per spike (GN), and grain yield (GY), respectively.
Conclusion: The results identified rich regions of quantitative trait loci (QTL) on Ch. 4A and 5A suggest that these chromosomes are important for drought tolerance and could be used in wheat breeding programs. Furthermore, the findings indicated that landraces studied in Iranian bread wheat germplasm possess valuable alleles, that are responsive to water-limited conditions. This GWAS experiment is one of the few types of research conducted on drought tolerance that can be exploited in the genome-mediated development of novel varieties of wheat.
Keywords: Drought tolerance indices; Genome-wide association study; MTAs; SNP markers; Wheat accessions.
© 2023. BioMed Central Ltd., part of Springer Nature.
Conflict of interest statement
The authors declare that they have no competing interests.
Figures
Similar articles
-
Genome-wide association study of agronomic traits in bread wheat reveals novel putative alleles for future breeding programs.BMC Plant Biol. 2019 Dec 5;19(1):541. doi: 10.1186/s12870-019-2165-4. BMC Plant Biol. 2019. PMID: 31805861 Free PMC article.
-
Genome-wide association mapping for wheat morphometric seed traits in Iranian landraces and cultivars under rain-fed and well-watered conditions.Sci Rep. 2022 Oct 25;12(1):17839. doi: 10.1038/s41598-022-22607-0. Sci Rep. 2022. PMID: 36284129 Free PMC article.
-
Multi-locus genome-wide association mapping for major agronomic and yield-related traits in sorghum (Sorghum bicolor (L.) moench) landraces.BMC Genomics. 2025 Mar 28;26(1):304. doi: 10.1186/s12864-025-11458-4. BMC Genomics. 2025. PMID: 40155810 Free PMC article.
-
Genetic dissection for seedling root-related traits using multiple-methods in bread wheat (Triticum aestivum L.).Theor Appl Genet. 2025 Mar 7;138(3):66. doi: 10.1007/s00122-025-04847-6. Theor Appl Genet. 2025. PMID: 40053141 Review.
-
Recent Progress in Germplasm Evaluation and Gene Mapping to Enable Breeding of Drought-Tolerant Wheat.Front Plant Sci. 2020 Aug 4;11:1149. doi: 10.3389/fpls.2020.01149. eCollection 2020. Front Plant Sci. 2020. PMID: 32849707 Free PMC article. Review.
Cited by
-
Evaluation of genetic diversity and population structure of wheat core collection using SNP and KASP markers for major agronomic traits.BMC Plant Biol. 2025 Jul 12;25(1):904. doi: 10.1186/s12870-025-06926-8. BMC Plant Biol. 2025. PMID: 40646518 Free PMC article.
-
Effect of drought stress on natural rubber biosynthesis and quality in Taraxacum kok-saghyz roots.PLoS One. 2024 Jan 22;19(1):e0295694. doi: 10.1371/journal.pone.0295694. eCollection 2024. PLoS One. 2024. PMID: 38252676 Free PMC article.
-
Bacterial genome-wide association studies: exploring the genetic variation underlying bacterial phenotypes.Appl Environ Microbiol. 2025 Jun 18;91(6):e0251224. doi: 10.1128/aem.02512-24. Epub 2025 May 16. Appl Environ Microbiol. 2025. PMID: 40377303 Free PMC article. Review.
-
Genome-wide association mapping in safflower (Carthamus tinctorius L.) for genetic dissection of drought tolerance using DArTseq markers.Sci Rep. 2024 Dec 28;14(1):31490. doi: 10.1038/s41598-024-82932-4. Sci Rep. 2024. PMID: 39733113 Free PMC article.
-
Identification of quantitative trait loci and candidate genes underlying kernel traits of wheat (Triticum aestivum L.) in response to drought stress.Theor Appl Genet. 2025 Aug 19;138(9):216. doi: 10.1007/s00122-025-05001-y. Theor Appl Genet. 2025. PMID: 40828177
References
-
- Alipour H, Abdi H. Interactive effects of vernalization and photoperiod loci on phenological traits and grain yield and differentiation of Iranian wheat landraces and cultivars. J Plant Growth Regul. 2021;40(5):2105–2114.
-
- Rabieyan E, Bihamta MR, Moghaddam ME, Mohammadi V, Alipour H. Imaging-based screening of wheat seed characteristics towards distinguishing drought-responsive Iranian landraces and cultivars. Crop Pasture Sci. 2022;73(4):337–355.
-
- Rabieyan E, Bihamta MR, Moghaddam ME, Mohammadi V, Alipour H. Morpho-colorimetric seed traits for the discrimination, classification and prediction of yield in wheat genotypes under rainfed and well-watered conditions. Crop Pasture Sci. 2022;74(4):294–311.
-
- Alipour H, Rabieyan E. NGS-based multiplex assay of trait-linked molecular markers revealed the genetic diversity of Iranian bread wheat landraces and cultivars. Crop Pasture Sci. 2021;72(3):173–182.
MeSH terms
LinkOut - more resources
Full Text Sources
Research Materials
