

Sex differences in renal cell carcinoma: a single-cell analysis reveals exhausted CD8+ T-cells highly infiltrated in males
- PMID: 37715192
- PMCID: PMC10503187
- DOI: 10.1186/s13293-023-00540-9
Sex differences in renal cell carcinoma: a single-cell analysis reveals exhausted CD8+ T-cells highly infiltrated in males
Abstract
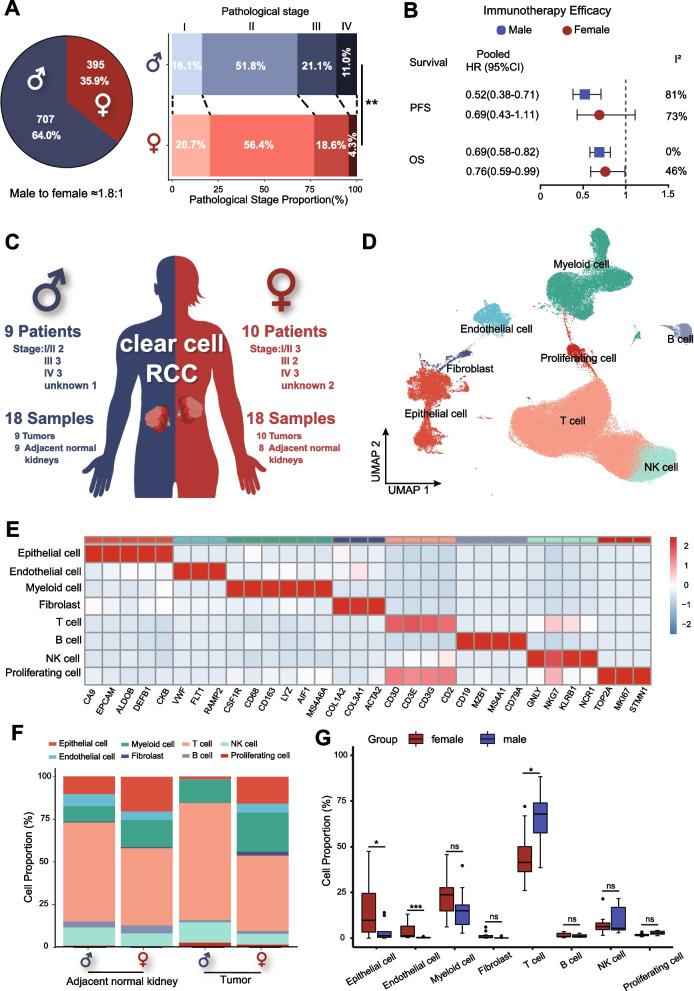
Background: Although sex bias has been reported in the development and progression of renal cell carcinoma (RCC), the underlying mechanisms remain enigmatic. Here, we investigated the sex differences in the tumor microenvironment (TME) of RCC and explored a promising combination drug regimen to enhance the efficacy of immunotherapy.
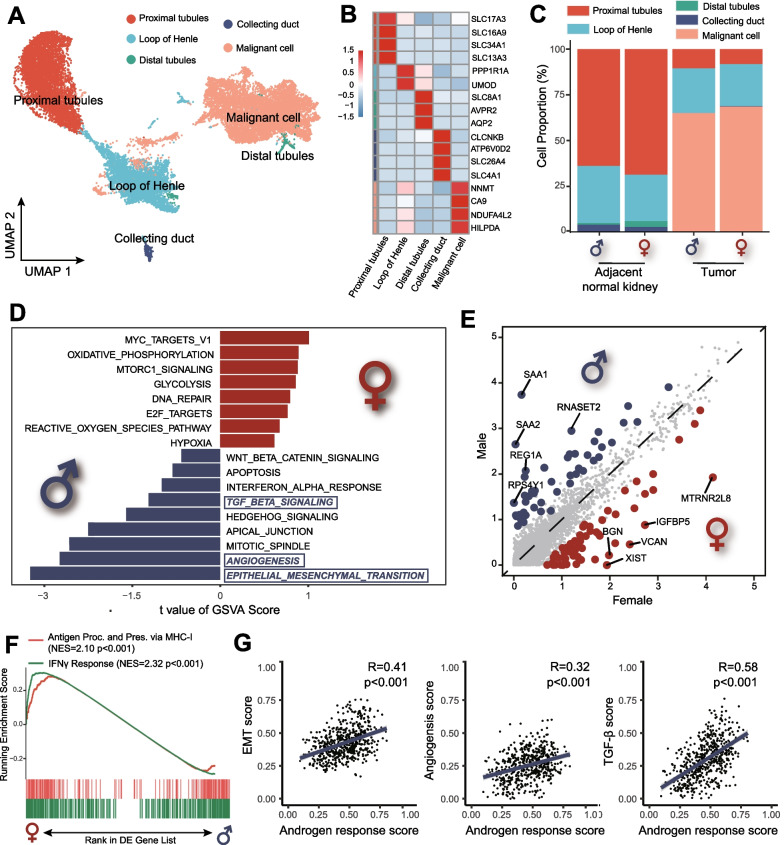
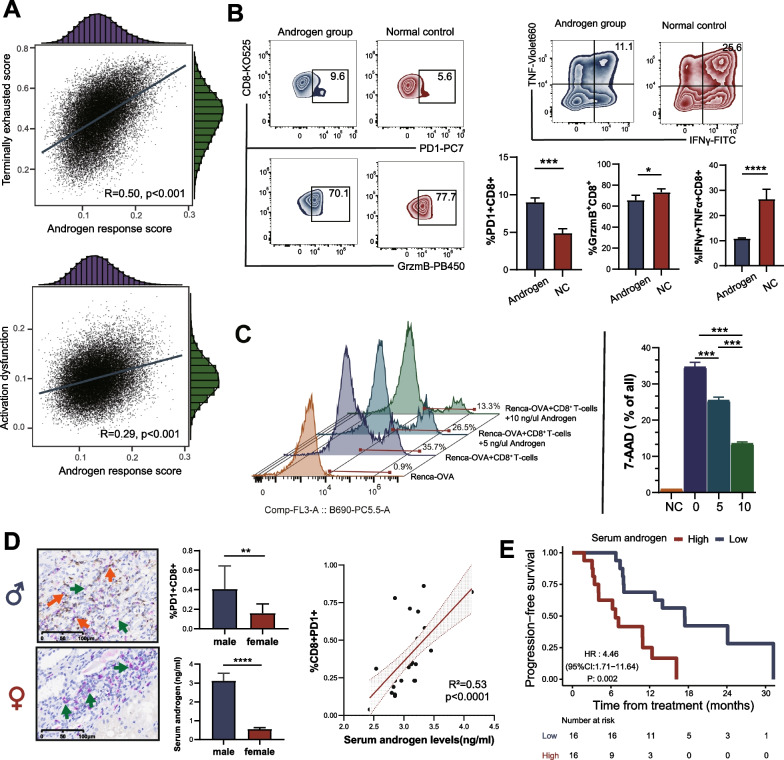
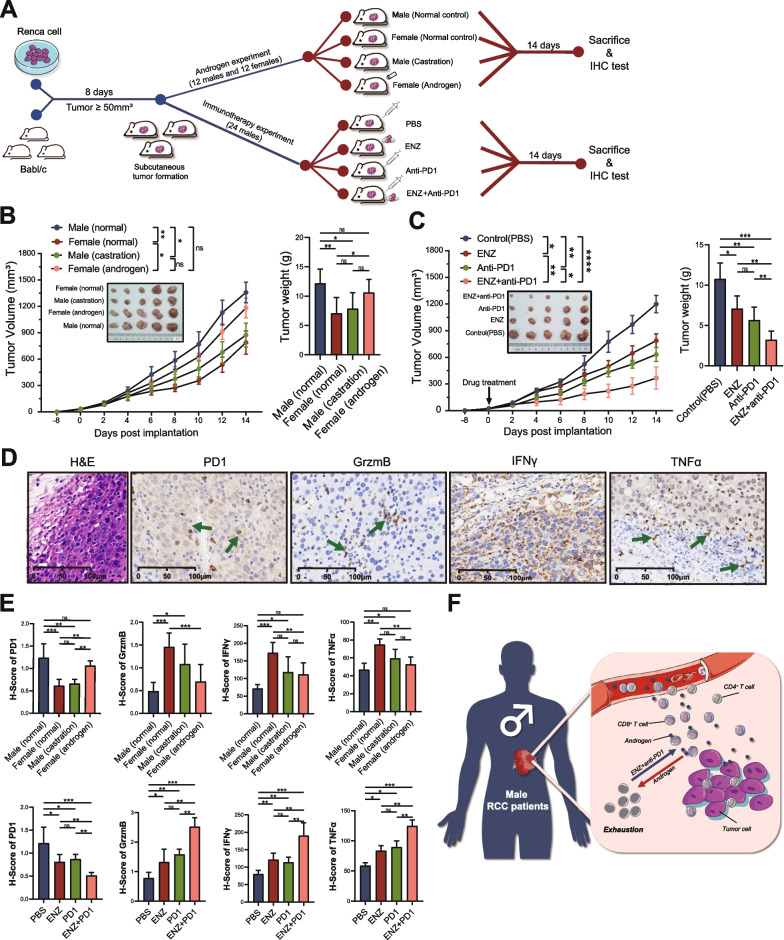
Methods: Single-cell RNA sequencing (scRNA-seq) data from four published datasets were analyzed to investigate the sex differences in RCC patients, and tumor tissues were collected to validate the sex differences using multiplex immunofluorescence (MxIF) and flow cytometry (FCM). The function of the androgen-androgen receptor axis in sex differences was explored in vivo and in vitro experiments.
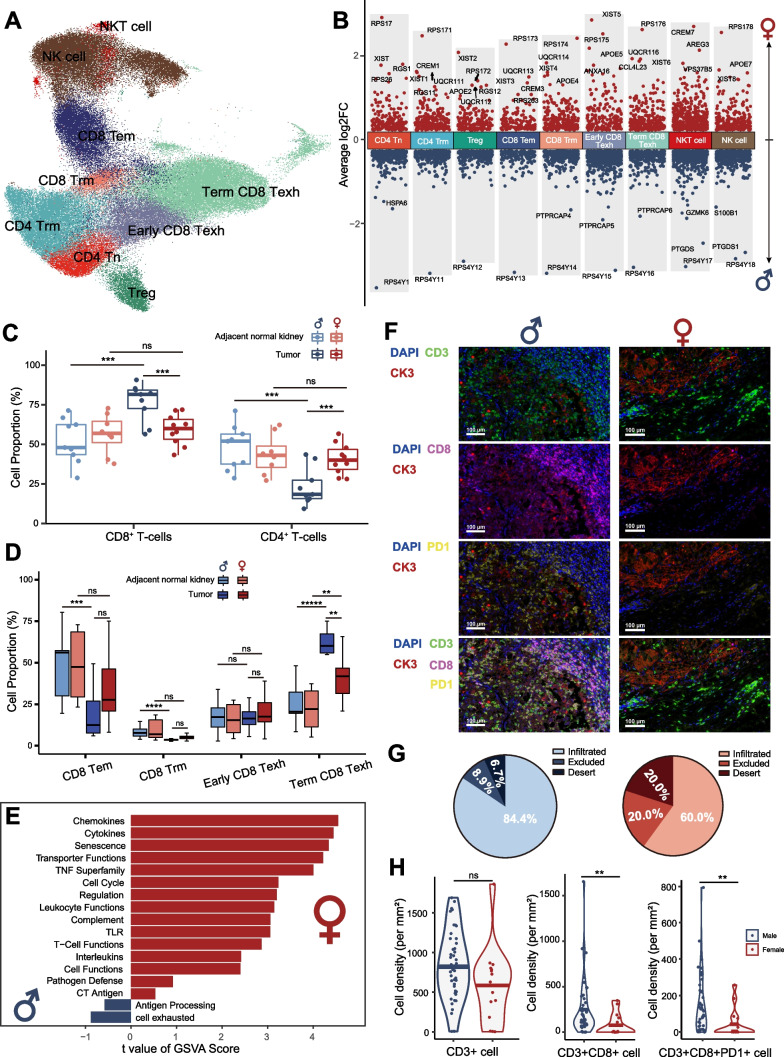
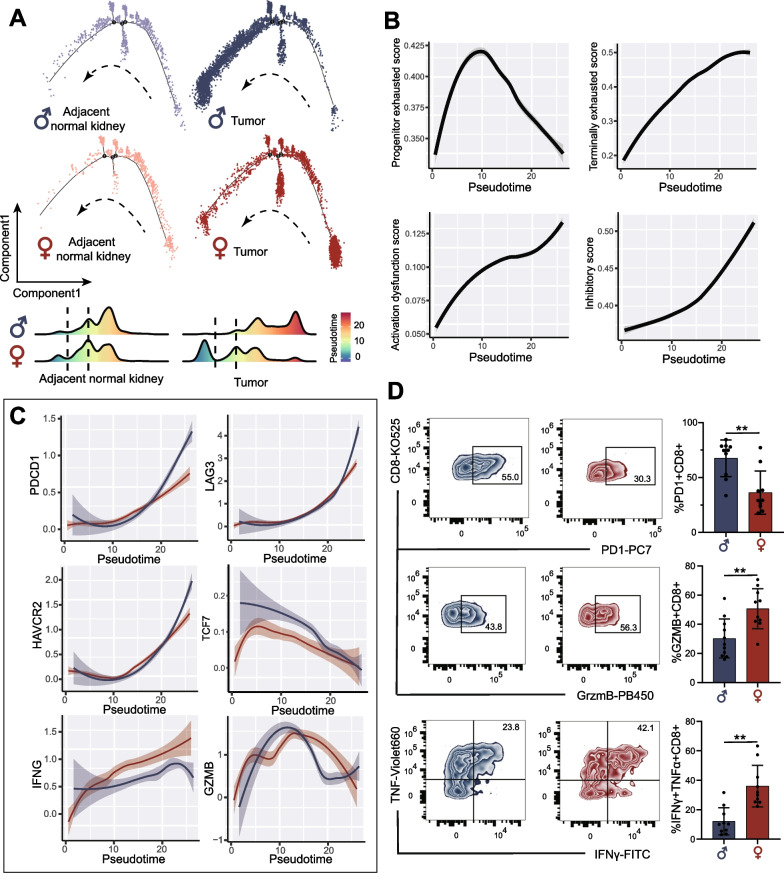
Results: Our analysis of scRNA-seq data from 220,156 cells, as well as MxIF and FCM assays, revealed that CD8+ T-cells infiltrated highly in the TME of male RCC, but were mostly in an exhausted and dysfunctional state. In vitro and in vivo experiments indicated that the dysfunction and exhaustion of CD8+ T-cells in male TME were induced by androgen. Clinically, higher serum androgen was significantly associated with a worse prognosis in male RCC patients receiving immunotherapy. Androgen receptor inhibitors could activate tumor-infiltrating CD8+ T-cells and enhance the efficacy of immunotherapy of RCC in vivo.
Conclusions: Our study delineated the difference in TME between male and female patients with RCC, and demonstrated that the androgen-androgen receptor axis plays an important role in immunosuppression in male RCC. Our findings suggest that androgen receptor inhibitors in combination with immunotherapy may be a promising treatment option for male RCC patients.
Keywords: Androgen; Exhaustion; Immunotherapy; Renal cell carcinoma; Sex bias; Single-cell transcriptomics; T-cell.
© 2023. Society for Women's Health Research and BioMed Central Ltd.
Conflict of interest statement
The authors declare no potential competing interests.
Figures
Similar articles
-
Single-cell transcriptomics reveals a low CD8+ T cell infiltrating state mediated by fibroblasts in recurrent renal cell carcinoma.J Immunother Cancer. 2022 Feb;10(2):e004206. doi: 10.1136/jitc-2021-004206. J Immunother Cancer. 2022. PMID: 35121646 Free PMC article.
-
A chemokine network of T cell exhaustion and metabolic reprogramming in renal cell carcinoma.Front Immunol. 2023 Mar 16;14:1095195. doi: 10.3389/fimmu.2023.1095195. eCollection 2023. Front Immunol. 2023. PMID: 37006314 Free PMC article.
-
Renal Cell Carcinoma-Infiltrating CD3low Vγ9Vδ1 T Cells Represent Potentially Novel Anti-Tumor Immune Players.Curr Issues Mol Biol. 2021 May 27;43(1):226-239. doi: 10.3390/cimb43010019. Curr Issues Mol Biol. 2021. PMID: 34071865 Free PMC article.
-
The tumour microenvironment and metabolism in renal cell carcinoma targeted or immune therapy.J Cell Physiol. 2021 Mar;236(3):1616-1627. doi: 10.1002/jcp.29969. Epub 2020 Aug 11. J Cell Physiol. 2021. PMID: 32783202 Review.
-
Reinvigorating exhausted CD8+ cytotoxic T lymphocytes in the tumor microenvironment and current strategies in cancer immunotherapy.Med Res Rev. 2021 Jan;41(1):156-201. doi: 10.1002/med.21727. Epub 2020 Aug 25. Med Res Rev. 2021. PMID: 32844499 Review.
Cited by
-
The influence of sex hormones on renal cell carcinoma.Ther Adv Med Oncol. 2024 Aug 21;16:17588359241269664. doi: 10.1177/17588359241269664. eCollection 2024. Ther Adv Med Oncol. 2024. PMID: 39175990 Free PMC article. Review.
-
Persistence and risk factors of occult hepatitis B virus infections among antiretroviral therapy-naïve people living with HIV in Botswana.Front Microbiol. 2024 May 9;15:1342862. doi: 10.3389/fmicb.2024.1342862. eCollection 2024. Front Microbiol. 2024. PMID: 38784816 Free PMC article.
-
Exploring the oncogenic potential of circSOD2 in clear cell renal cell carcinoma: a novel positive feedback loop.J Transl Med. 2024 Jun 27;22(1):596. doi: 10.1186/s12967-024-05290-9. J Transl Med. 2024. PMID: 38926764 Free PMC article.
-
A Novel Nomogram for the Prediction and Evaluation of Prognosis in Patients with Early-onset Kidney Cancer: a Population-based Study.J Cancer. 2025 Jan 13;16(4):1189-1201. doi: 10.7150/jca.104569. eCollection 2025. J Cancer. 2025. PMID: 39895778 Free PMC article.
-
The Role of Long Non-Coding RNF144A-AS1 in Cancer Progression.Cell Biochem Biophys. 2024 Sep;82(3):2007-2017. doi: 10.1007/s12013-024-01411-9. Epub 2024 Jul 16. Cell Biochem Biophys. 2024. PMID: 39014185 Review.
References
-
- May M, Aziz A, Zigeuner R, Chromecki T, Cindolo L, Schips L, et al. Gender differences in clinicopathological features and survival in surgically treated patients with renal cell carcinoma: an analysis of the multicenter CORONA database. World J Urol. 2013;31(5):1073–1080. doi: 10.1007/s00345-013-1071-x. - DOI - PubMed
Publication types
MeSH terms
Substances
LinkOut - more resources
Full Text Sources
Medical
Research Materials
