

Targeting FGFRs by pemigatinib induces G1 phase cell cycle arrest, cellular stress and upregulation of tumor suppressor microRNAs
- PMID: 37715207
- PMCID: PMC10504800
- DOI: 10.1186/s12967-023-04450-7
Targeting FGFRs by pemigatinib induces G1 phase cell cycle arrest, cellular stress and upregulation of tumor suppressor microRNAs
Abstract
Background: Fibroblast growth factor receptor (FGFR) gene family alterations are found in several cancers, indicating their importance as potential therapeutic targets. The FGFR-tyrosine kinase inhibitor (TKI) pemigatinib has been introduced in the treatment of advanced cholangiocarcinoma and more recently for relapsed or refractory myeloid/lymphoid neoplasms with FGFR2 and FGFR1 rearrangements, respectively. Several clinical trials are currently investigating the possible combination of pemigatinib with immunotherapy. In this study, we analyzed the biological and molecular effects of pemigatinib on different cancer cell models (lung, bladder, and gastric), which are currently objective of clinical trial investigations.
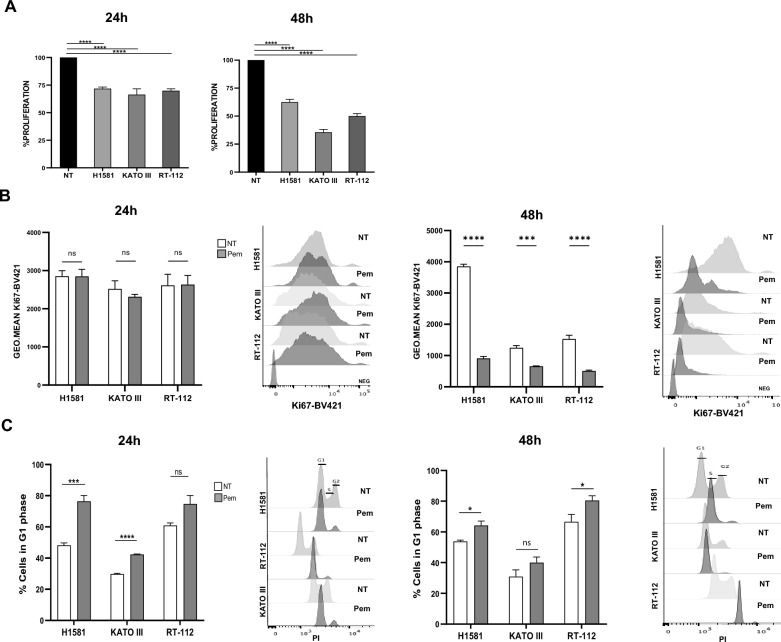
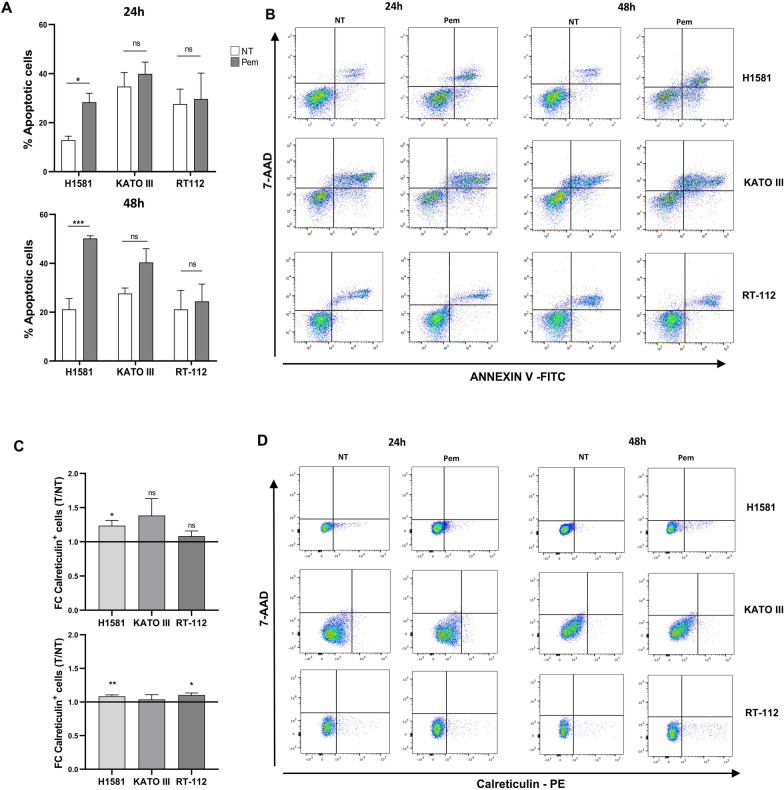
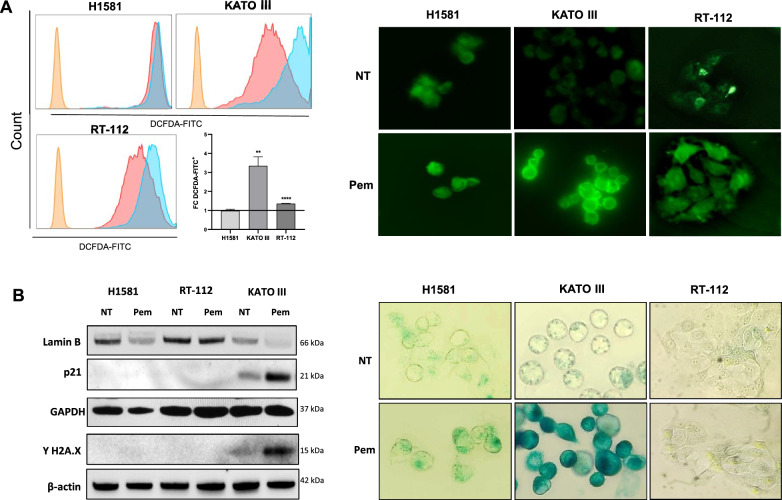
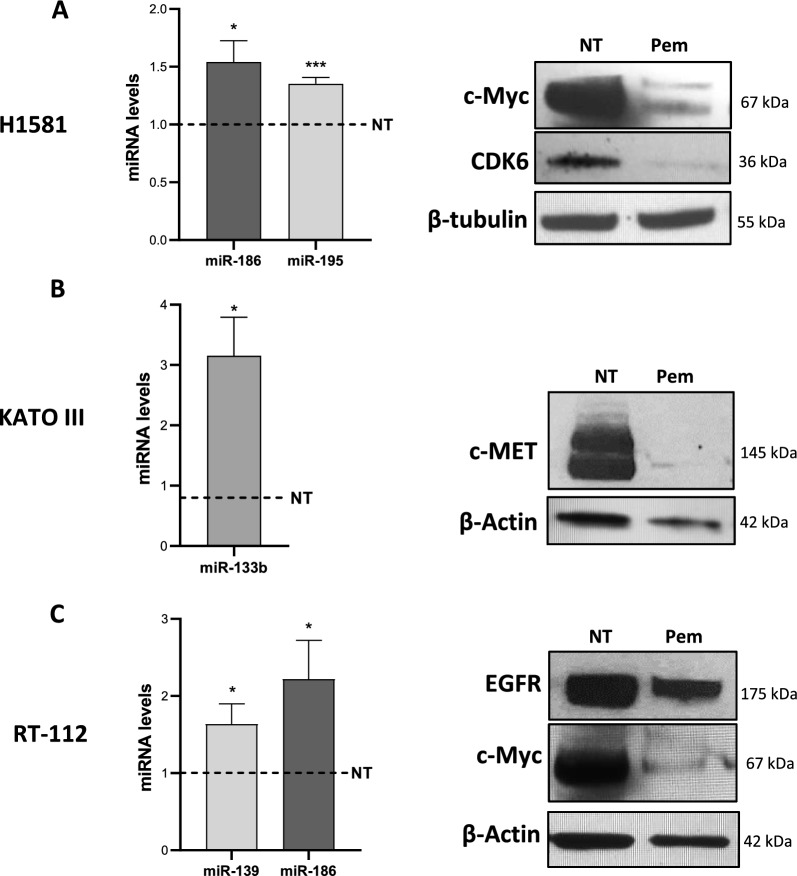
Methods: NCI-H1581 lung, KATO III gastric and RT-112 bladder cancer cell lines were evaluated for FGFR expression by qRT-PCR and Western blot. Cell lines were treated with Pem and then characterized for cell proliferation, apoptosis, production of intracellular reactive oxygen species (ROS), and induction of senescence. The expression of microRNAs with tumor suppressor functions was analyzed by qRT-PCR, while modulation of the proteins coded by their target genes was evaluated by Western blot and mRNA. Descriptive statistics was used to analyze the various data and student's t test to compare the analysis of two groups.
Results: Pemigatinib exposure triggered distinct signaling pathways and reduced the proliferative ability of all cancer cells, inducing G1 phase cell cycle arrest and strong intracellular stress resulting in ROS production, senescence and apoptosis. Pemigatinib treatment also caused the upregulation of microRNAs (miR-133b, miR-139, miR-186, miR-195) with tumor suppressor functions, along with the downregulation of validated protein targets with oncogenic roles (c-Myc, c-MET, CDK6, EGFR).
Conclusions: These results contribute to clarifying the biological effects and molecular mechanisms mediated by the anti-FGFR TKI pemigatinib in distinct tumor settings and support its exploitation for combined therapies.
Keywords: Apoptosis; Calreticulin; Cell cycle arrest; Cellular stress; FGFR; Pemigatinib; ROS; Senescence; TKI; miRNA.
© 2023. BioMed Central Ltd., part of Springer Nature.
Conflict of interest statement
The authors have declared that no conflict of interest exists.
Figures

Similar articles
-
Precision oncology targeting FGFRs: A systematic review on pre-clinical activity and clinical outcomes of pemigatinib.Crit Rev Oncol Hematol. 2024 Oct;202:104464. doi: 10.1016/j.critrevonc.2024.104464. Epub 2024 Jul 31. Crit Rev Oncol Hematol. 2024. PMID: 39094670
-
Exposure-response analyses of pemigatinib in patients with myeloid/lymphoid neoplasms with fibroblast growth factor receptor 1 rearrangement.J Chemother. 2025 Apr 29:1-7. doi: 10.1080/1120009X.2025.2497641. Online ahead of print. J Chemother. 2025. PMID: 40298451
-
[Pharmacological characteristics and clinical study results of Pemigatinib (Pemazyre® Tablets), a selective fibroblast growth factor receptor (FGFR) inhibitor].Nihon Yakurigaku Zasshi. 2021;156(6):392-402. doi: 10.1254/fpj.21087. Nihon Yakurigaku Zasshi. 2021. PMID: 34719574 Japanese.
-
MicroRNA-198 inhibits proliferation and induces apoptosis by directly suppressing FGFR1 in gastric cancer.Biosci Rep. 2019 Jun 10;39(6):BSR20181258. doi: 10.1042/BSR20181258. Print 2019 Jun 28. Biosci Rep. 2019. PMID: 31138759 Free PMC article.
-
Pemigatinib in cholangiocarcinoma with a FGFR2 rearrangement or fusion.Expert Rev Anticancer Ther. 2022 Dec;22(12):1265-1274. doi: 10.1080/14737140.2022.2150168. Epub 2022 Nov 23. Expert Rev Anticancer Ther. 2022. PMID: 36408971 Review.
Cited by
-
MicroRNA 195, lactate dehydrogenase 5, phosphatase and tensin homologue in colorectal cancer: Clinicopathology and prognosis.World J Gastrointest Surg. 2025 Jul 27;17(7):107121. doi: 10.4240/wjgs.v17.i7.107121. World J Gastrointest Surg. 2025. PMID: 40740902 Free PMC article.
-
Exosomal microRNAs in lung cancer: a narrative review.Transl Cancer Res. 2024 Jun 30;13(6):3090-3105. doi: 10.21037/tcr-23-2319. Epub 2024 Jun 13. Transl Cancer Res. 2024. PMID: 38988916 Free PMC article. Review.
-
DARS2 Promotes Bladder Cancer Progression by Enhancing PINK1-Mediated Mitophagy.Int J Biol Sci. 2025 Jan 27;21(4):1530-1544. doi: 10.7150/ijbs.107632. eCollection 2025. Int J Biol Sci. 2025. PMID: 39990673 Free PMC article.
-
Aberrant angiogenic signaling in HCC: therapeutic targeting and drug resistance.Front Oncol. 2025 Jun 18;15:1595195. doi: 10.3389/fonc.2025.1595195. eCollection 2025. Front Oncol. 2025. PMID: 40606973 Free PMC article. Review.
-
FGFR inhibition as a new therapeutic strategy to sensitize glioblastoma stem cells to tumor treating fields.Cell Death Discov. 2025 Jun 4;11(1):265. doi: 10.1038/s41420-025-02542-5. Cell Death Discov. 2025. PMID: 40467542 Free PMC article.
References
-
- Aleksakhina SN, Kramchaninov MM, Mikushina AD, Kubrina SE, Petkau VV, Ivantsov AO, et al. CCND1 and FGFR1 gene amplifications are associated with reduced benefit from aromatase inhibitors in metastatic breast cancer. Clin Transl Oncol. 2021;23:874–881. doi: 10.1007/s12094-020-02481-w. - DOI - PubMed
Publication types
MeSH terms
Substances
LinkOut - more resources
Full Text Sources
Research Materials
Miscellaneous
