

Meta-analysis of integrated ChIP-seq and transcriptome data revealed genomic regions affected by estrogen receptor alpha in breast cancer
- PMID: 37715225
- PMCID: PMC10503144
- DOI: 10.1186/s12920-023-01655-z
Meta-analysis of integrated ChIP-seq and transcriptome data revealed genomic regions affected by estrogen receptor alpha in breast cancer
Abstract
Background: The largest group of patients with breast cancer are estrogen receptor-positive (ER+) type. The estrogen receptor acts as a transcription factor and triggers cell proliferation and differentiation. Hence, investigating ER-DNA interaction genomic regions can help identify genes directly regulated by ER and understand the mechanism of ER action in cancer progression.
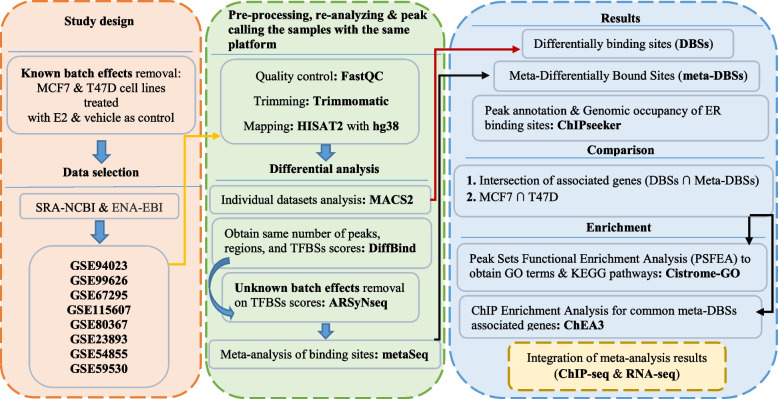
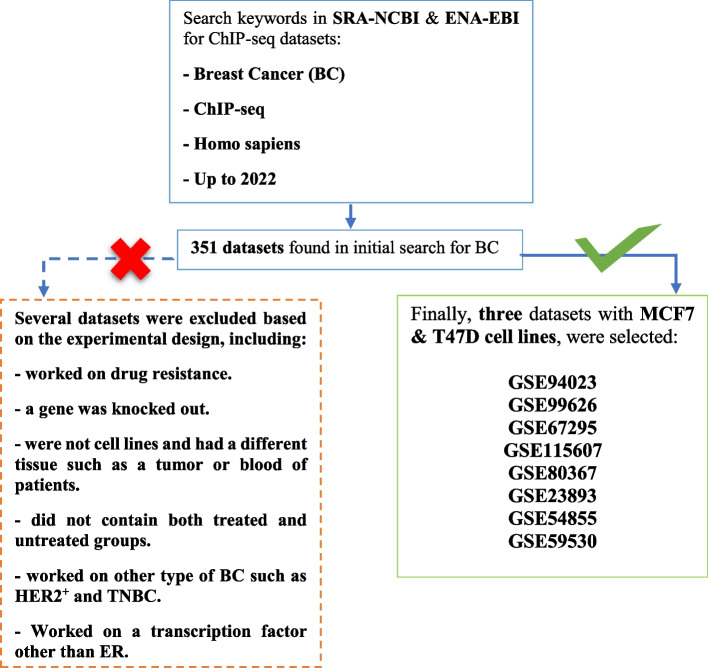
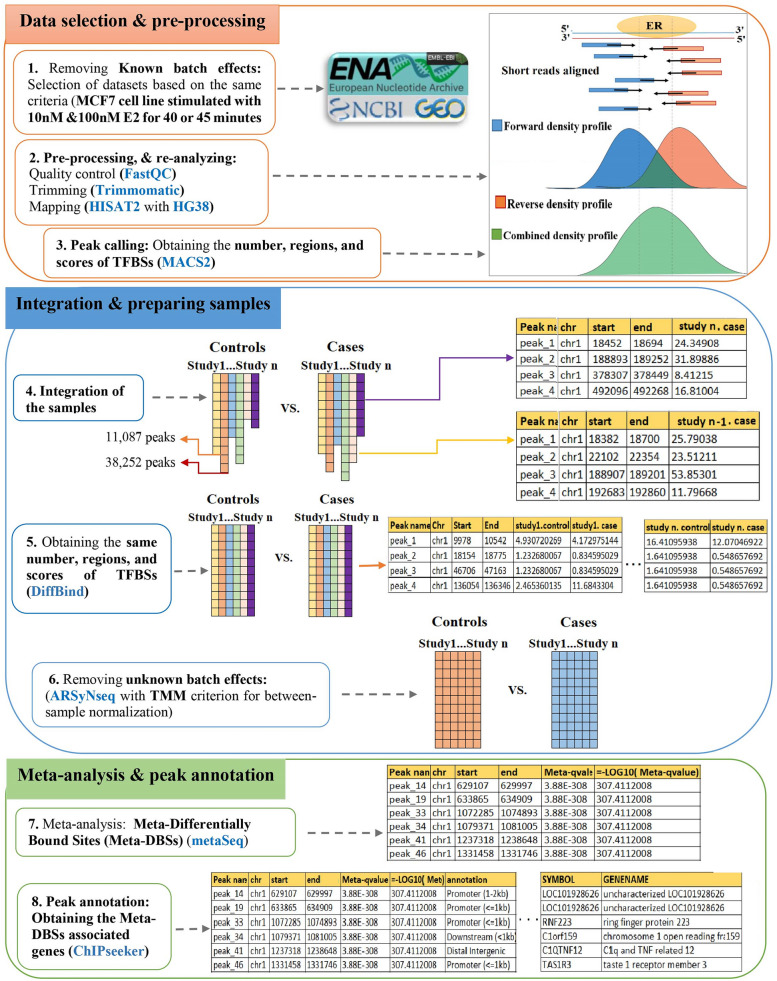
Methods: In the present study, we employed a workflow to do a meta-analysis of ChIP-seq data of ER+ cell lines stimulated with 10 nM and 100 nM of E2. All publicly available data sets were re-analyzed with the same platform. Then, the known and unknown batch effects were removed. Finally, the meta-analysis was performed to obtain meta-differentially bound sites in estrogen-treated MCF7 cell lines compared to vehicles (as control). Also, the meta-analysis results were compared with the results of T47D cell lines for more precision. Enrichment analyses were also employed to find the functional importance of common meta-differentially bound sites and associated genes among both cell lines.
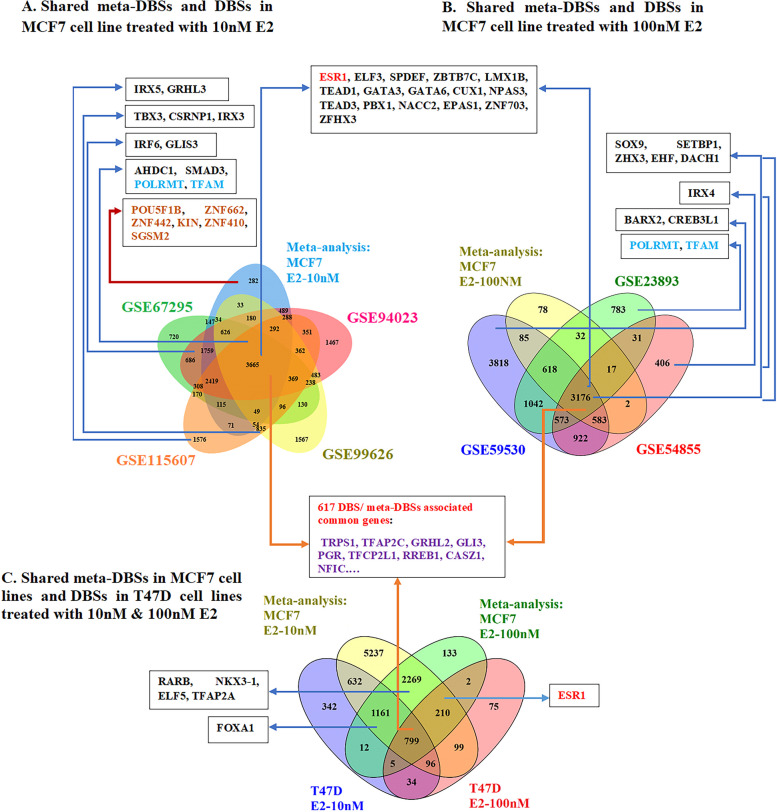
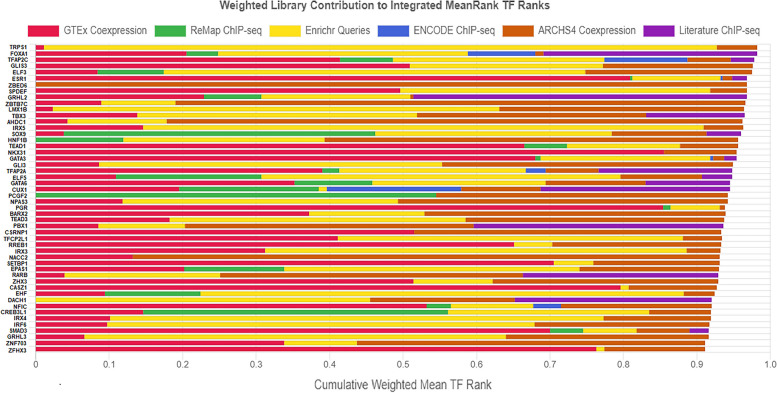
Results: Remarkably, POU5F1B, ZNF662, ZNF442, KIN, ZNF410, and SGSM2 transcription factors were recognized in the meta-analysis but not in individual studies. Enrichment of the meta-differentially bound sites resulted in the candidacy of pathways not previously reported in breast cancer. PCGF2, HNF1B, and ZBED6 transcription factors were also predicted through the enrichment analysis of associated genes. In addition, comparing the meta-analysis results of both ChIP-seq and RNA-seq data showed that many transcription factors affected by ER were up-regulated.
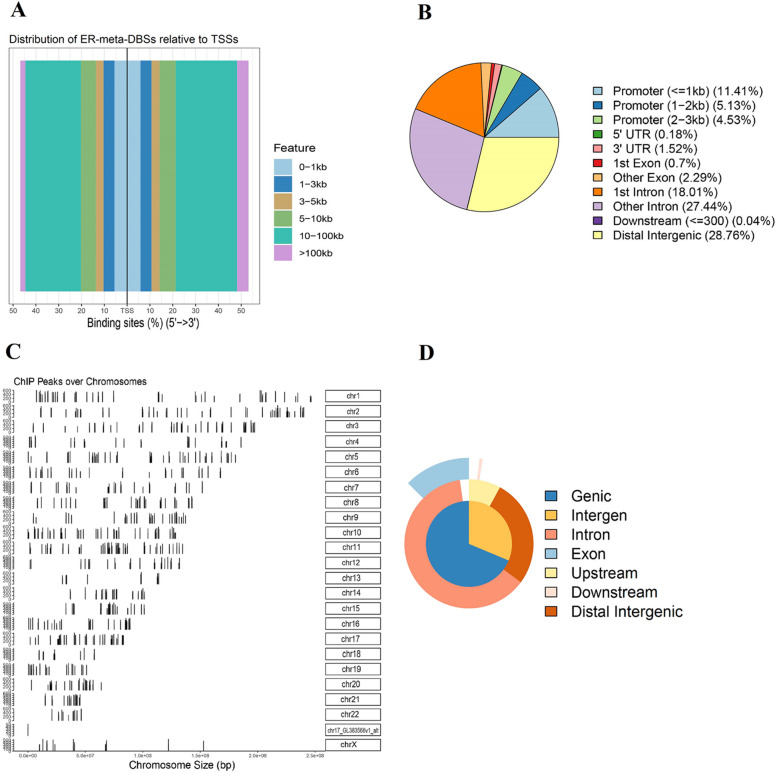
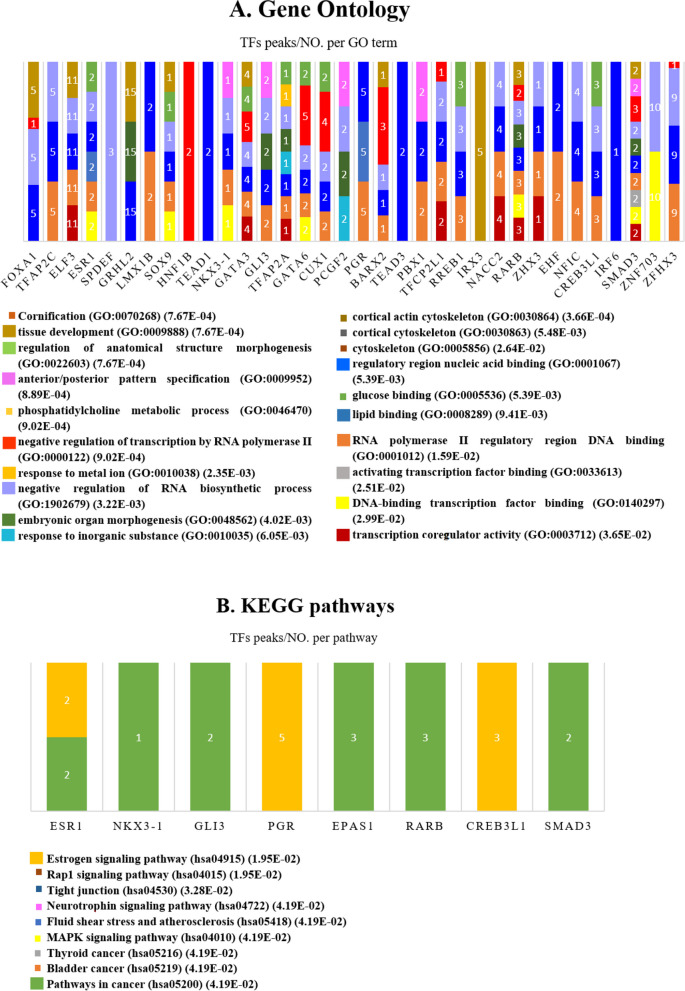
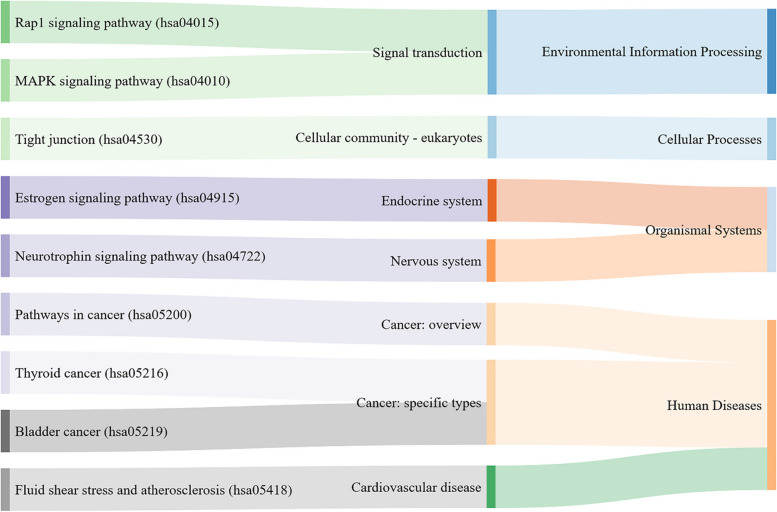
Conclusion: The meta-analysis of ChIP-seq data of estrogen-treated MCF7 cell line leads to the identification of new binding sites of ER that have not been previously reported. Also, enrichment of the meta-differentially bound sites and their associated genes revealed new terms and pathways involved in the development of breast cancer which should be examined in future in vitro and in vivo studies.
Keywords: Breast cancer; ChIP-seq; Estrogen receptor-positive; MCF7/T47D cell lines; Meta-analysis; RNA-seq.
© 2023. BioMed Central Ltd., part of Springer Nature.
Conflict of interest statement
The authors declare no competing interests.
Figures
Similar articles
-
Nonlinear relationship between chromatin accessibility and estradiol-regulated gene expression.Oncogene. 2021 Feb;40(7):1332-1346. doi: 10.1038/s41388-020-01607-2. Epub 2021 Jan 8. Oncogene. 2021. PMID: 33420376
-
Non-coding single nucleotide variants affecting estrogen receptor binding and activity.Genome Med. 2016 Dec 13;8(1):128. doi: 10.1186/s13073-016-0382-0. Genome Med. 2016. PMID: 27964748 Free PMC article.
-
The EstroGene Database Reveals Diverse Temporal, Context-Dependent, and Bidirectional Estrogen Receptor Regulomes in Breast Cancer.Cancer Res. 2023 Aug 15;83(16):2656-2674. doi: 10.1158/0008-5472.CAN-23-0539. Cancer Res. 2023. PMID: 37272757 Free PMC article.
-
Hormone-regulated transcriptomes: lessons learned from estrogen signaling pathways in breast cancer cells.Mol Cell Endocrinol. 2014 Jan 25;382(1):652-664. doi: 10.1016/j.mce.2013.06.021. Epub 2013 Jun 28. Mol Cell Endocrinol. 2014. PMID: 23810978 Free PMC article. Review.
-
[Estrogens, cathepsin D and metastasis in cancers of the breast and ovary: invasion or proliferation?].C R Seances Soc Biol Fil. 1998;192(2):241-51. C R Seances Soc Biol Fil. 1998. PMID: 9841098 Review. French.
Cited by
-
Comprehensive functional annotation of ESR1-driven enhancers in breast cancer reveals hierarchical activity independent of genomic and epigenomic contexts.Genome Res. 2025 Jul 1;35(7):1530-1543. doi: 10.1101/gr.280320.124. Genome Res. 2025. PMID: 40494627
-
Promoter Hyper-methylation of ZNF662 Restrains its Tumor Suppressing Function in Triple-Negative Breast Cancer Through Regulating NGF Signaling Axis.Int J Biol Sci. 2025 Jun 12;21(9):4081-4097. doi: 10.7150/ijbs.102940. eCollection 2025. Int J Biol Sci. 2025. PMID: 40612670 Free PMC article.
-
Decoding sex differences in human immunity through systems immunology.Oxf Open Immunol. 2025 Jul 4;6(1):iqaf006. doi: 10.1093/oxfimm/iqaf006. eCollection 2025. Oxf Open Immunol. 2025. PMID: 40692743 Free PMC article. Review.
References
Publication types
MeSH terms
Substances
LinkOut - more resources
Full Text Sources
Medical
