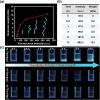
Visualizing Chain Growth of Polytelluoxane via Polymerization Induced Emission
- PMID: 37715281
- PMCID: PMC10625080
- DOI: 10.1002/advs.202304518
Visualizing Chain Growth of Polytelluoxane via Polymerization Induced Emission
Abstract
Visualizing polymer chain growth is always a hot topic for tailoring structure-function properties in polymer chemistry. However, current characterization methods are limited in their ability to differentiate the degree of polymerization in real-time without isolating the samples from the reaction vessel, let alone to detect insoluble polymers. Herein, a reliable relationship is established between polymer chain growth and fluorescence properties through polymerization induced emission. (TPE-C2)2 -Te is used to realize in situ oxidative polymerization, leading to the aggregation of fluorophores. The relationship between polymerization degree of growing polytelluoxane (PTeO) and fluorescence intensity is constructed, enabling real-time monitoring of the polymerization reaction. More importantly, this novel method can be further applied to the observation of the polymerization process for growing insoluble polymer via surface polymerization. Therefore, the development of visualization technology will open a new avenue for visualizing polymer chain growth in real-time, regardless of polymer solubility.
Keywords: oxidative polymerization; polymerization induced emission; polytelluoxane; visual monitoring.
© 2023 The Authors. Advanced Science published by Wiley-VCH GmbH.
Conflict of interest statement
The authors declare no conflict of interest.
Figures


Similar articles
-
Assembly Regulates Gamma Radiation Polymerization of Polytelluoxane.Angew Chem Int Ed Engl. 2025 Jan 15;64(3):e202415811. doi: 10.1002/anie.202415811. Epub 2024 Nov 2. Angew Chem Int Ed Engl. 2025. PMID: 39289789
-
Polymer Molecular Weight Determination via Fluorescence Lifetime.J Am Chem Soc. 2022 Dec 14;144(49):22416-22420. doi: 10.1021/jacs.2c10036. Epub 2022 Dec 2. J Am Chem Soc. 2022. PMID: 36459633
-
Visualization of Atom Transfer Radical Polymerization by Aggregation-Induced Emission Technology.Chem Asian J. 2020 Apr 1;15(7):1014-1017. doi: 10.1002/asia.202000071. Epub 2020 Mar 4. Chem Asian J. 2020. PMID: 32012458
-
Aggregation-Induced Emission Boosting the Study of Polymer Science.Macromol Rapid Commun. 2022 Aug;43(16):e2200080. doi: 10.1002/marc.202200080. Epub 2022 Apr 1. Macromol Rapid Commun. 2022. PMID: 35320607 Review.
-
Surface active properties of polyoxyethylene macromonomers and their role in radical polymerization in disperse systems.Adv Colloid Interface Sci. 2000 Dec 26;88(3):295-357. doi: 10.1016/s0001-8686(99)00025-1. Adv Colloid Interface Sci. 2000. PMID: 11130017 Review.
References
-
- a) Mieras H. J. M. A., Rijn C. F. H. V., Nature 1969, 224, 165;
- b) Charlesby A., Nature 1954, 173, 679; - PubMed
- c) Gentekos D. T., Sifri R. J., Fors B. P., Nat. Rev. Mater. 2019, 4, 761;
- d) McAfee T., Leonardi N., Montgomery R., Siqueira J., Zekoski T., Drenski M. F., Reed W. F., Macromolecules 2016, 49, 7170;
- e) Mozharov S., Nordon A., Littlejohn D., Wiles C., Watts P., Dallin P., Girkin J. M., J. Am. Chem. Soc. 2011, 133, 3601; - PubMed
- f) Lu J., Xu Z., Fu H., Lin Y., Wang H., Lu H., J. Am. Chem. Soc. 2022, 144, 15709; - PubMed
- g) Shi Q. Q., Yin H., Song R. D., Xu J., Tan J. J., Zhou X., Cen J., Deng Z. Y., Tong H. M., Cui C. H., Zhang Y. F., Li X. P., Zhang Z. B., Liu S. Y., Nat. Chem. 2023, 15, 257. - PubMed
-
- a) Li H., Jin B., Wang Y., Deng B., Wang D., Tang B. Z., Adv. Mater. 2023, 35, 2210085; - PubMed
- b) Patel K., Chikkali S. H., Sivaram S., Prog. Polym. Sci. 2020, 109, 101290;
- c) Baick I. H., Ye Y., Luciani C. V., Ahn Y. G., Song K. H., Choi K. Y., Ind. Eng. Chem. Res. 2013, 52, 17419;
- d) Knop K., Hoogenboom R., Fischer D., Schubert U. S., Angew. Chem., Int. Ed. 2010, 49, 6288; - PubMed
- e) Wu X., Lin H., Dai F., Hu R., Tang B. Z., CCS Chem 2020, 2, 191;
- f) Dai X., Wu Y., Liang Q., Yang J., Huang L., Kong J., Hao J., Adv. Funct. Mater. 2023, 2304415.
-
- a) Deplancke T., Lame O., Rousset F., Seguela R., Vigier G., Macromolecules 2015, 48, 5328;
- b) Kida T., Hiejima Y., Nitta K.‐h., Macromolecules 2021, 54, 225.
-
- a) IV A. G., Blum S. A., J. Am. Chem. Soc. 2022, 144, 22416; - PubMed
- b) Xia J., Zhao P., Pan S., Xu H., ACS Macro Lett. 2019, 8, 629; - PubMed
- c) Song B., Bai T., Liu D., Hu R., Lu D., Qin A., Ling J., Tang B. Z., CCS Chem 2022, 4, 237;
- d) Zou C., Wang Q., Si G. F., Chen C. L., Nat. Commun. 2023, 14, 1442. - PMC - PubMed
-
- a) Deng Y., Zhang Q., Qu D. H., Tian H., Feringa B. L., Angew. Chem., Int. Ed. 2022, 61, e202209100; - PMC - PubMed
- b) Xu T. Y., Tong F., Xu H., Wang M. Q., Tian H., Qu D. H., J. Am. Chem. Soc. 2022, 144, 6278; - PubMed
- c) Miyauchi M., Takashima Y., Yamaguchi H., Harada A., J. Am. Chem. Soc. 2005, 127, 2984; - PubMed
- d) Lee D. C., Kensy V. K., Maroon C. R., Long B. K., Boydston A. J., Angew. Chem., Int. Ed. 2019, 131, 5695.
Grants and funding
LinkOut - more resources
Full Text Sources
Miscellaneous
