

Association of immune-related expression profile with sensitivity to chemotherapy in esophageal squamous cell carcinoma
- PMID: 37715346
- PMCID: PMC10637075
- DOI: 10.1111/cas.15942
Association of immune-related expression profile with sensitivity to chemotherapy in esophageal squamous cell carcinoma
Abstract
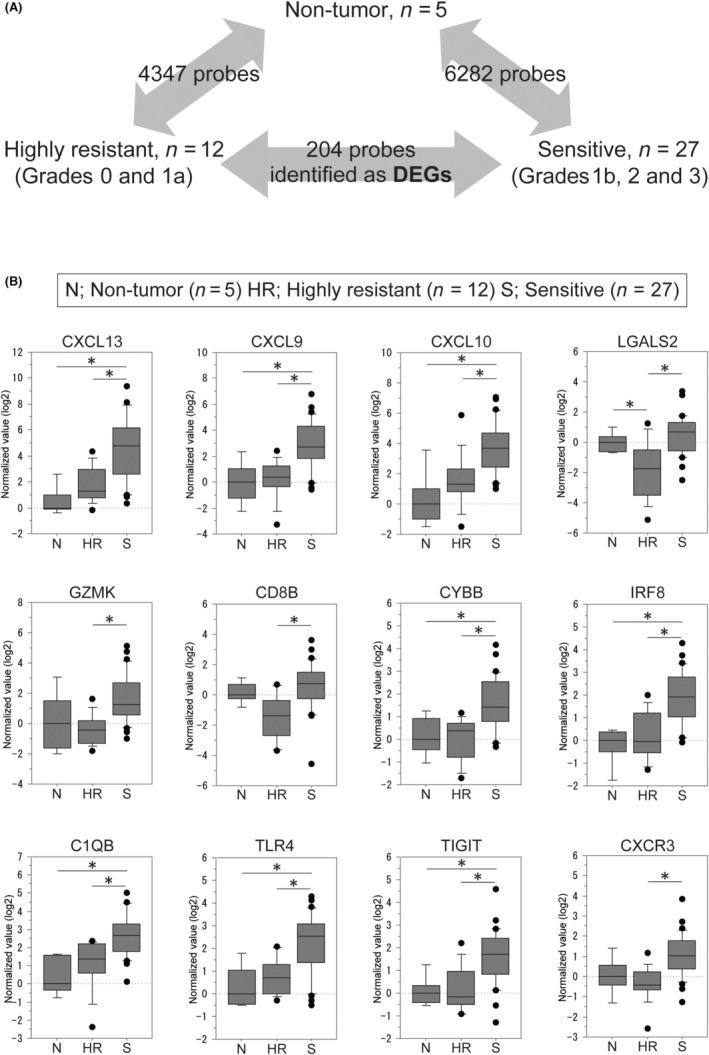
Neoadjuvant chemotherapy (NAC) followed by surgery is one of the standard therapeutic approaches in Japan for patients with locally advanced esophageal carcinoma. Recently, the JCOG1109 study revealed that NAC with docetaxel, cisplatin and 5-fluorouracil (5-FU) (DCF-NAC) is superior to NAC with cisplatin and 5-FU, and has now become the standard preoperative chemotherapy. Using a microarray system, we have previously investigated the expression profiles of endoscopic biopsy samples from patients with esophageal squamous cell carcinoma (ESCC) before DCF-NAC (preNAC) and identified 17 molecules as biomarkers predictive of a pathologically complete response to DCF-NAC. Here, we re-grouped our previous dataset based on the histopathological response grade with the addition of several microarray profiles and conducted a re-analysis using bioinformatic web tools including DAVID, GSEA, UALCAN, and CIBERSORTx. We identified 204 genes that were differentially expressed between the highly resistant and sensitive groups. Some of these differentially expressed genes (DEGs) were related to the immune response and showed higher expression in the sensitive group. UALCAN showed that high expression of 28 of the top 50 DEGs was associated with a favorable prognosis (p < 0.25), and that this reached a significant (p < 0.05) level for 18 of them, suggesting that patients with high expression of these genes might have benefited from chemotherapy and thus had a better outcome. In preNAC biopsy tissues from a DCF-sensitive case, we demonstrated the presence of cells expressing mRNA for CXCL9, one of the prognosis-related DEGs. Our results highlight the association of immune-related expression profile in preNAC ESCC with the DCF-NAC efficacy.
Keywords: biomarker; esophageal squamous cell carcinoma; immune-related expression profile; microarray; neoadjuvant chemotherapy.
© 2023 The Authors. Cancer Science published by John Wiley & Sons Australia, Ltd on behalf of Japanese Cancer Association.
Conflict of interest statement
The authors have no conflict of interest.
Figures


Similar articles
-
Neoadjuvant chemotherapy of triplet regimens of docetaxel/cisplatin/5-FU (DCF NAC) may improve patient prognosis of cStage II/III esophageal squamous cell carcinoma-propensity score analysis.Gen Thorac Cardiovasc Surg. 2016 Apr;64(4):209-15. doi: 10.1007/s11748-016-0626-3. Epub 2016 Feb 11. Gen Thorac Cardiovasc Surg. 2016. PMID: 26868531 Clinical Trial.
-
Implication of changes in PD-L1 expression during neoadjuvant chemotherapy with docetaxel, cisplatin, and 5-fluorouracil (DCF) regimen in esophageal squamous cell carcinoma.Esophagus. 2023 Apr;20(2):281-289. doi: 10.1007/s10388-022-00976-9. Epub 2022 Dec 9. Esophagus. 2023. PMID: 36484900
-
Prognostic Advantage of Docetaxel/Cisplatin/ 5-Fluorouracil Neoadjuvant Chemotherapy in Clinical Stage II/III Esophageal Squamous Cell Carcinoma due to Excellent Control of Preoperative Disease and Postoperative Lymph Node Recurrence.Oncology. 2017;92(4):221-228. doi: 10.1159/000455128. Epub 2017 Jan 21. Oncology. 2017. PMID: 28110330
-
Docetaxel, Cisplatin, and 5-FU Triplet Therapy as Conversion Therapy for Locoregionally Advanced Unresectable Esophageal Squamous Cell Carcinoma.Ann Surg Oncol. 2023 Feb;30(2):861-870. doi: 10.1245/s10434-022-12694-8. Epub 2022 Oct 28. Ann Surg Oncol. 2023. PMID: 36307666 Review.
-
Associations between vascular endothelial growth factor polymorphisms and response to 5-FU-based pharmaceutical therapy in esophageal squamous cell carcinoma: A meta-analysis.Tumori. 2025 Apr;111(2):112-120. doi: 10.1177/03008916251322057. Epub 2025 Feb 26. Tumori. 2025. PMID: 40012106 Review.
Cited by
-
Radiation dose escalation in locally advanced oesophageal cancer: a systematic review and hierarchical Bayesian meta-analysis.EClinicalMedicine. 2025 Aug 13;87:103432. doi: 10.1016/j.eclinm.2025.103432. eCollection 2025 Sep. EClinicalMedicine. 2025. PMID: 40838203 Free PMC article.
References
-
- Cancer IAfRo . Cancer Today. https://gco.iarc.fr/today/home
-
- Matsuda S, Kitagawa Y, Takemura R, et al. Real‐world evaluation of the efficacy of neoadjuvant DCF over CF in esophageal squamous cell carcinoma: propensity score matched analysis from 85 authorized Institutes for Esophageal Cancer in Japan. Ann Surg. 2022;278:e35‐e42. - PubMed
-
- Nishiwaki N, Noma K, Kunitomo T, et al. Neoadjuvant chemotherapy for locally advanced esophageal cancer comparing cisplatin and 5‐fluorouracil versus docetaxel plus cisplatin and 5‐fluorouracil: a propensity score matching analysis. Esophagus. 2022;19:626‐638. - PubMed
MeSH terms
Substances
Grants and funding
LinkOut - more resources
Full Text Sources
Medical
Molecular Biology Databases
Research Materials
