. 2023 Sep;13(9):e1389.
doi: 10.1002/ctm2.1389.

METTL3-mediated N6-methyladenosine exacerbates ferroptosis via m6A-IGF2BP2-dependent mitochondrial metabolic reprogramming in sepsis-induced acute lung injury

Affiliations

METTL3-mediated N6-methyladenosine exacerbates ferroptosis via m6A-IGF2BP2-dependent mitochondrial metabolic reprogramming in sepsis-induced acute lung injury

Hao Zhang et al. Clin Transl Med. 2023 Sep.

Abstract

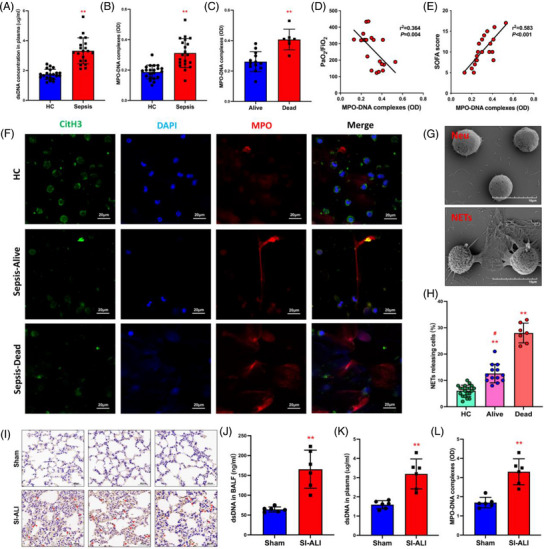
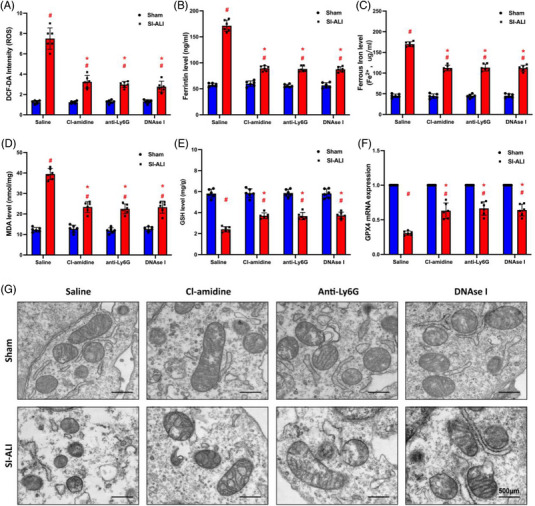
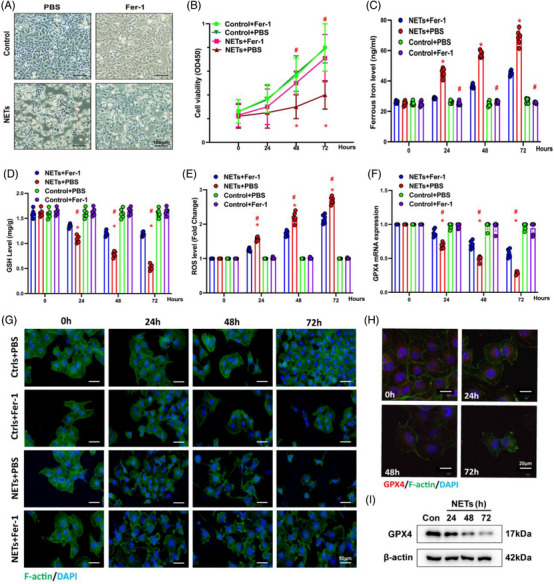
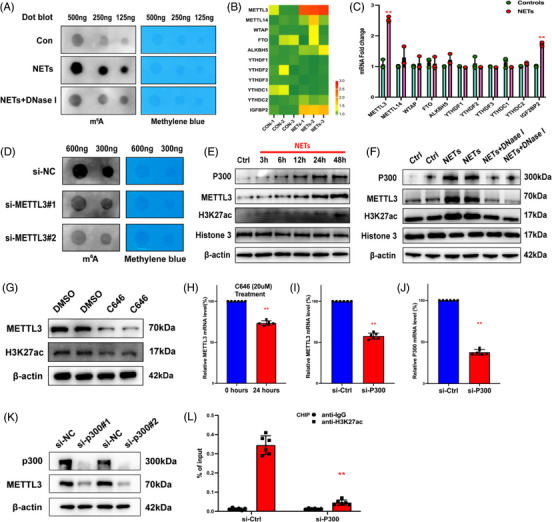
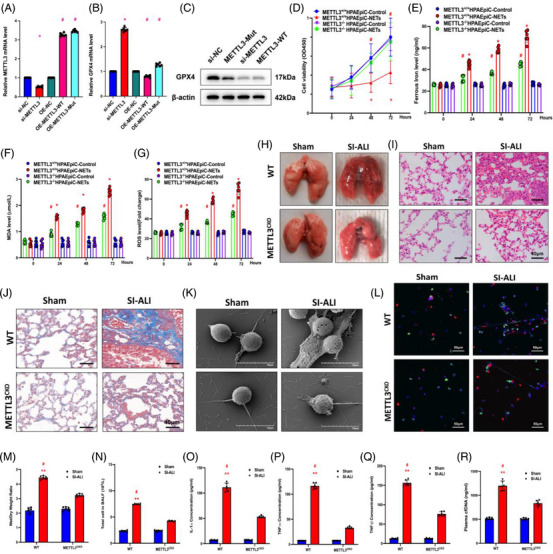
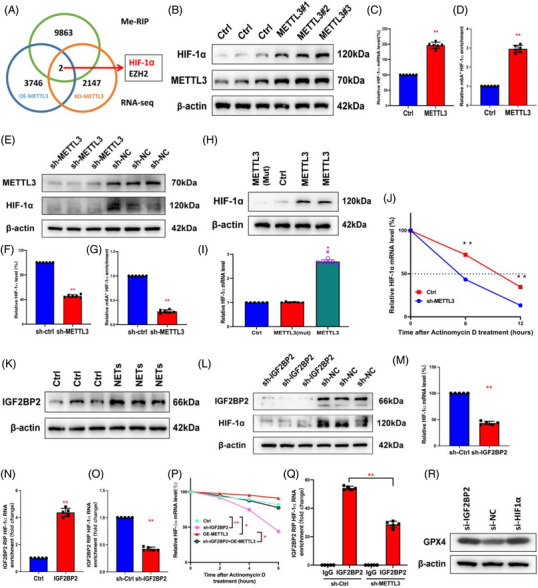
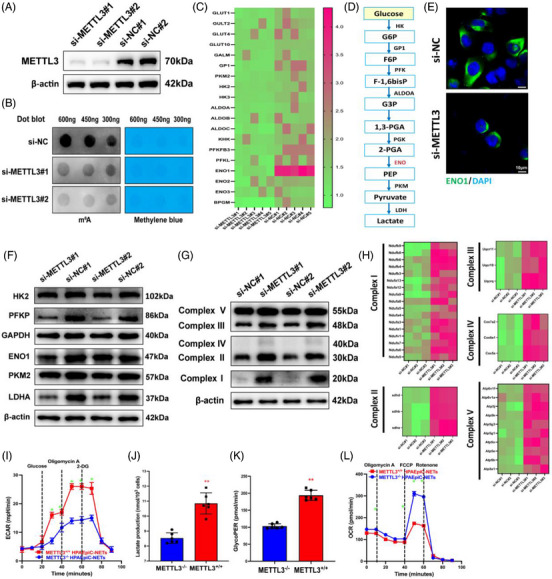
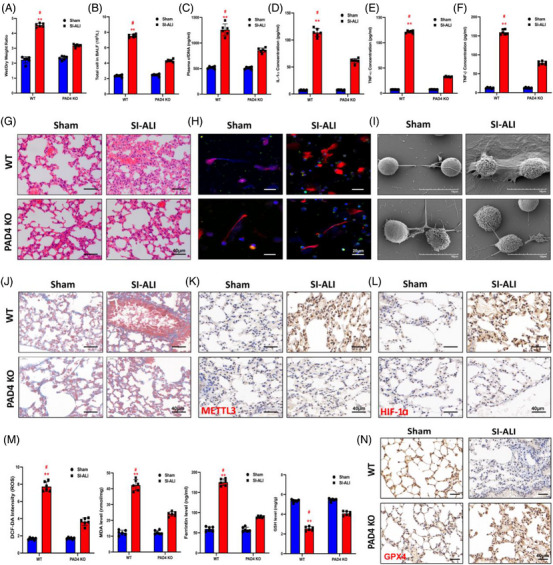
Neutrophil extracellular traps (NETs), released by polymorphonuclear neutrophils (PMNs), exert a robust antimicrobial function in infectious diseases such as sepsis. NETs also contribute to the pathogenesis and exacerbation of sepsis. Although the lung is highly vulnerable to infections, few studies have explored the role of NETs in sepsis-induced acute lung injury (SI-ALI). We demonstrate that NETs induce SI-ALI via enhanced ferroptosis in alveolar epithelial cells. Our findings reveal that the excessive release of NETs in patients and mice with SI-ALI is accompanied by upregulation of ferroptosis depending on METTL3-induced m6A modification of hypoxia-inducible factor-1α (HIF-1α) and subsequent mitochondrial metabolic reprogramming. In addition to conducting METTL3 overexpression and knockdown experiments in vitro, we also investigated the impact of ferroptosis on SI-ALI caused by NETs in a caecum ligation and puncture (CLP)-induced SI-ALI model using METTL3 condition knockout (CKO) mice and wild-type mice. Our results indicate the crucial role of NETs in the progression of SI-ALI via NET-activated METTL3 m6A-IGF2BP2-dependent m6A modification of HIF-1α, which further contributes to metabolic reprogramming and ferroptosis in alveolar epithelial cells.

Keywords: N6-methylation; ferroptosis; metabolic reprogramming; neutrophil extracellular traps; sepsis-induced acute lung injury.


Conflict of interest statement

The authors declare they have no conflicts of interest.

Figures

FIGURE 1
FIGURE 1
A higher level of neutrophil extracellular traps (NETs) is associated with more severe lung damage and poorer prognosis in patient samples and the acute lung injury (ALI) mouse model. (A) Serum dsDNA and (B) myeloperoxidase (MPO)–DNA complexes were detected in healthy people and patients with sepsis (n = 20) and controls (n = 20). (C) Serum MPO–DNA complexes were detected in alive and dead sepsis patients. Alive (n = 13) and dead (n = 7). (D and E) Evaluate the correlation between MPO–DNA complexes and the degree of lung damage (PaO2/FiO2, SOFA score) in sepsis patients. (F) NETosis representative pictures of alive and dead patients in the controls (red: MPO, green: citrulline histone H3 [CitH3], blue: DAPI; scale bar = 20 μm). (G) Scanning electron microscopy (SEM) images of inactivated and activated neutrophils releasing NETs (scale bar = 10 μm). (H) The percentage of cells releasing NETs from sepsis–dead, sepsis–alive and healthy control (HC) patients. HC (n = 20), alive (n = 13) and dead (n = 7). (I) Representative images of immunohistochemical staining for Ly6G in lung tissues (red arrows; scale bar = 40 μm). (J) dsDNA in bronchoalveolar lavage fluid (BALF), (K) serum dsDNA and (L) serum MPO–DNA complexes were detected in sham and sepsis‐induced ALI (SI‐ALI) mice. Sham (n = 6), SI‐ALI (n = 6). * p < .05; ** p < .01. ‘Dead’ patients refer to those who have final non‐survival outcomes in intensive care unit (ICU). ‘Alive’ patients refer to those who recover and survive in ICU. Two‐way analysis of variance (ANOVA) with Tukey's correction.
FIGURE 2
FIGURE 2
Inhibiting neutrophil extracellular traps (NETs) alleviates ferroptosis in mice with sepsis‐induced acute lung injury (SI‐ALI). We used a CLP‐induced SI‐ALI mouse model. Animals were treated with saline, Cl‐amidine (inhibit NET formation), anti‐Ly6G (deplete neutrophils) and DNase I (degrade NET structures). (A) 2',7'‐Dichlorodihydrofluorescein diacetate (DCF‐DA) assay was used to analyse reactive oxygen species (ROS) levels in mouse lung tissues. (B) ELISA measured the level of ferritin in mouse lung tissues. (C) An iron assay kit detected ferrous iron (Fe2+) levels. (D) A lipid peroxidation assay kit measured the level of MDA. (E) ELISA measured the level of glutathione (GSH). (F) Real‐time quantitative PCR (RT‐qPCR) analysed glutathione‐peroxidase 4 (GPX4) mRNA expression level. (G) Images of transmission electron microscopy showed morphological changes in mitochondria (scale bar = 500 μm). * p < .05; ** p < .01. #SI‐ALI group versus sham group (two‐way analysis of variance [ANOVA] with Tukey's correction).
FIGURE 3
FIGURE 3
Neutrophil extracellular traps (NETs) induce ferroptosis in alveolar epithelial cells and impair cell viability. (A) Representative images of control and NET‐treated human alveolar epithelial cells (HPAEpiC) cells with or without administering ferroptosis inhibitor Fer‐1 (scale bar = 100 μm). (B) Cell viability was measured by Cell Counting Kit‐8 (CCK‐8) assay. (C) An iron assay kit measured ferrous iron (Fe2+) levels. (D) ELISA measured the level of glutathione (GSH). (E) The level of reactive oxygen species (ROS) was detected by DCF‐DA assay. (F) Real‐time quantitative PCR (RT‐qPCR) measured the glutathione‐peroxidase 4 (GPX4) mRNA levels. (G) Representative immunofluorescence (IF) images showed the time‐dependent morphological changes of HPAEpiC cells (scale bar = 50 μm). (H and I) The GPX4 protein and mRNA levels were analysed by IF and Western blotting, respectively. * p < .05. #NETs + Fer‐1 versus NETs + PBS (two‐way analysis of variance [ANOVA] with Tukey's correction).
FIGURE 4
FIGURE 4
Neutrophil extracellular traps (NETs) promote METTL3 transcription via activation of H3K27ac signalling, catalysed by p300. (A and D) The level of m6A modification was analysed by dot blot assay. (B) RNA sequencing (RNA‐seq) identified the upregulation of METTL3 in NET‐treated alveolar epithelial cells. (C) Real‐time quantitative PCR (RT‐qPCR) confirmed the upregulation of METTL3 and IGF2BP2. (E and F) Western blot analysis shows that NETs increased p300, METTL3 and H3K27ac. While DNase I reversed these changes, (G) p300 inhibitor C646 reduced protein levels of H3K27ac and METTL3 in Western blot analysis. (H) C646, confirmed by RT‐qPCR, inhibited the relative METTL3 mRNA level. (I–K) Based on the Western blot and RT‐qPCR results, the protein and mRNA levels of METTL3 decreased due to the silencing of p300. (L) The chromatin immunoprecipitation (ChIP) results confirmed that the knockdown of p300 decreased the enrichment of H3K27ac signalling. ** p < .01 (two‐way analysis of variance [ANOVA] with Tukey's correction).
FIGURE 5
FIGURE 5
The knockout of METTL3 attenuates sepsis‐induced acute lung injury (SI‐ALI). (A and B) Real‐time quantitative PCR (RT‐qPCR) was used to evaluate METTL3 and glutathione‐peroxidase 4 (GPX4) mRNA levels in the si‐METTL3, OE‐METTL3 and OE‐METTL3‐Mut groups. (C) GPX4 protein levels in si‐NC, METTL3‐Mut, si‐METTL3 and METTL3‐WT groups. (D) Cell Counting Kit‐8 (CCK‐8) assay evaluated human alveolar epithelial cells (HPAEpiC) cell viability (n = 6 in each group). (E) An iron assay kit was used to measure ferrous iron (Fe2+) levels (n = 6 in each group). (F) A lipid peroxidation assay kit measured the MDA levels (n = 6 in each group). (G) The level of reactive oxygen species (ROS) was detected by DCF‐DA assay (n = 6 in each group). (H) Lung tissues from wild‐type (WT) and METTL3 CKO mice with SI‐ALI. (I) Images from haematoxylin and eosin (H&E) staining of lung tissues evaluated the degree of lung damage and inflammation. (J) Images from Masson staining of lung tissues evaluated the degree of lung fibrosis. (K) Scanning electron microscope evaluated the neutrophil extracellular trap (NET) level of NETs from WT and METTL3 CKO mice in the sham and SI‐ALI groups. (L) Immunofluorescence (IF) analysed the level of NETs from WT and METTL3 CKO mice in sham and SI‐ALI groups. (M) The degree of lung damage was evaluated by wet/dry ratio (n = 6 in each group). (N) Cell counting in mouse models (n = 6 in each group) measured total cells in bronchoalveolar lavage fluid (BALF). (O–Q) The degree of systemic inflammation was evaluated by tumour necrosis factor (TNF)‐α, TNF‐β and IL‐1α (n = 6 in each group). (R) The plasma cfDNA was detected in WT and METTL3 CKO mice in sham and SI‐ALI groups (n = 6 in each group). (N–P) * p < .05; ** p < .01. #SI‐ALI versus Sham (two‐way analysis of variance [ANOVA] with Tukey's correction).
FIGURE 6
FIGURE 6
METTL3 mediates m6A modification of hypoxia‐inducible factor‐1α (HIF‐1α) depending on IGF2BP2. (A) RNA sequencing (RNA‐seq) and MeRIP‐seq were used to identify differentially expressed genes in METTL3 overexpression and knockout cells compared to their corresponding controls. (B) In control and overexpressing‐METTL3 groups, Western blot evaluated the METTL3 and HIF‐1α. (C) Relative HIF‐1α mRNA level was evaluated by real‐time quantitative PCR (RT‐qPCR) in overexpressing‐METTL3 and control groups (n = 6 in each group). (D) MeRIP‐qPCR analysis evaluated the m6A modification of HIF‐1α level in controls and METTL3‐overexpressing groups (n = 6 in each group). (E–G) In sh‐METTL3 and sh‐NC groups, Western blot evaluated the METTL3 and HIF‐1α. RT‐qPCR evaluated the relative HIF‐1α mRNA level. MeRIP‐qPCR analysis was used to evaluate the m6A modification of the HIF‐1α level (n = 6 in each group). (H and I) The mRNA and protein levels of HIF‐1α were evaluated by RT‐qPCR and Western blot, respectively, in METTL3‐Mut, controls and METTL3 group (n = 6 in each group). (J) Relative HIF‐1α RT‐qPCR evaluated mRNA level in METTL3 knockout group and wild type (WT) (n = 6 in each group). (K) Western blot analysis revealed an increase in IGF2BP2 after neutrophil extracellular trap (NET) stimulation. (L and M) Western blot and RT‐qPCR evaluated HIF‐1α protein and mRNA levels in the sh‐IGF2BP2 group and controls. The dashed line shows the half‐life of HIF‐1α in response to actinomycin D. (N and O) RIP assays showed an upregulated and downregulated interaction between HIF‐1α and IGF2BP when IGF2BP2 was overexpressed and silenced. (P) RT‐qPCR evaluated relative HIF‐1α mRNA level in control, sh‐IGF2BP2, OE‐METTL3 and sh‐IGF2BP2 + OE‐METTL3 groups after actinomycin D treatment (n = 6 in each group). (Q) RIP assays showed the interaction between HIF‐1α and IGF2BP when METTL3 was silenced. (R) The protein level of glutathione‐peroxidase 4 (GPX4) was increased in the sh‐IGF2BP2 group and sh‐HIF‐1α group via Western blot. ** p < .01 (two‐way analysis of variance [ANOVA] with Tukey's correction).
FIGURE 7
FIGURE 7
METTL3 induces enhanced glycolysis and decreased oxidative phosphorylation. (A) Western blot analysis verifies the efficiency of knockdown METTL3. (B) The level of m6A modification was analysed by dot blot assay. (C) RNA sequencing (RNA‐seq) evaluated glycolysis‐associated genes in METTL3 knockdown groups and controls. (D) A simplified metabolic flow diagram of glycolysis. (E) The level of enolase 1 (ENO1) was evaluated by immunofluorescence (IF) assay in METTL3 knockdown groups and controls. (F) The protein levels of glycolytic enzymes were evaluated by Western blot in METTL3 knockdown groups and controls. (G) Complex I∼V‐associated protein expression levels were evaluated by Western blotting in METTL3 knockdown groups and controls. (H) RNA‐seq evaluated complex I∼V‐associated genes in mitochondria in METTL3 knockdown groups and controls. (I) Extracellular acidification rate (ECAR) evaluated the degree of glycolysis in METTL3+/+ and METTL3−/− cells treated with neutrophil extracellular traps (NETs) over time. (J and K) Lactate and glycoPER production evaluated the degree of glycolysis in METTL3+/+ and METTL3−/− cells treated with NETs. (L) The oxygen consumption rate (OCR) evaluated the degree of aerobic glucose metabolism in METTL3+/+ and METTL3−/− cells treated with NETs over time. ** p < .01 (two‐way analysis of variance [ANOVA] with Tukey's correction).
FIGURE 8
FIGURE 8
Peptidyl arginine deiminase 4 (PAD4) knockout alleviates ferroptosis in alveolar epithelial cells and sepsis‐induced acute lung injury (SI‐ALI). (A) The degree of lung damage was evaluated by wet/dry ratio from wild‐type (WT) and PAD4 knockout (KO) mice in sham and SI‐ALI groups (n = 6 in each group). (B) Cell counting (n = 6 in each group) measured total cells in bronchoalveolar lavage fluid (BALF). (C) Plasma cfDNA evaluated neutrophil extracellular trap (NET) formation from WT and PAD4 KO mice in sham and SI‐ALI groups (n = 6 in each group). (D–F) Interleukin (IL)‐1α, tumour necrosis factor (TNF)‐α and TNF‐β evaluated the degree of systemic inflammation. (G) Images from haematoxylin and eosin (H&E) staining of lung tissues evaluated the degree of lung damage. Images from immunofluorescence (IF) assay (H) and scanning electron microscopy (SEM) (I) evaluated the level of NETs. (J) The degree of lung fibrosis was evaluated by Masson staining analysis. The levels of METTL3 (K), hypoxia‐inducible factor‐1α (HIF‐1α) (L) and glutathione‐peroxidase 4 (GPX4) (N) were evaluated by IHC. (M) The level of ferroptosis was evaluated by reactive oxygen species (ROS), MDA, ferritin and glutathione (GSH) (n = 6 in each group). ** p < .01. #SI‐ALI versus Sham (two‐way analysis of variance [ANOVA] with Tukey's correction).

Similar articles

Cited by

References

    1. Meyer NJ, Gattinoni L, Calfee CS. Acute respiratory distress syndrome. Lancet. 2021;398:622‐637. doi:10.1016/s0140-6736(21)00439-6 - DOI - PMC - PubMed
    1. Tomazini BM, Maia IS, Cavalcanti AB, et al. Effect of dexamethasone on days alive and ventilator‐free in patients with moderate or severe acute respiratory distress syndrome and COVID‐19: the CoDEX randomized clinical trial. JAMA. 2020;324:1307‐1316. doi:10.1001/jama.2020.17021 - DOI - PMC - PubMed
    1. Karalapillai D, Weinberg L, Peyton P, et al. Effect of intraoperative low tidal volume vs conventional tidal volume on postoperative pulmonary complications in patients undergoing major surgery: a randomized clinical trial. JAMA. 2020;324:848‐858. doi:10.1001/jama.2020.12866 - DOI - PMC - PubMed
    1. Connors JM, Levy JH. COVID‐19 and its implications for thrombosis and anticoagulation. Blood. 2020;135:2033‐2040. doi:10.1182/blood.2020006000 - DOI - PMC - PubMed
    1. Matthay MA, Zemans RL, Zimmerman GA, et al. Acute respiratory distress syndrome. Nat Rev Dis Primers. 2019;5:18. doi:10.1038/s41572-019-0069-0 - DOI - PMC - PubMed

Publication types