

Examining the Influence of Imbalanced Social Contact Matrices in Epidemic Models
- PMID: 37715459
- PMCID: PMC10840077
- DOI: 10.1093/aje/kwad185
Examining the Influence of Imbalanced Social Contact Matrices in Epidemic Models
Abstract
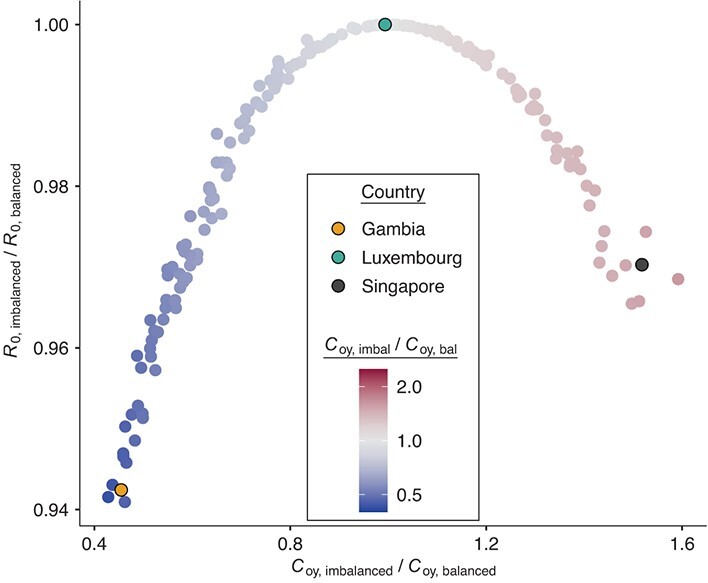
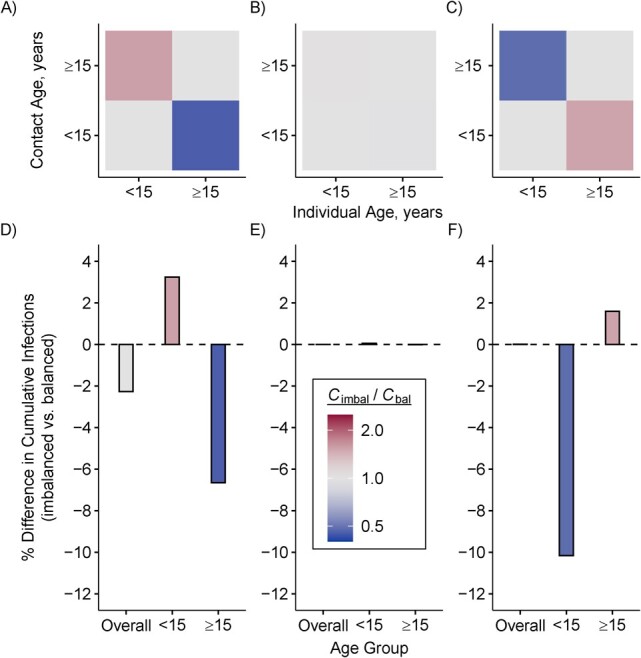
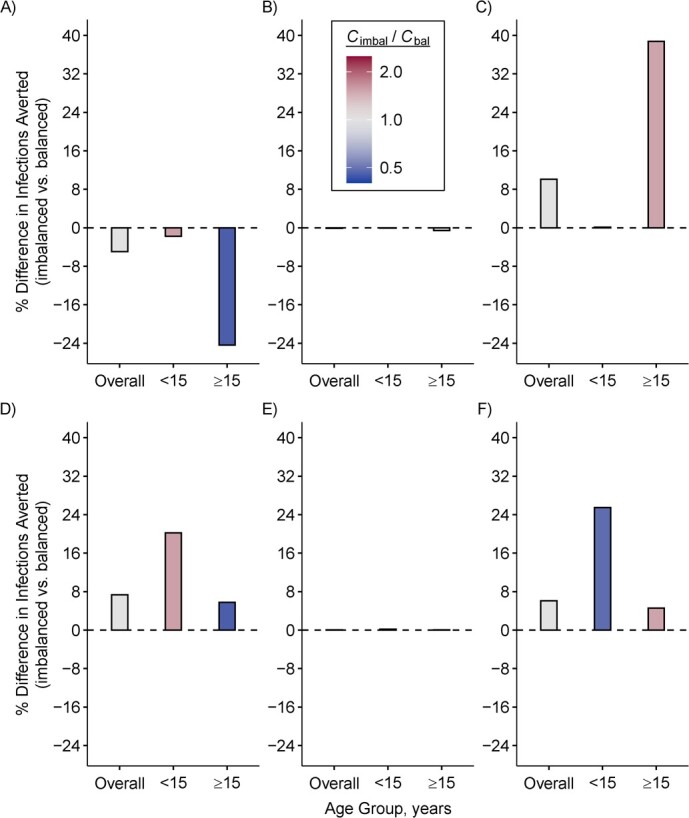
Transmissible infections such as those caused by severe acute respiratory syndrome coronavirus 2 (SARS-CoV-2) spread according to who contacts whom. Therefore, many epidemic models incorporate contact patterns through contact matrices. Contact matrices can be generated from social contact survey data. However, the resulting matrices are often imbalanced, such that the total number of contacts reported by group A with group B do not match those reported by group B with group A. We examined the theoretical influence of imbalanced contact matrices on the estimated basic reproduction number (R0). We then explored how imbalanced matrices may bias model-based epidemic projections using an illustrative simulation model of SARS-CoV-2 with 2 age groups (<15 and ≥15 years). Models with imbalanced matrices underestimated the initial spread of SARS-CoV-2, had later time to peak incidence, and had smaller peak incidence. Imbalanced matrices also influenced cumulative infections observed per age group, as well as the estimated impact of an age-specific vaccination strategy. Stratified transmission models that do not consider contact balancing may generate biased projections of epidemic trajectory and the impact of targeted public health interventions. Therefore, modeling studies should implement and report methods used to balance contact matrices for stratified transmission models.
Keywords: SARS-CoV-2; contact balance; contact mixing; contact reciprocity; infectious disease modeling; vaccine policy.
© The Author(s) 2024. Published by Oxford University Press on behalf of the Johns Hopkins Bloomberg School of Public Health.
Figures
Similar articles
-
Epidemic Landscape and Forecasting of SARS-CoV-2 in India.J Epidemiol Glob Health. 2021 Mar;11(1):55-59. doi: 10.2991/jegh.k.200823.001. Epub 2020 Aug 28. J Epidemiol Glob Health. 2021. PMID: 32959618 Free PMC article.
-
Transmission dynamics and control of two epidemic waves of SARS-CoV-2 in South Korea.BMC Infect Dis. 2021 May 26;21(1):485. doi: 10.1186/s12879-021-06204-6. BMC Infect Dis. 2021. PMID: 34039296 Free PMC article.
-
Impact of the Covid-19 epidemic and related social distancing regulations on social contact and SARS-CoV-2 transmission potential in rural South Africa: analysis of repeated cross-sectional surveys.BMC Infect Dis. 2021 Sep 8;21(1):928. doi: 10.1186/s12879-021-06604-8. BMC Infect Dis. 2021. PMID: 34496771 Free PMC article.
-
Impact of self-imposed prevention measures and short-term government-imposed social distancing on mitigating and delaying a COVID-19 epidemic: A modelling study.PLoS Med. 2020 Jul 21;17(7):e1003166. doi: 10.1371/journal.pmed.1003166. eCollection 2020 Jul. PLoS Med. 2020. PMID: 32692736 Free PMC article.
-
Quarantine alone or in combination with other public health measures to control COVID-19: a rapid review.Cochrane Database Syst Rev. 2020 Sep 15;9(9):CD013574. doi: 10.1002/14651858.CD013574.pub2. Cochrane Database Syst Rev. 2020. PMID: 33959956 Free PMC article.
Cited by
-
Directly observed social contact patterns among school children in rural Gambia.Epidemics. 2024 Dec;49:100790. doi: 10.1016/j.epidem.2024.100790. Epub 2024 Sep 11. Epidemics. 2024. PMID: 39270441 Free PMC article.
-
Improving the Use of Social Contact Studies in Epidemic Modeling.Epidemiology. 2025 Sep 1;36(5):660-667. doi: 10.1097/EDE.0000000000001876. Epub 2025 Jun 13. Epidemiology. 2025. PMID: 40513075 Free PMC article.
-
Quantifying age-specific household contacts in Aotearoa New Zealand for infectious disease modelling.R Soc Open Sci. 2024 Oct 2;11(10):240550. doi: 10.1098/rsos.240550. eCollection 2024 Oct. R Soc Open Sci. 2024. PMID: 39359472 Free PMC article.
-
Towards pandemic preparedness: ability to estimate high-resolution social contact patterns from longitudinal surveys.Res Sq [Preprint]. 2024 Dec 11:rs.3.rs-5182601. doi: 10.21203/rs.3.rs-5182601/v1. Res Sq. 2024. Update in: Sci Rep. 2025 May 23;15(1):17935. doi: 10.1038/s41598-025-02235-0. PMID: 39711531 Free PMC article. Updated. Preprint.
-
Addressing survey fatigue bias in longitudinal social contact studies to improve pandemic preparedness.Sci Rep. 2025 May 23;15(1):17935. doi: 10.1038/s41598-025-02235-0. Sci Rep. 2025. PMID: 40410335 Free PMC article.
References
-
- Medlock J, Galvani AP. Optimizing influenza vaccine distribution. Science. 2009;325(5948):1705–1708. - PubMed
Publication types
MeSH terms
Grants and funding
LinkOut - more resources
Full Text Sources
Medical
Miscellaneous
